
Published: May 5th, 2022
In this week's FOMC, the Federal Reserve raised the interest rate by 50 bps with a hawkish tone. The NZDUSD price became volatile during the news release but failed to hold the bearish momentum. The price formed a strong bullish daily candle from the 0.6410 key support level.
Although the calendar is almost muted for the NZD, the hope for bulls awaits further attention from the upcoming NFP. The US Non-Farm Payroll will be released on Friday, where the current expectation is a decrease of 391K from 431K. However, the hope of the US dollar is still active as the unemployment rate is expected to come lower from 3.6% to 3.5%. Overall, the market may remain corrective until the NFP release, when the NZD has a higher possibility of creating a ground against the US Dollar.
Let’s see the future price direction from the NZDUSD technical analysis:
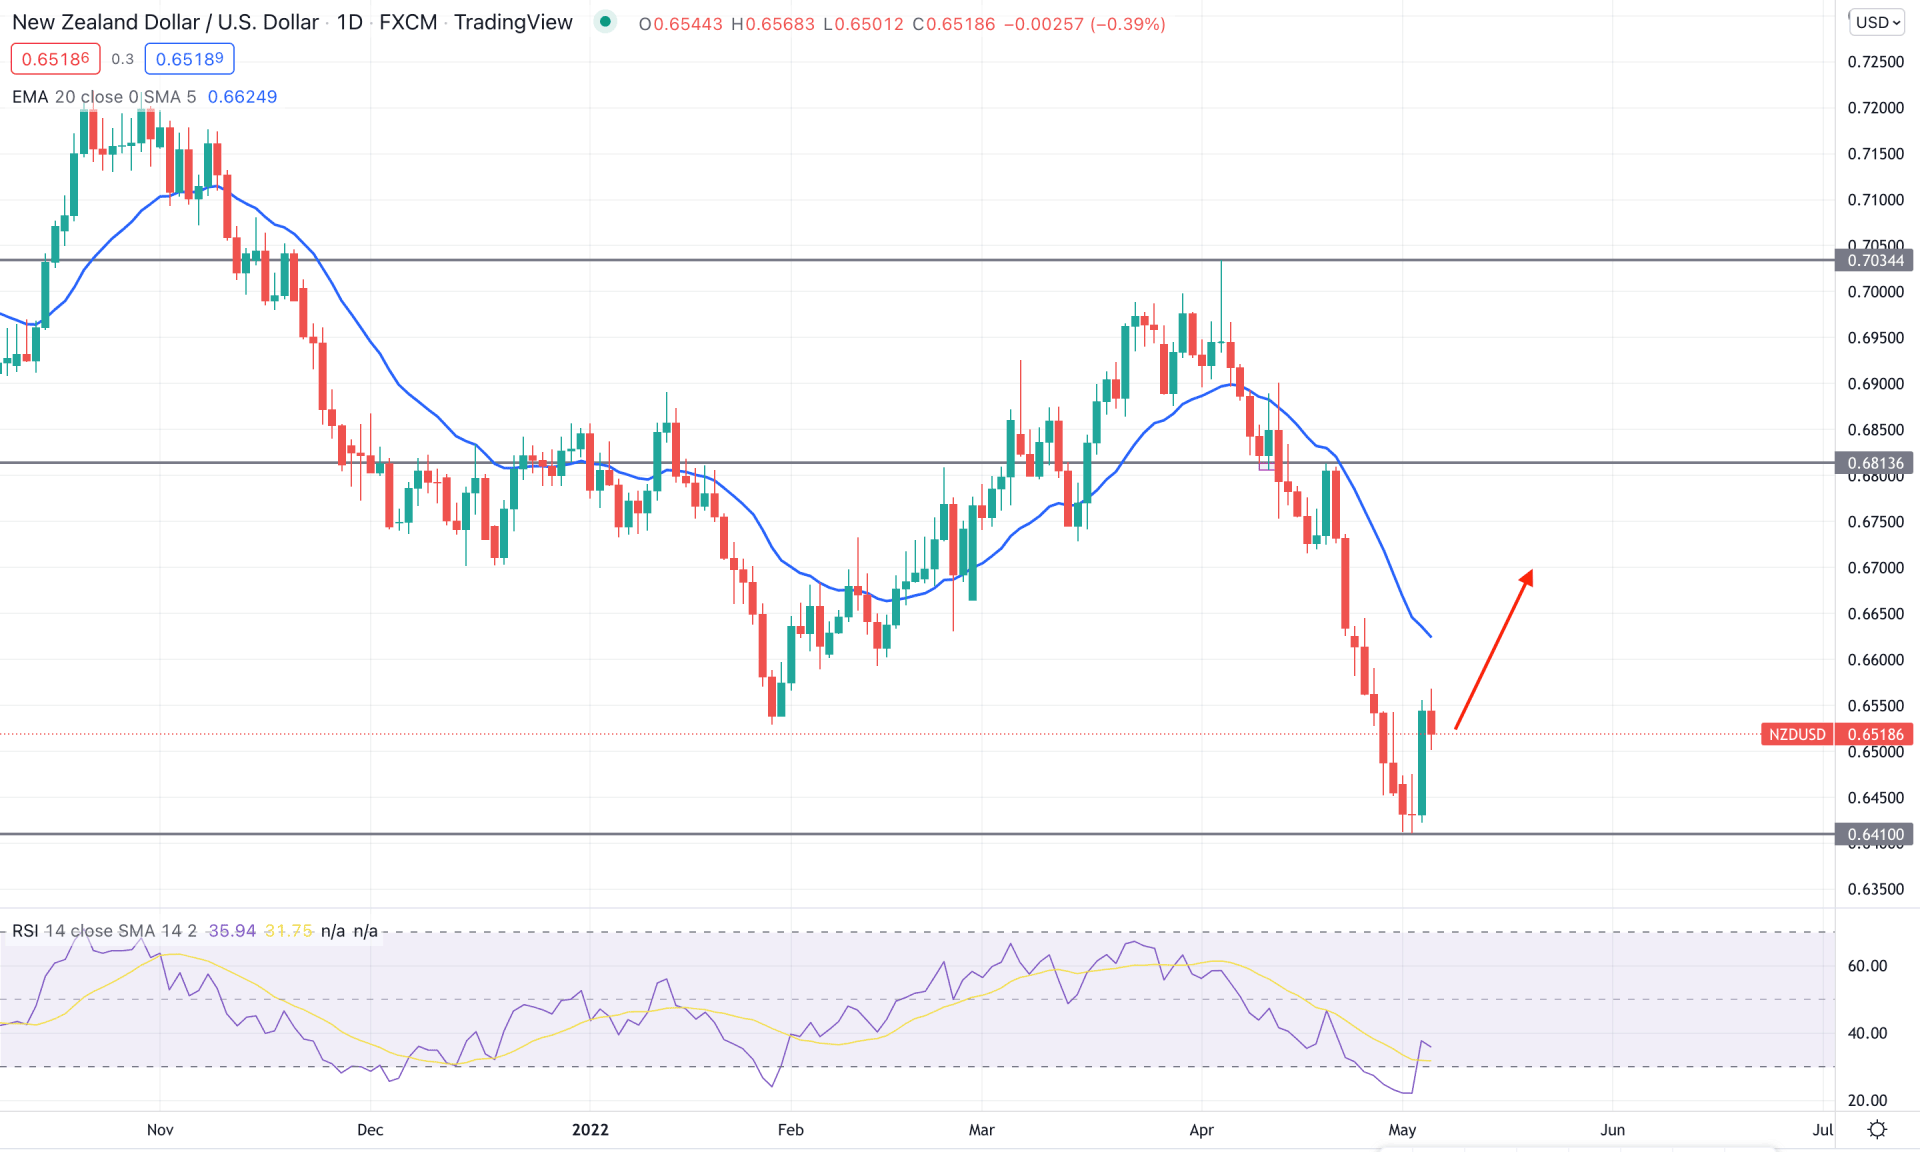
NZDUSD reached the multi-year low this week where the test of 0.6410 level with a strong bullish daily candle is the primary hope for bulls after the 628 pips bearish rally. However, the bullish weekly close filled by the wick rejection would increase the buying pressure for the coming days. The weekly RSI has rebounded from the 34 level while the MACD Histogram remained bearish. Therefore, close attention to the daily and intraday price action is needed in this pair before going long.
The above image shows the daily chart of NZDUSD, where the latest daily candle appeared with a strong buying momentum from the 0.6410 support level. Meanwhile, the RSI shifted its direction after reaching the oversold 30 level while the dynamic 20 EMA is above the current price.
Based on the daily structure, the broader market trend is still bearish while buying from where would offer a higher return. Therefore, close attention to the intraday chart is needed before going long in this instrument, where the bullish correction towards the 0.6816 would provide a 300 pips gain from the buy trade.
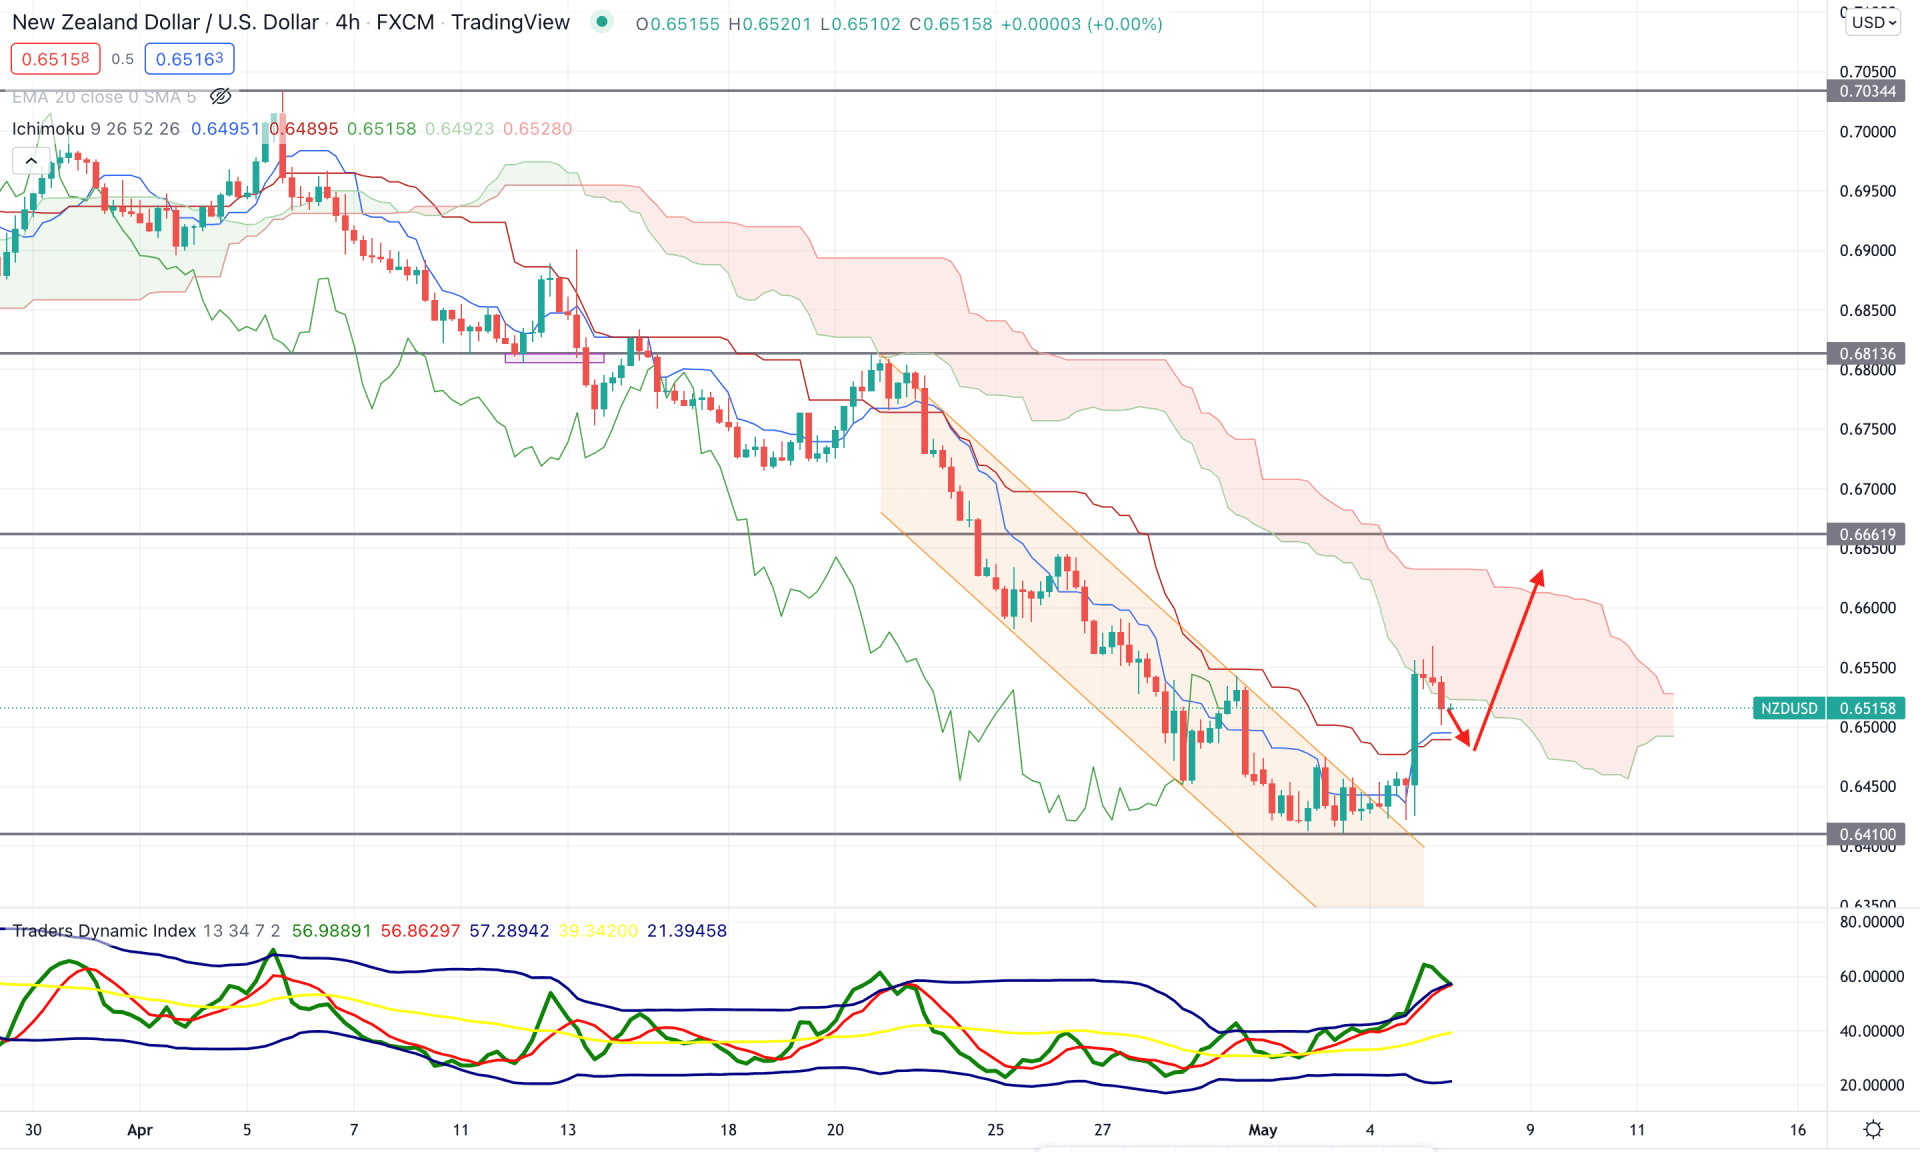
According to the Ichimoku Cloud in the H4 chart, the broader market direction awaits further signs before going long. The overall trend is still bearish as the Kumo Cloud is above it. Moreover, the Senkou Span A is still below the Senkou Span B in the future cloud. In this context, close attention to the near-term price action is needed before taking a trade.
The above image shows how the Trader Dynamic Index reached the upper band, indicating a strong buyer dominance in the price. Moreover, the bearish channel breakout pushed bulls to increase the price above the dynamic Kijun Sen with an impulsive bullish pressure.
Based on the current H4 price condition, bears should wait for the price to move below the 0.6410 with an H4 close to extend the bearish opportunity towards the 0.6300 level. On the other hand, a bullish H4 candle above the current Senkou Span A level would raise the price higher towards the 0.6661 resistance level.
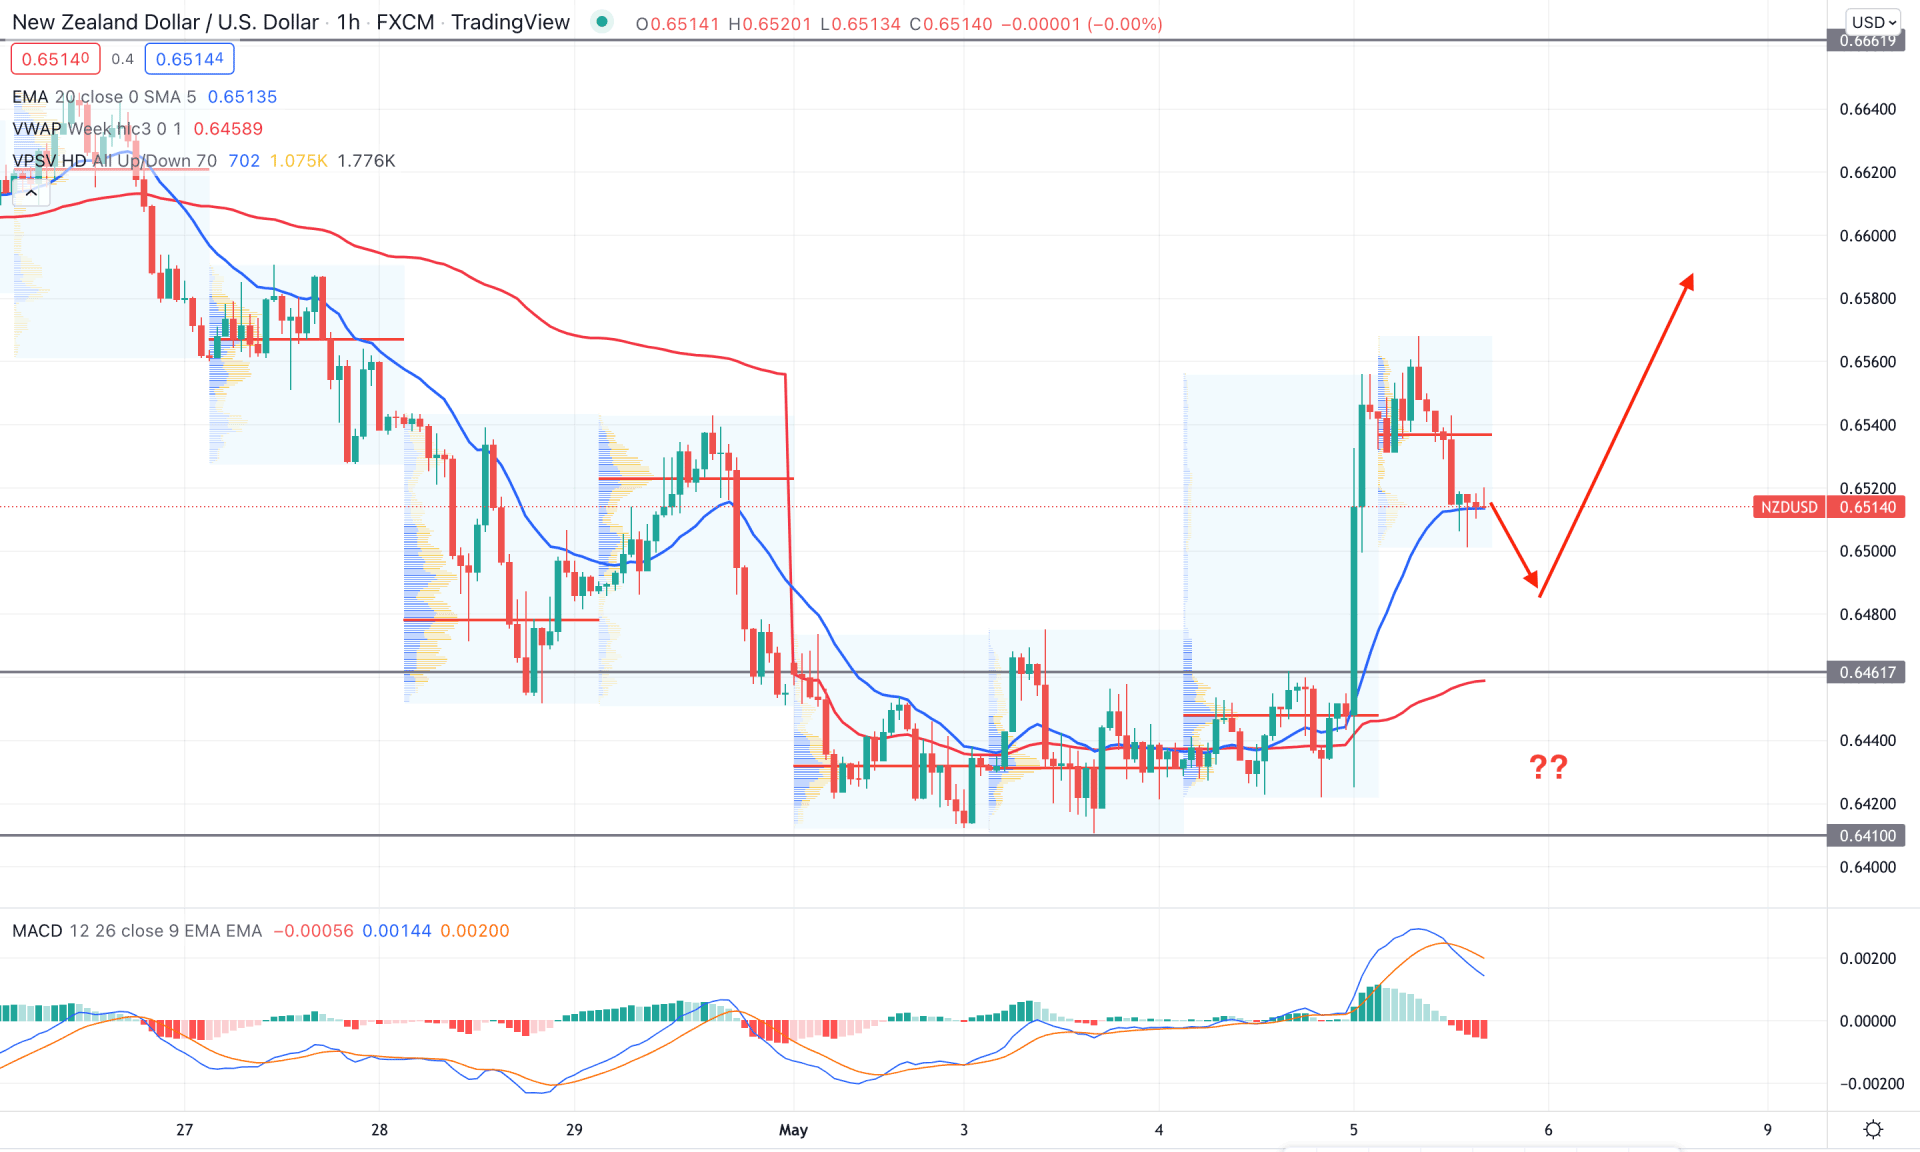
The FOMC movement came after a long consolidation in the intraday chart, which is the perfect example of a trend-changing breakout in the intraday chart. The price grabbed orders from 0.6461 to 0.6410 area and shot higher with a strong bullish H1 candle. Moreover, the buying pressure pushed the price above the dynamic 20 EMA, which is currently acting as an immediate support level.
The above image shows the intraday chart of NZDUSD, where the gap between the dynamic 20 EMA and weekly VWAP is extended, opening the possibility of a further bearish correction in the chart. On the other hand, the MACD Histogram is still bearish while the MACD Line crosses the EMA line to push the bearish pressure.
Therefore, intraday traders should wait for the price to move lower where a bullish rejection from dynamic weekly VWAP or static 0.6461 level would open a bullish opportunity. On the other hand, as the broader market trend is still bearish, a break below the 0.6410 would eliminate the bullish possibility and lower the price toward the 0.6300 area.
As per the current market context, investors need closer attention to the intraday chart before finding a bullish opportunity in this pair. However, the broader market direction is still bearish, where the taking out of FOMC movement with an H1 close below the 0.6410 would be a high probable bearish opportunity.