
Published: February 26th, 2026
In the current session, the Japanese yen (JPY) gave up half of its initial gains but is still trading bullish against the New Zealand Dollar. Following remarks by Bank of Japan (BoJ) Governor Kazuo Ueda indicating that the possibility of an interest rate hike is still open, the NZDJPY pair arrived under pressure.
The Japanese Yen (JPY) has been under pressure for the past two trading days after a Mainichi daily report this week. It revealed that during an interview, Japan's Prime Minister (PM), Sanae Takaichi, expressed concerns about the BoJ's plans to raise interest rates further.
In addition, Toichiro Asada and Ayano Sato, who are regarded as ardent supporters of economic stimulus, were nominated by the government to serve on the central bank's nine-member board. This development raises questions about the chances for a hawkish BoJ.
On the other hand, New Zealand's ANZ Business Confidence Index fell to 59.2 in February, which was 64.1 in January, its lowest level since last October. From 51.6 to 52.6, the ANZ Activity Outlook increased somewhat. In the meantime, inflation forecasts reached their highest level since April 2024, rising from 2.77% to 2.93%.
Although the road back to 2% inflation has been bumpy, Reserve Bank of New Zealand (RBNZ) Governor Anna Breman stated last week that inflation is expected to come back to the desired range in the first quarter of this year.
Let's see the complete outlook from the NZDJPY technical analysis:
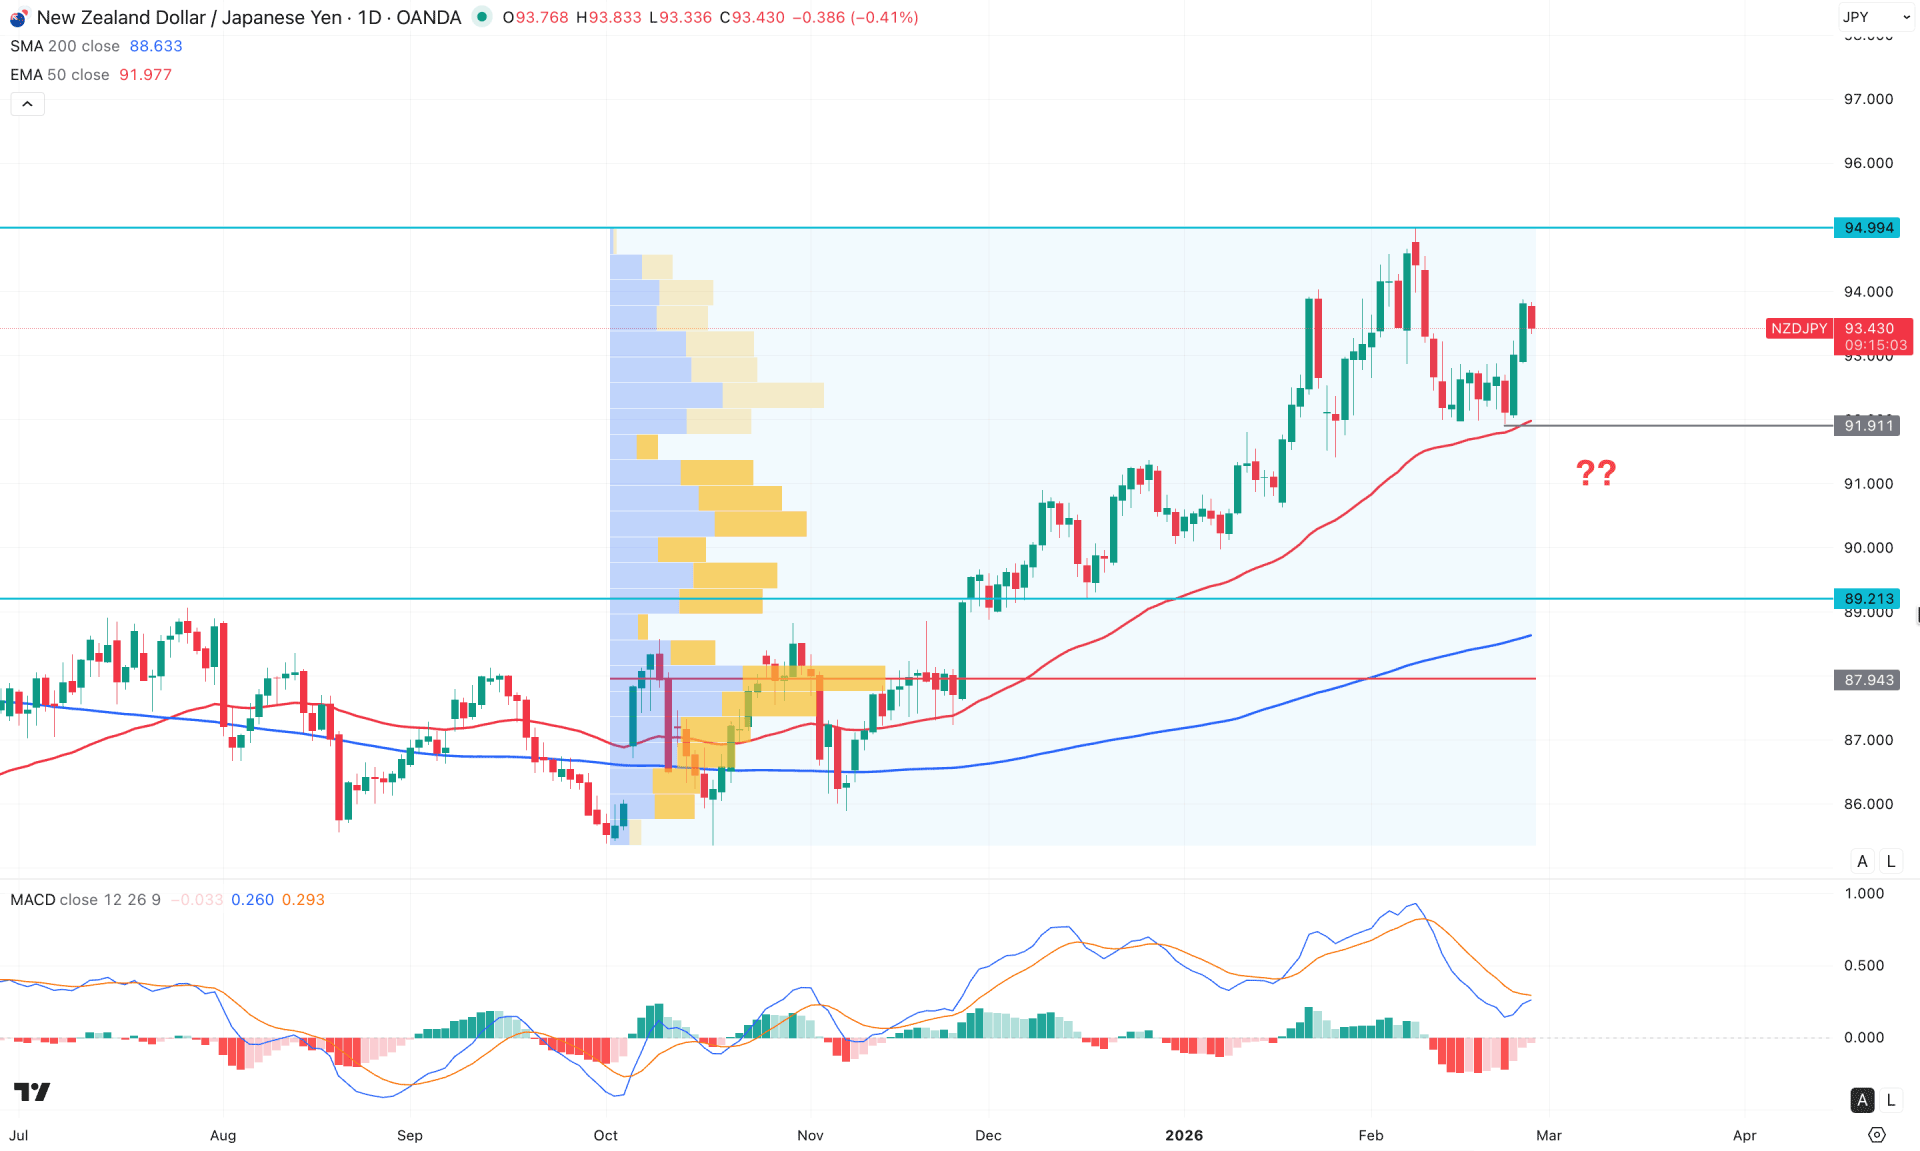
In the daily chart of NZDJPY, the major market momentum is bullish, as the price keeps rising with no significant downside recovery. Since no valid top formation is visible, the primary aim for this pair is to look for long trades only.
In the higher timeframe, the price has been rising for five consecutive months with no significant downside recovery. The weekly timeframe shows a similar scenario, where downside pressure from the 94.96 high failed to create a lower low.
In terms of volume structure, market momentum is still bullish, as no significant high-volume level is seen at the premium zone. However, there is a strong gap from the existing high-volume line since October 2025, which signals a possible downside correction.
On the main price chart, the 200-day SMA and the 50-day EMA are pointing higher, with the current price maintaining buying pressure above these lines. As the price keeps rising, supported by these dynamic lines, we may find the golden cross continuation system as a valid trading opportunity.
In the indicator window, the MACD histogram has failed to hold momentum in negative territory and has rebounded to the neutral point. Moreover, the signal line remains above the neutral point, with a possible bullish crossover in sight.
Based on the overall market structure, investors should closely monitor how the price reacts above the 91.91 key support level. As long as the price remains above this line, the primary expectation is to look for long trades targeting the 94.99 level. Moreover, if the price overcomes the 95.00 psychological level, buying pressure may extend toward the 97.00 area.
On the downside, a minor downside correction is possible. The price could extend downward pressure to the 92.89 area before resuming the bullish trend. However, sustained selling pressure with a daily close below the 50-day EMA could trigger a broader correction, potentially taking the price toward the 90.00 psychological level.
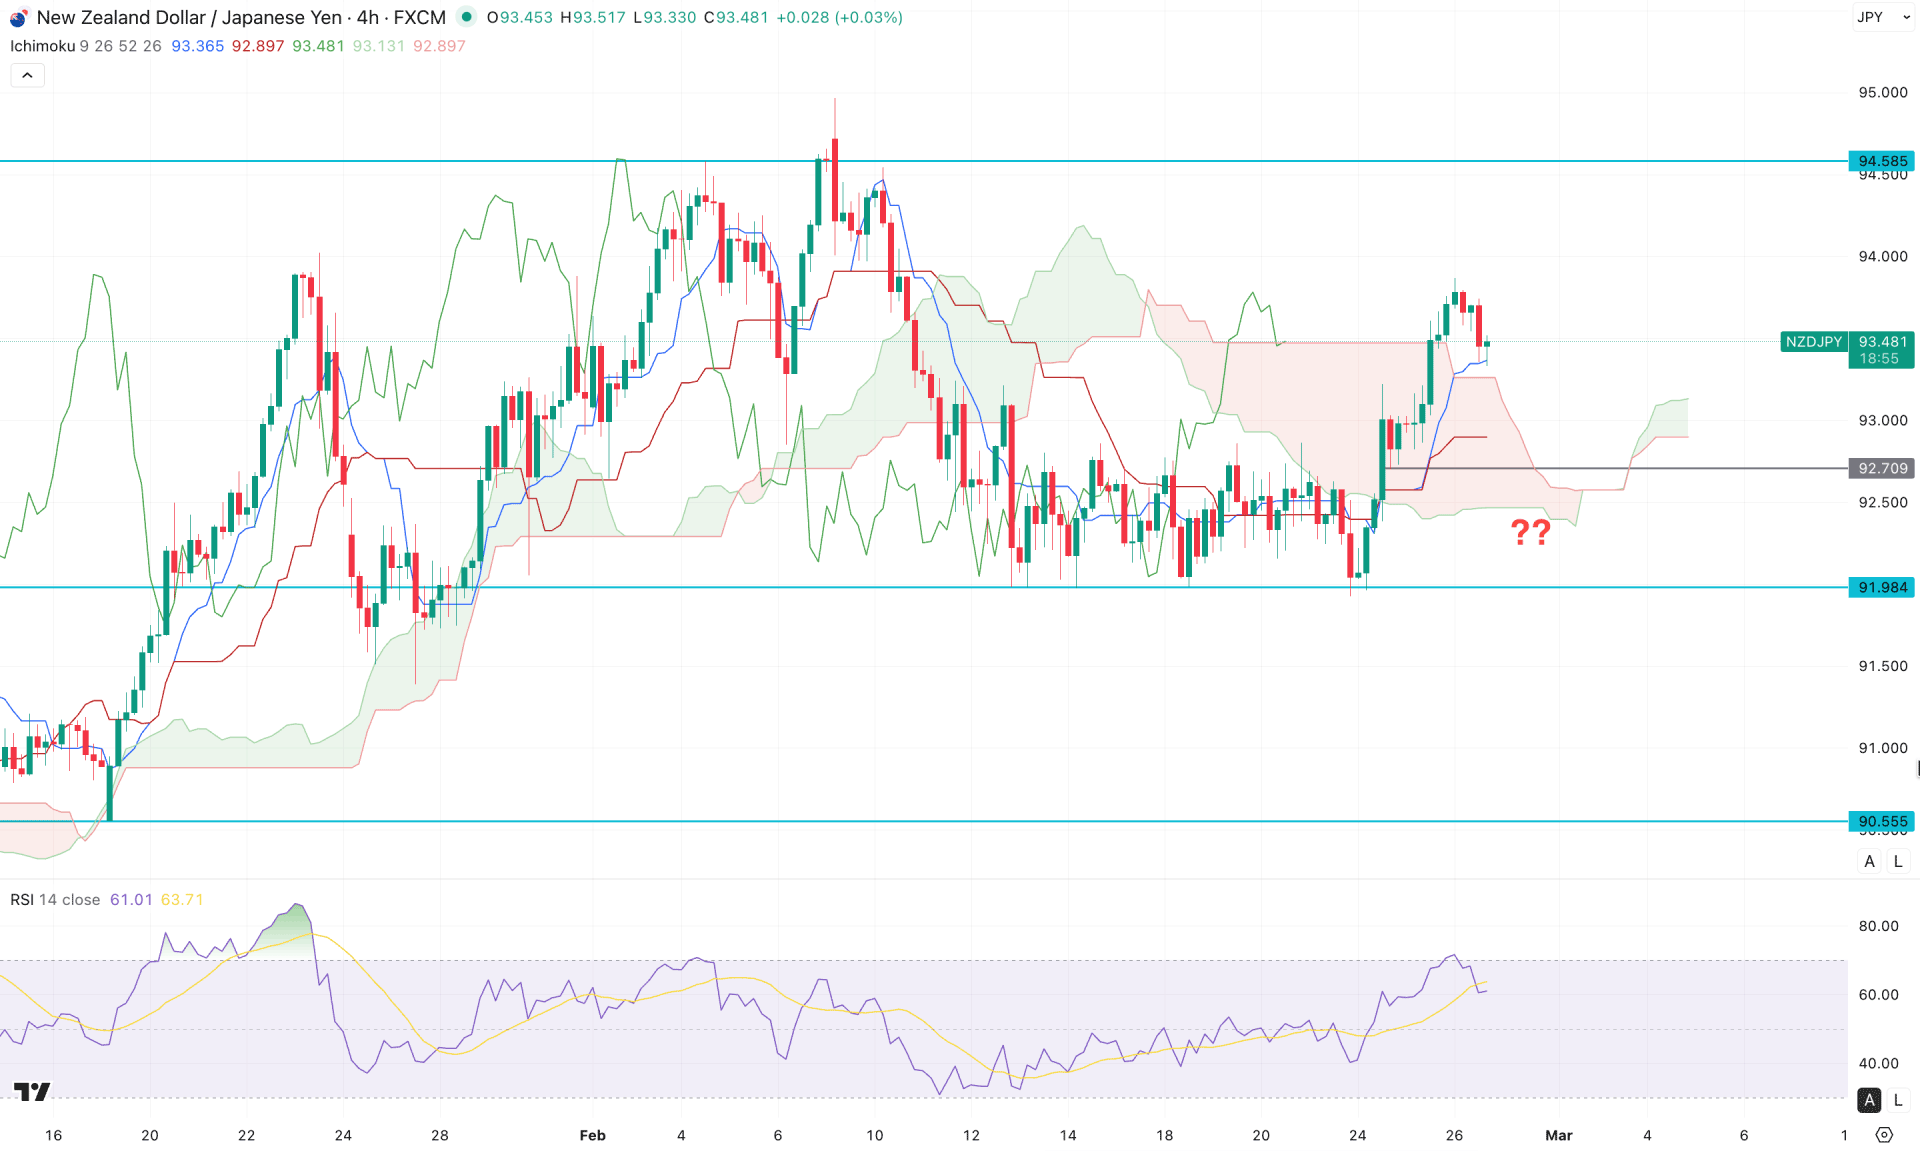
In the H4 timeframe, the NZDJPY price is experiencing a bullish range extension following a potential rectangle pattern breakout. As a result, the price has formed multiple four-hour candles above the cloud support, signaling a bullish continuation possibility.
In the future cloud, both lines have flipped positions and are aimed higher, which is a strong sign of a bullish trend continuation signal. Moreover, the dynamic level is below the current price with a bullish slope, which is another long signal.
In the indicator window, the RSI has reached the 70.00 overbought level and formed a downside reversal, indicating minor selling pressure in the main chart. However, as long as the RSI remains above the 50.00 neutral area, the main approach would be to look for long trades only.
Based on this structure, a minor downside correction is possible, which may validate the bullish breakout. In that case, a bullish pullback from the dynamic level could present a long opportunity targeting the 94.58 level. However, an immediate downside reversal with an H4 close below the 92.70 level could signal a pump and dump, potentially taking the price below the 91.98 support level.
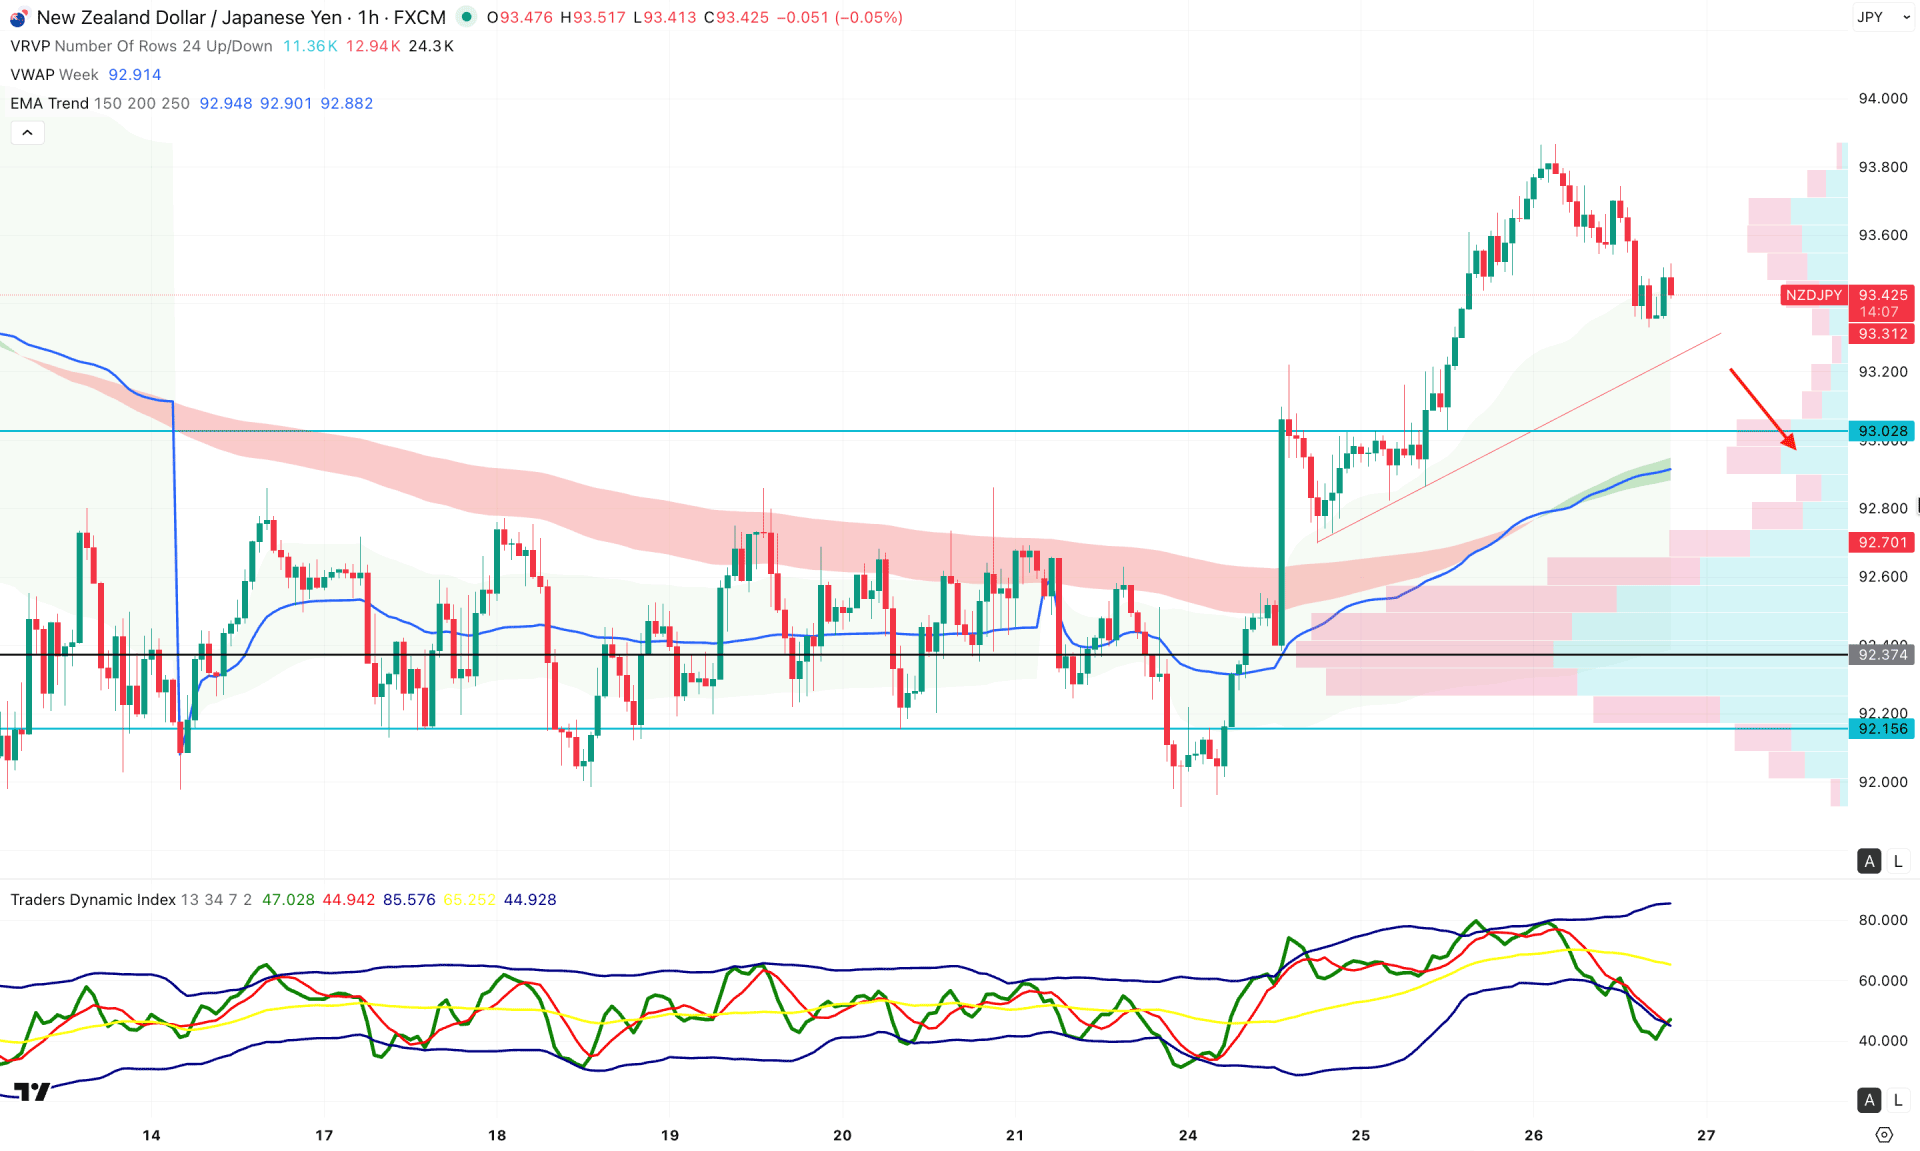
In the early timeframe, the price is trading at the daily high, where it is struggling to extend the buying pressure. Moreover, the price has created an imbalance that needs to be filled before extending the upside pressure.
On the other hand, the exponential moving average and weekly VWAP lines are both pointing upward below the current price, which presents a strong bullish continuation opportunity. The higher timeframe structure also suggests that a minor downside correction is pending as an inversion.
Based on this outlook, investors should monitor how the price reacts at the trendline support. A valid pullback below the 93.02 level, followed by an immediate bullish rebound, could present a potential long opportunity targeting the 94.00 level.
However, the current price is stalling at the top, which is already showing a downside signal. The main aim is to test the 93.00 level. Nevertheless, an immediate increase in selling pressure below the weekly VWAP, with an hourly candle close, could take the price below the 92.37 level before offering a long opportunity.
Based on our market structure, the major market momentum for NZDJPY is bullish, as no valid top formation is seen in the higher timeframe. Although the price is currently moving sideways, a minor downside correction could offer a decent long opportunity in line with the long-term market trend.


