
Published: September 4th, 2025
Following a period of vigorous tightening to fight inflation, the Reserve Bank of New Zealand (RBNZ) began steadily decreasing rates from August 2024. The central bank of New Zealand has hinted that further cuts may be forthcoming.
According to the RBNZ's most recent projections, the Official Cash Rate (OCR) is expected to drop to approximately 2.5% by the beginning of 2026, indicating at least two further reductions. The Kiwi may be weakened in the immediate future by this dovish approach, which appears more robust than many investors had anticipated.
Amid concerns surrounding tariffs, market participants continue to disagree on the probable timing and pace of Bank of Japan (BoJ) rate hikes. Furthermore, the JPY appears to be weakened by worries about growing debt levels in major nations, particularly Japan, as well as political unpredictability at home.
In addition, a steady performance in the equities markets is observed, undermining the JPY's reputation as a safe haven. However, despite strong wage growth, persistently sticky inflation, and an improving economic outlook, investors appear to be confident that the BoJ will continue on its policy normalization path.
Let's see the future price direction from the NZDJPY technical analysis:
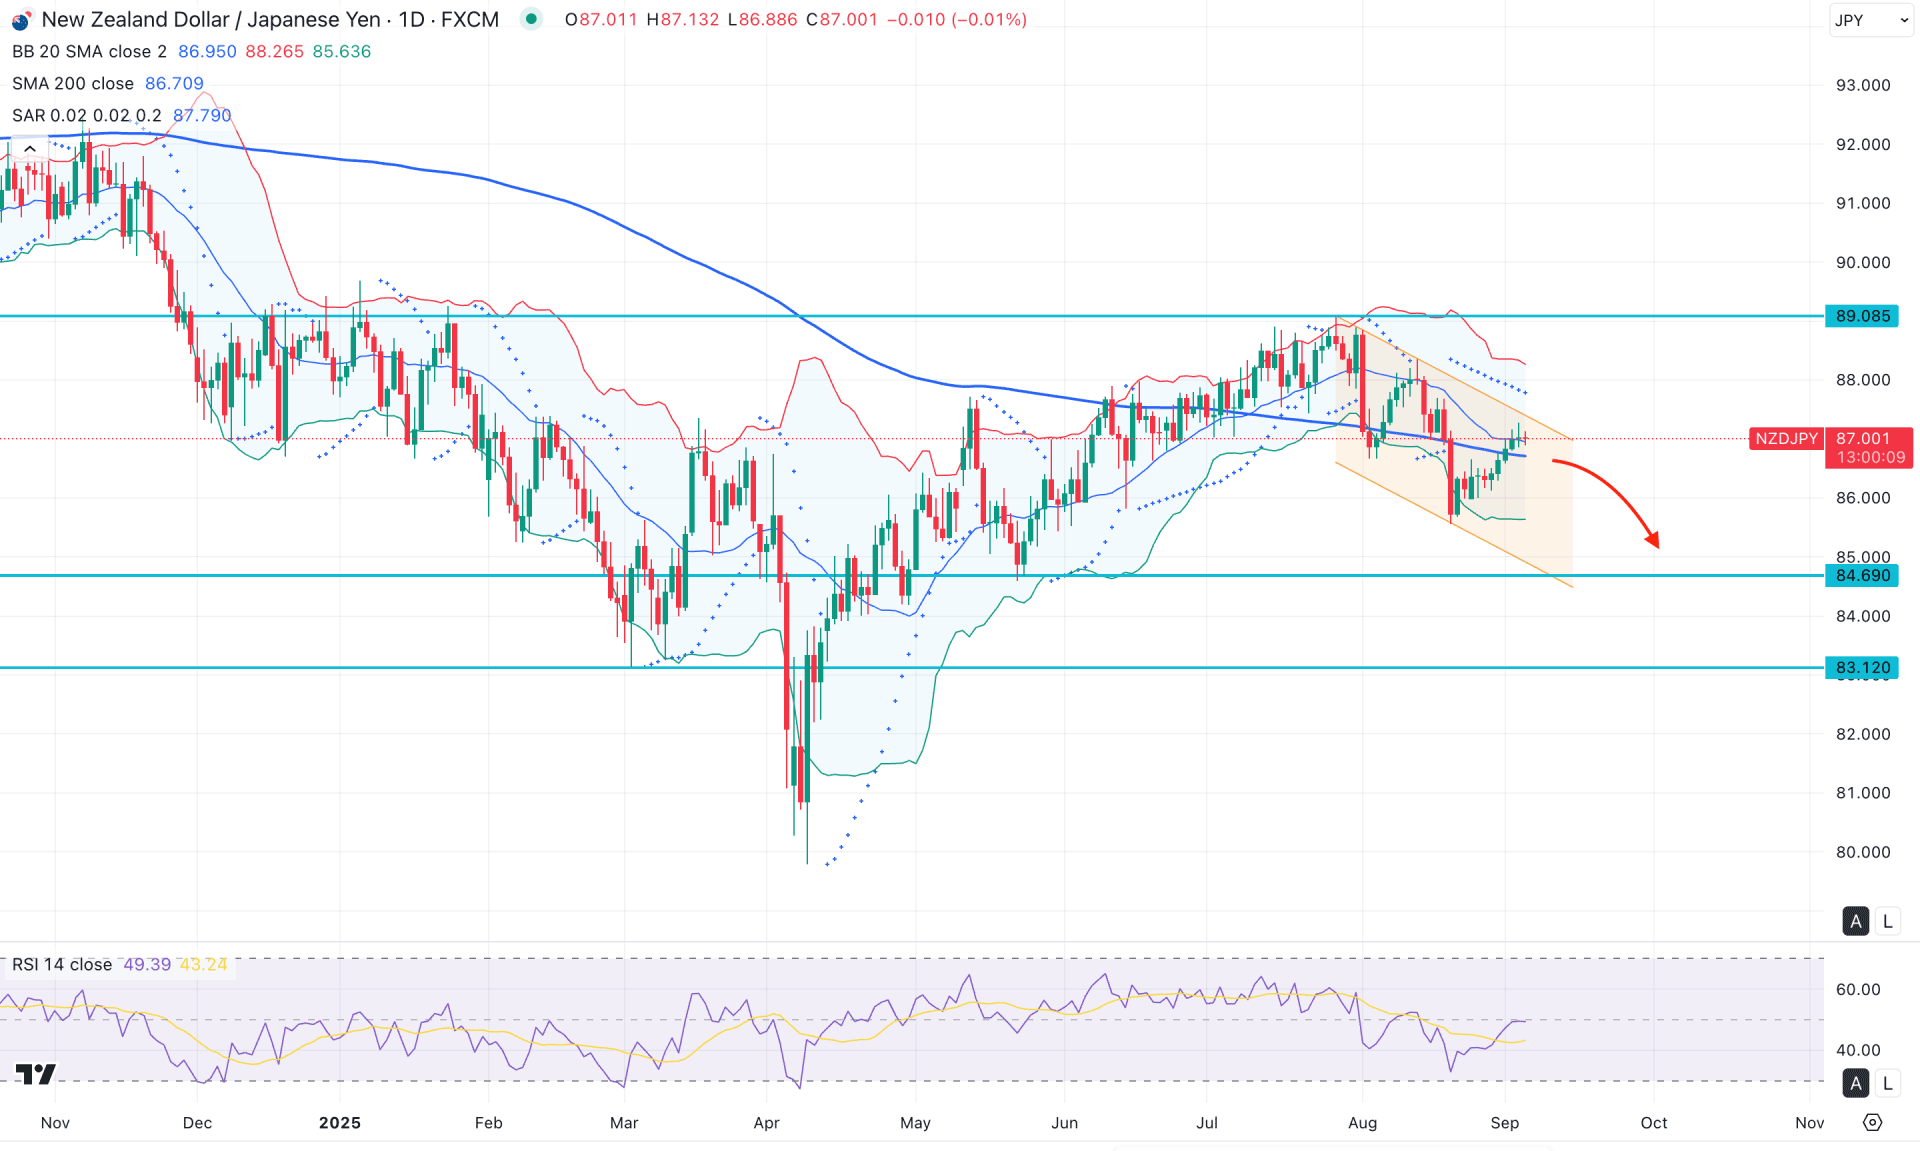
In the daily chart of NZD/JPY, a bullish recovery from April 2025 is still valid, as no significant drop has been seen from the 89.08 high. Instead of forming an immediate bearish reversal, the price moved sideways and is currently trading within a descending channel. In this case, a valid bullish breakout above the channel resistance could create a long opportunity.
Looking at the higher timeframe, the latest monthly candle is bearish, forming an engulfing bar from the July 2025 high. Since the price is still trading above the closing level, investors should monitor how the price behaves in the current area before anticipating future movement. On the weekly chart, the descending channel is clear, where further downside pressure could emerge before establishing a stable trend.
In the daily chart, corrective buying pressure is visible as the current price trades near the mid-Bollinger Band level with a gravestone doji formation. In this case, a clear breakout is needed. Bears currently have a higher probability of winning as the price is trading in the premium zone. The upper Bollinger Band is sloping downward, while Parabolic SAR signals minor selling pressure. However, multiple bullish daily candles remain above the 200-day simple moving average, suggesting more bullish attempts could appear before any bearish continuation.
In the secondary indicator, the Relative Strength Index (RSI) has rebounded from the lower area and flattened near the 50.00 line. As long as the RSI hovers around the midline, indecision may continue, and a breakout could provide a trading opportunity.
Based on the overall market structure, a bearish breakout with a daily close below the 200-day simple moving average could provide a high-probability short opportunity, targeting channel support. In that case, downside pressure may extend and push the price below the 85.00 area.
On the other hand, a bullish breakout with a stable close above the channel resistance could create an immediate long opportunity, targeting the 89.08 level. However, if the price falls below the 85.54 level, it could move towards the liquidity zone, where a stronger bullish reaction might offer another long opportunity targeting the 88.00 level.
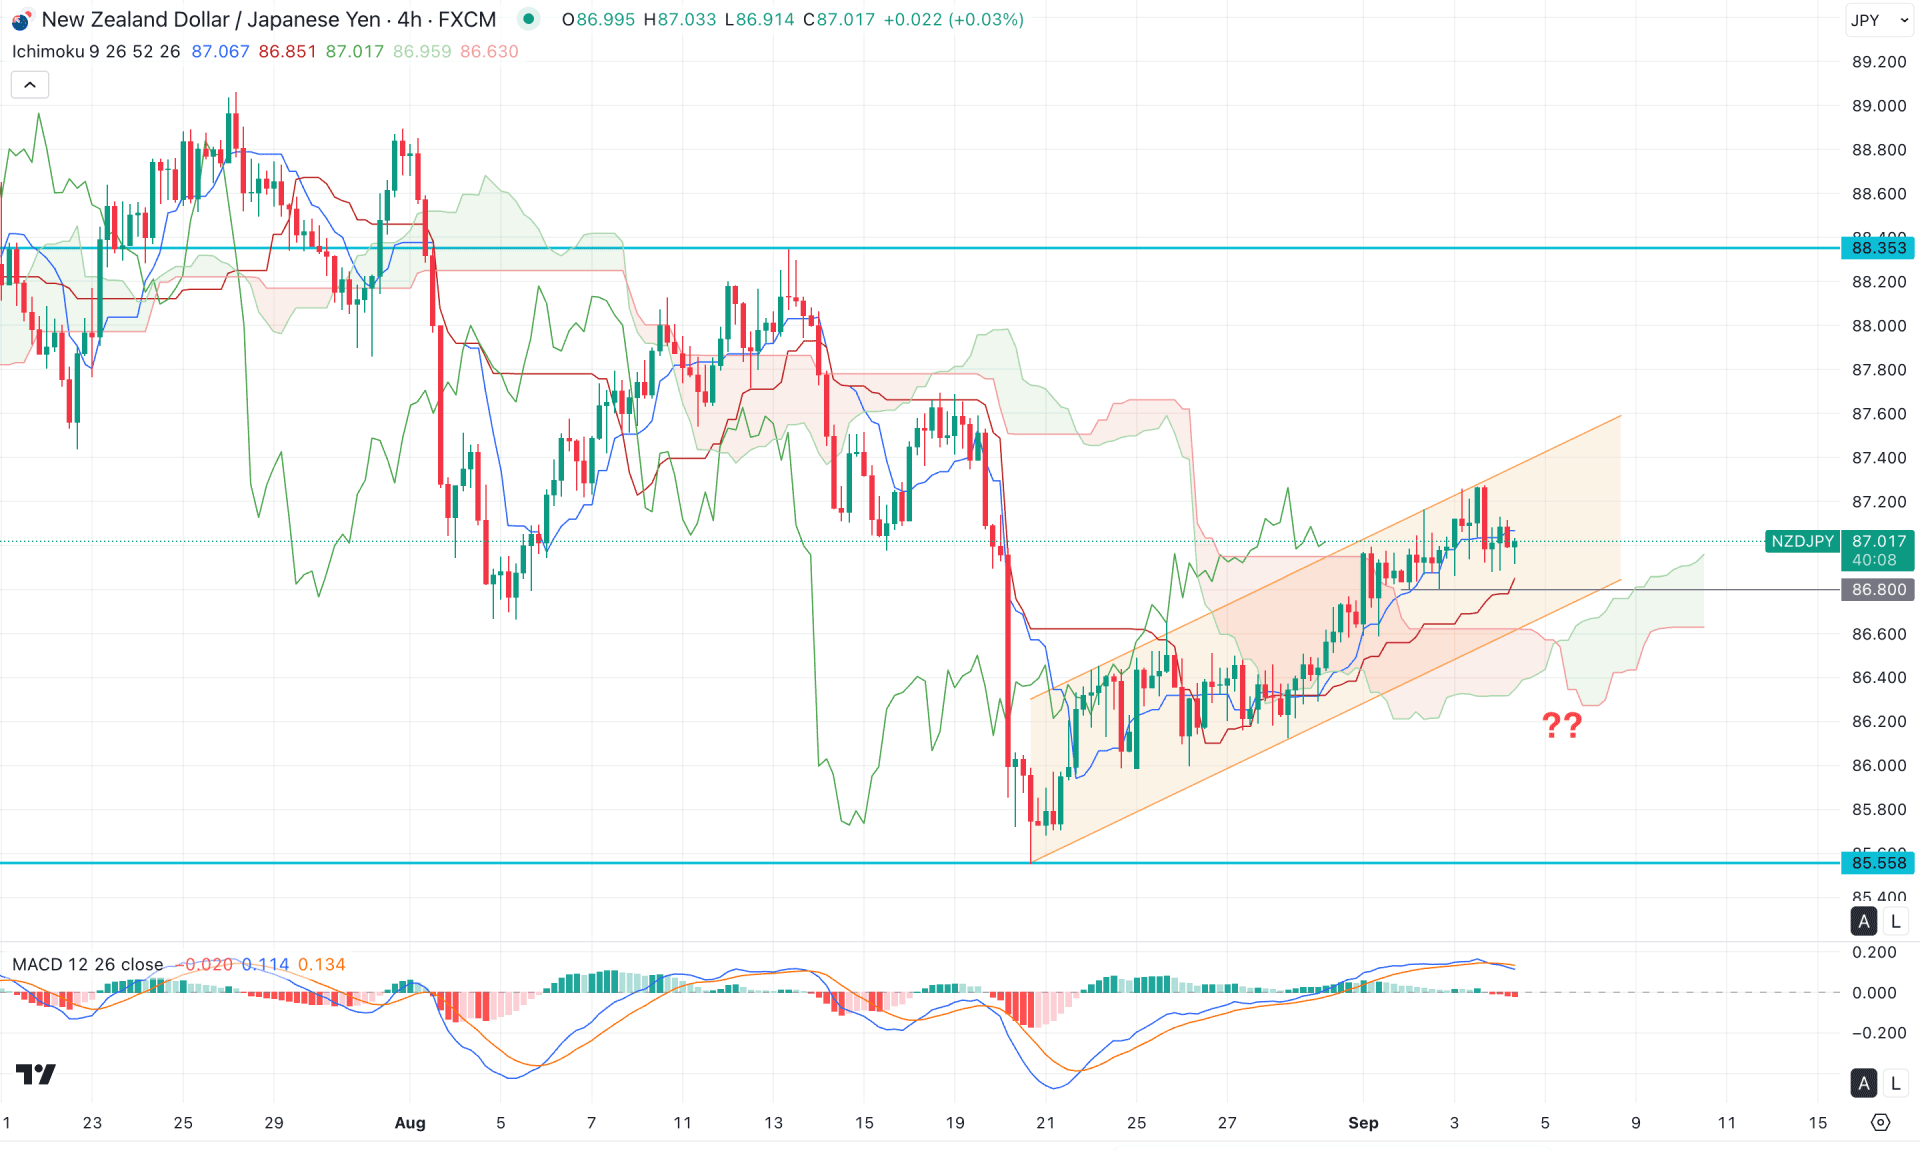
In the H4 timeframe, NZD/JPY is trading within an ascending channel, where the Ichimoku Cloud has flipped from bearish to bullish. Currently, the price is trading above the cloud support, suggesting that further upward pressure is possible.
On the other hand, the indicator window shows a different story, as the signal line has failed to sustain buying pressure in the positive area. Following the crossover in the signal line, the histogram dipped lower and printed multiple bearish bars.
Based on the current market structure, the price is trading within a corrective bullish trend, while ongoing bearish pressure remains evident. In this case, a failure to hold above the cloud, followed by a bearish channel breakout, could create a short opportunity targeting the 85.55 level.
However, since the recent price is still trading within the ascending channel, any bullish rebound from the near-term dynamic support line could extend the correction and push the price to a new high within the channel.
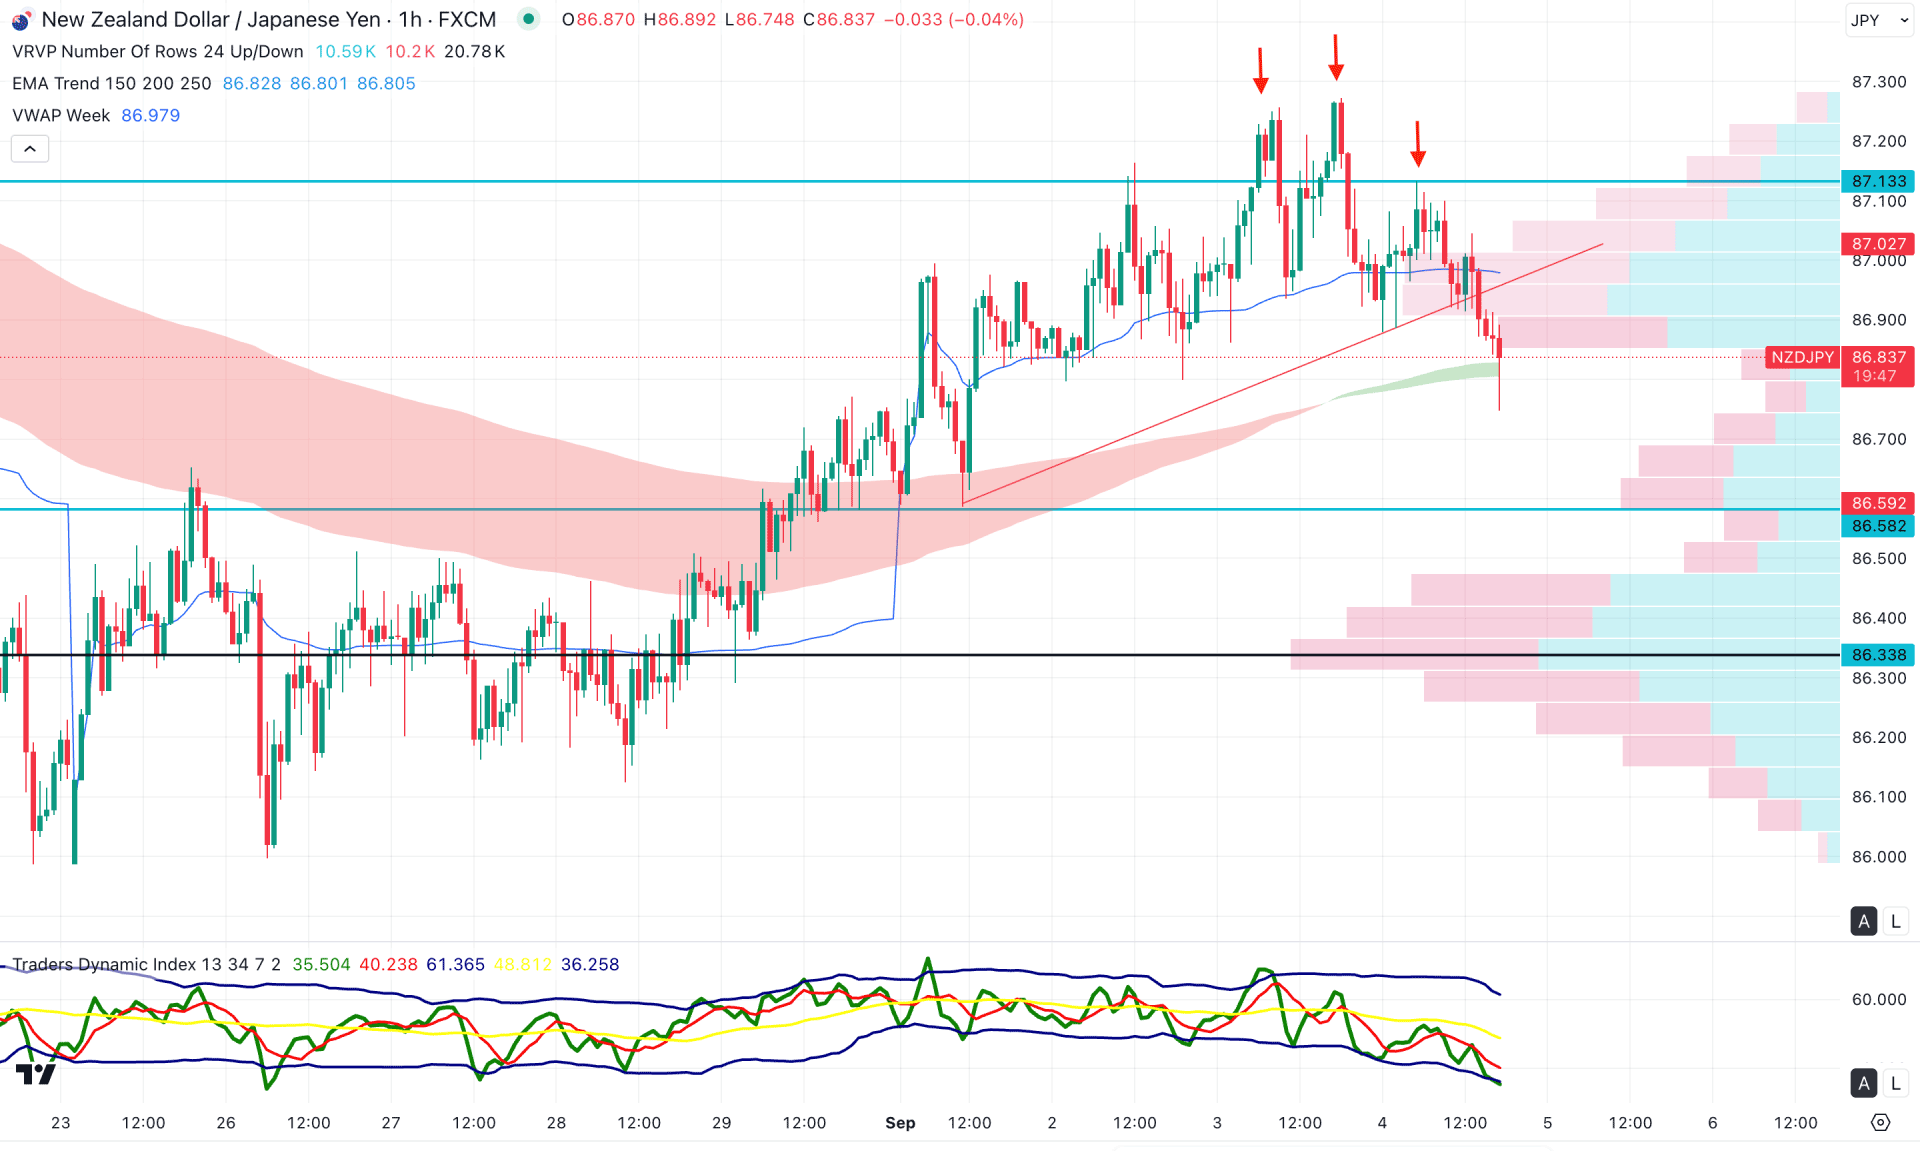
In the hourly timeframe, the NZDJPY price is trading under bearish pressure as the recent price has failed to hold the momentum above the 87.13 level.
As a result, a bearish trendline breakout is visible, followed by a valid reversal from the Head and Shoulders pattern.
The weekly VWAP line supported the downside pressure, while the price is still trading in line with the dynamic EMA wave area.
In the secondary indicator window, the Traders Dynamic Index (TDI) has reached the bottom, signalling an ongoing bearish pressure. Primarily, the downside momentum could extend as long as the TDI level remains below the 50.00 line.
Based on this outlook, an active downside pressure is visible, which might work as a daily channel extension after a bearish daily close.
The NZDJPY price is trading within an ascending channel, where the channel resistance is acting as a crucial barrier to bulls. The intraday price has shown an early bearish pressure, which could validate the short opportunity after having a solid bearish daily close.


