
Published: August 9th, 2022
The employment data for New Zealand showed that the second quarter started with a slowdown and a tight labor market. However, the employment change came flat in Q2, after a revised down result in Q1. The unemployment rate also ticked up to 3.3% from the first quarter’s 3.2%, while the participation rate reached 70.8%, up from 70.9% in the previous quarter.
On the other hand, the Japanese economy shows a decline in the manufacturing PMI reading, moving down to 52.1 from 52.2 in preliminary reports. Moreover, the detailed report shows a declining component with a backlog of orders. Furthermore, inventories show development while producers remain optimistic about the following year's economic outlook.
Like other JPY pairs, NZD showed a huge gain against the JPY, where the NZDJPY price is trading 12% higher from the yearly low. Moreover, the recent price action indicates that the price grabbed sell-side liquidity from the daily demand, increasing the bullish possibility above the trendline resistance.
Let’s see the upcoming price direction from the NZDJPY Technical analysis:
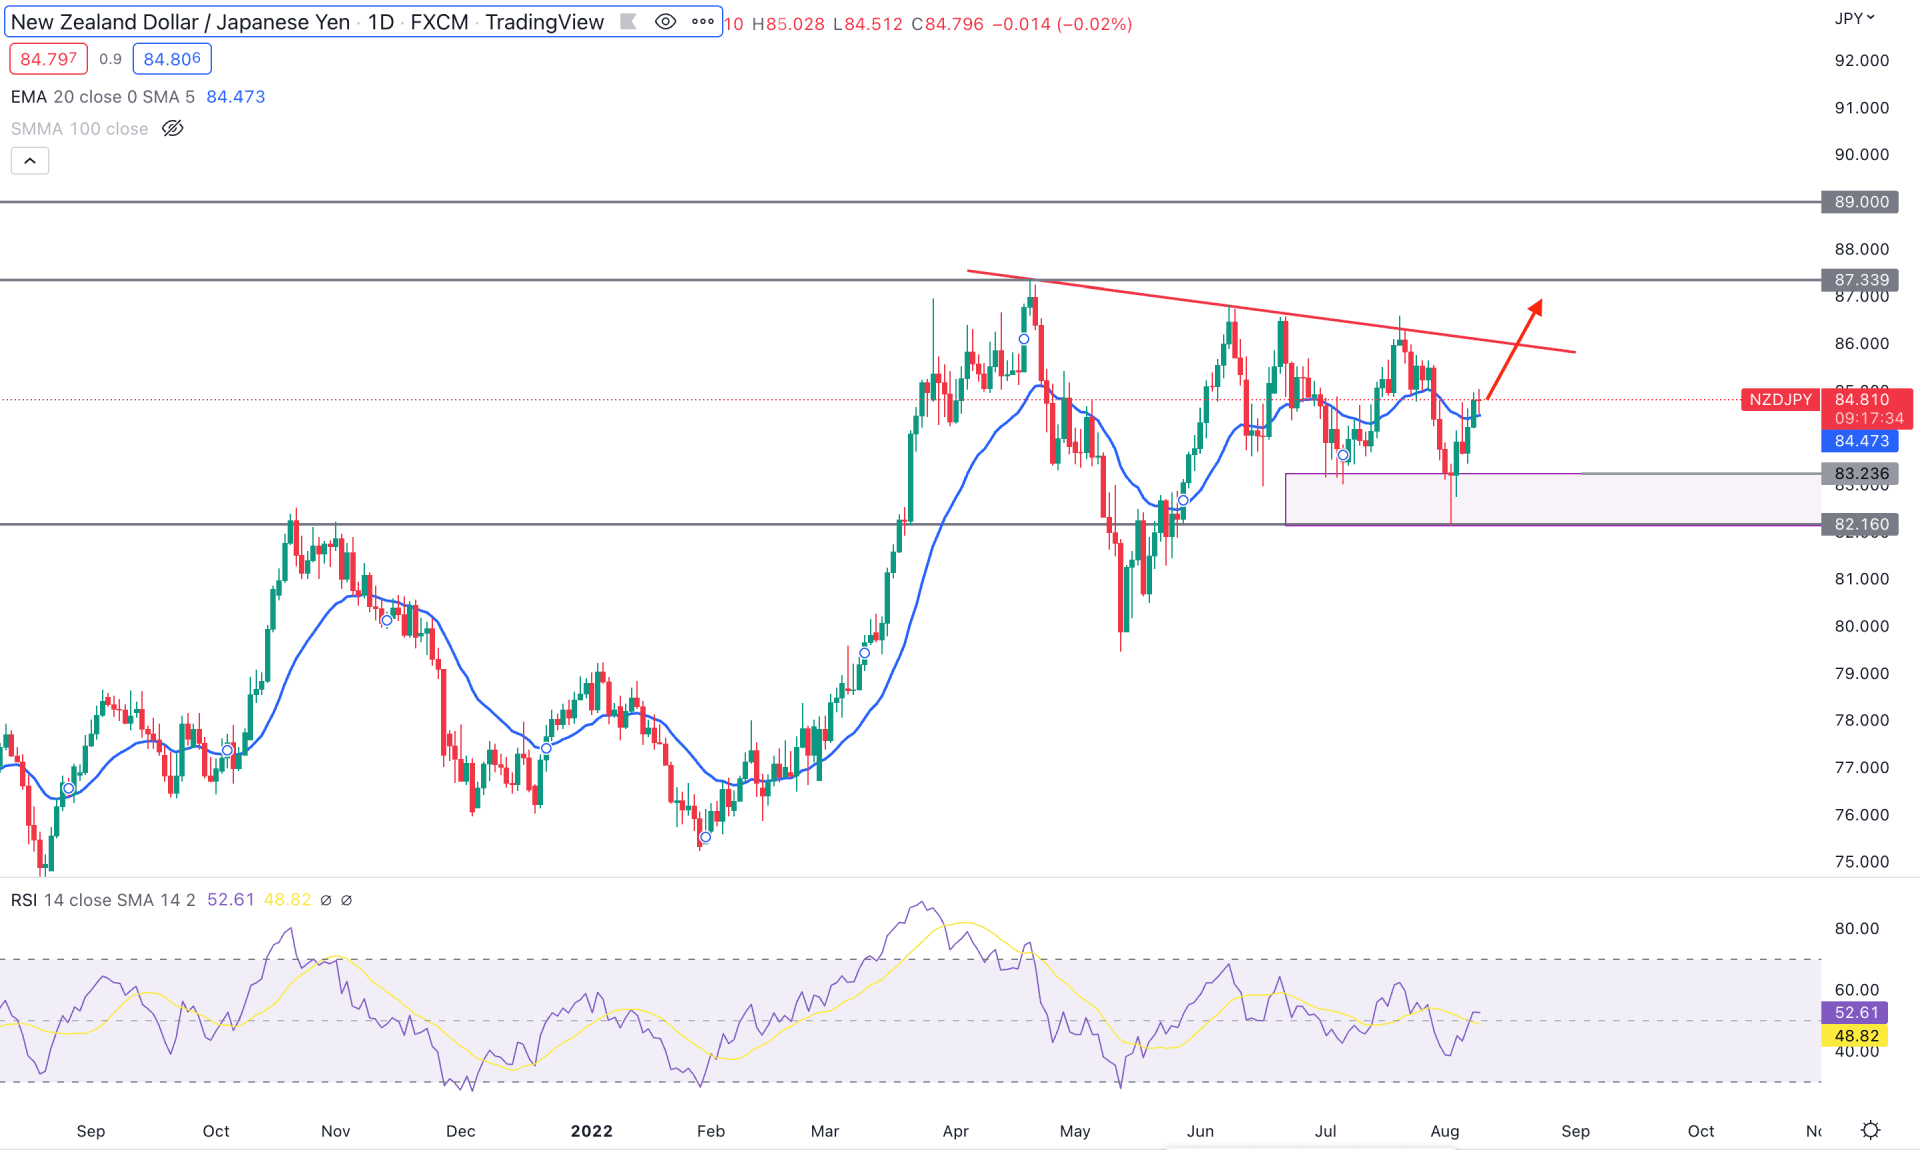
The bullish trend in the NZDJPY daily chart is clearly visible where the current price is trading above the dynamic 20-day Exponential Moving Average. Moreover, the buying pressure came after making a new swing low at 82.16, followed by strong buy-side pressure.
The impulsive bullish pressure in NZDJPY faded as the price reached the 87.33 key resistance level, from where a 50% recovery was seen in the 2022 bull run. However, the price shot higher instead of making new lows and became corrective.
The most recent buying pressure came from big exhaustion at the 82.16 support level, which may extend the momentum above the trendline resistance. The indicator window also shows the same story, where the current Relative Strength Index (RSI) level is above the 50% zone, which may move higher towards the overbought 70 level.
Based on the daily price structure, bulls have a higher possibility of taking the price higher above the trendline resistance, where the primary target is to test the 87.33 resistance level. On the other hand, any selling pressure towards the 82.23 to 82.16 zone could provide another buying opportunity, considering the 81.80 level as an invalidation point.
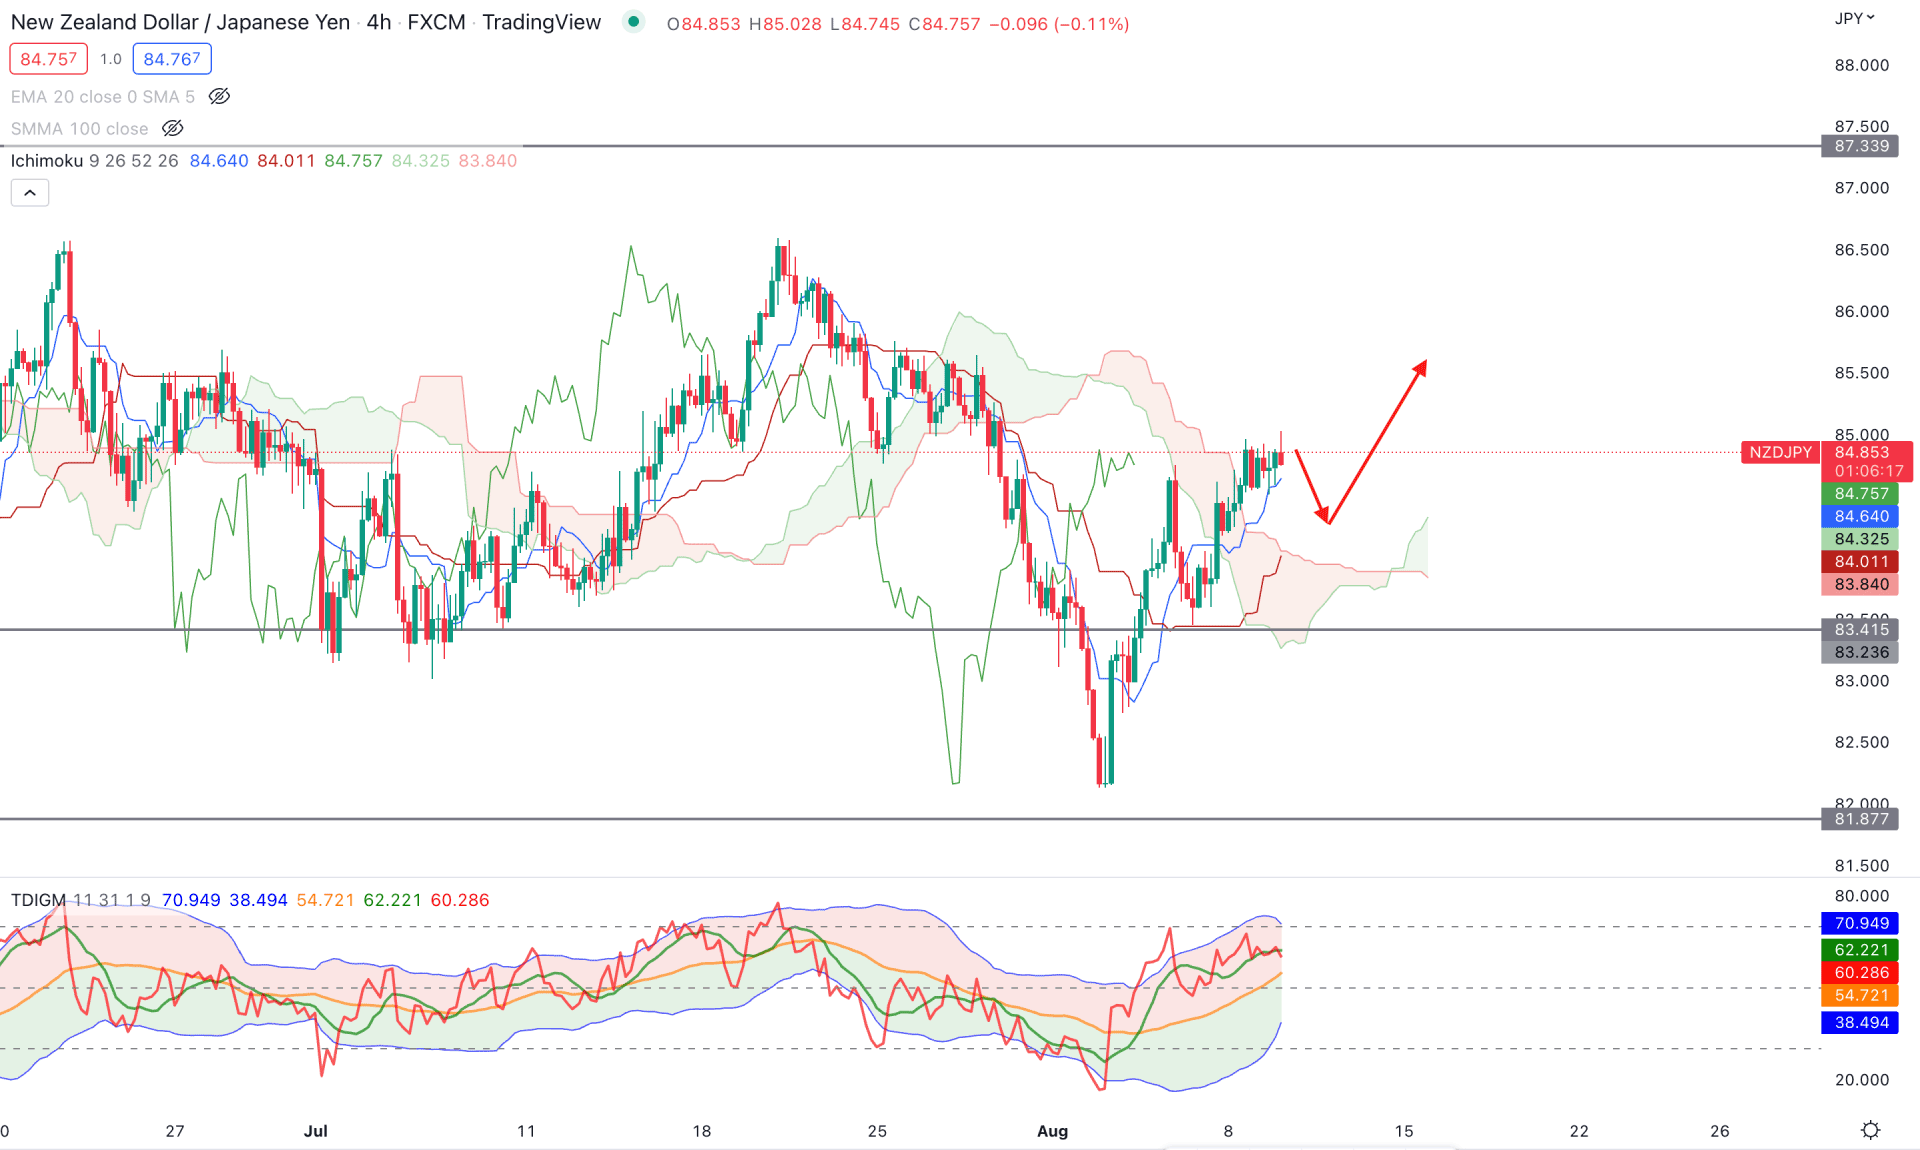
In the H4 chart, the Ichimoku Cloud shows a corrective price action where the current price trades above the cloud resistance with a corrective momentum. On the other hand, the future cloud provided a buy signal where the Senkou Span A shot higher, above the Senkou Span B.
The indicator window also shows a strong buyer position in the market where the TDI line is above the 50% level. The Dynamic Tenkan Sen and Kijun Sen are below the current price and working as minor supports.
Based on the current price behavior, the H4 buying pressure may resume after a bearish correction towards the dynamic Kijun Sen level. In that case, investors should monitor the price action at the 84.20 to 83.10 zone, from where any bullish rejection could open a bullish opportunity. On the other hand, breaking below the 83.00 level with a bearish daily close could alter the current market structure and lower the price to 81.87.
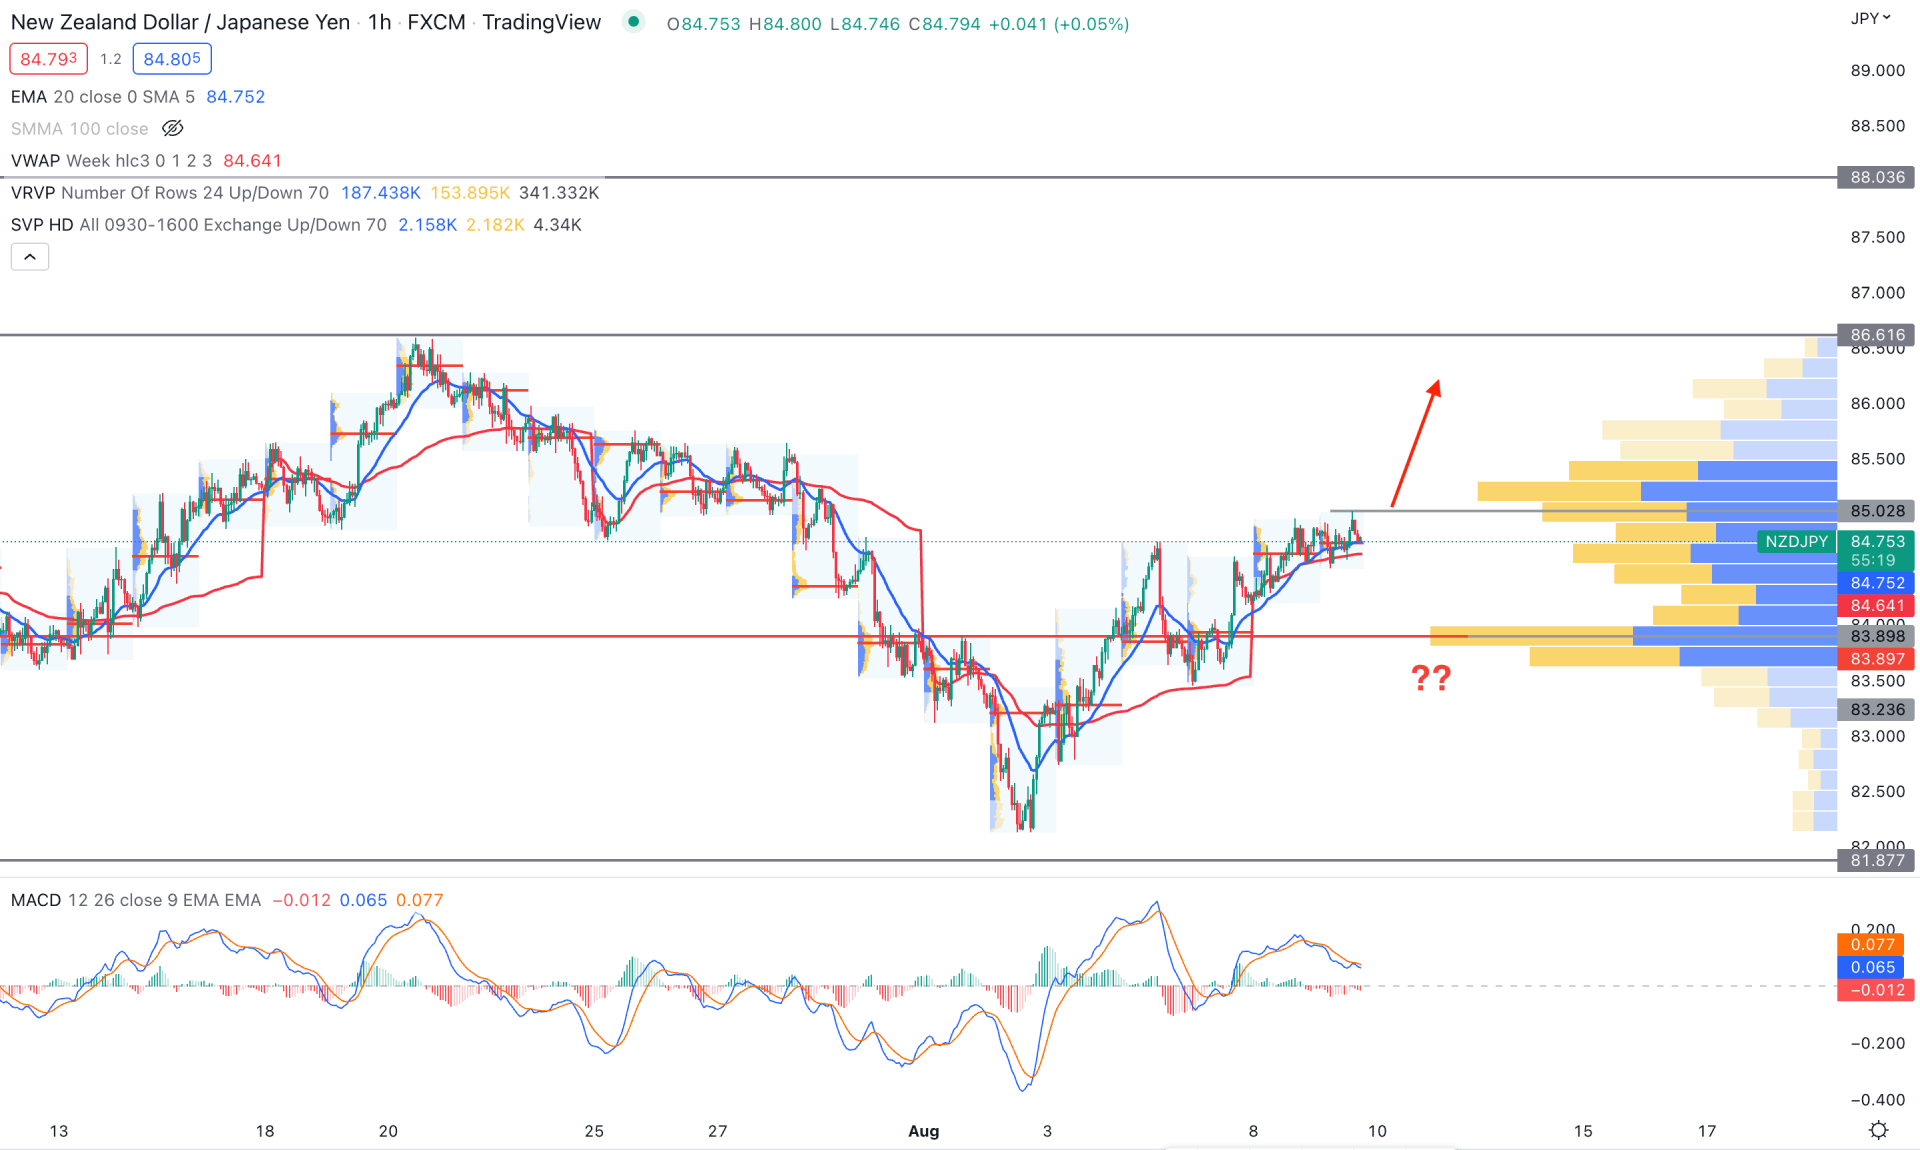
The intraday H1 chart of NZDJPY showed a corrective price action where the current price trades above the dynamic 20 EMA and weekly VWAP.
Based on the visible range volume, the buying pressure is supportive as it trades above the 83.89 high volume level. Moreover, the intraday volume levels are supportive to bulls, where the latest intraday high volume level is at 84.71. The MACD histogram is bearish, while EMA lines are above the neutral point. In that case, any rebound in the Histogram could make a bullish crossover in MACD EMA’s, pushing the price higher.
Based on the H1 price action, any strong bullish H1 candle above 85.00 swing high could resume the current bullish trend towards the 86.61 level. Another buying opportunity might be from the 83.89 to 84.20 zone with a proper bullish candlestick formation. Breaking below the 83.80 level with a bearish H1 close could alter the current market structure by extending the selling pressure to the 81.87 level.
Based on the current multi-timeframe analysis, NZDJPY is more likely to move up in the coming days. However, investors should monitor the intraday price action, particularly the H4 Kijun Sen zone, to find an affordable buying signal.


