Published: September 19th, 2024
According to data published by Statistics New Zealand on Thursday, the nation's GDP shrank 0.2% quarter over quarter (QoQ) in the second quarter (Q2) as opposed to growing by 0.1% in the first. This reading exceeded the 0.4% contraction prediction. According to estimates, the yearly increase in GDP in the second quarter was 0.5%, down from the 0.5% improvement in the first quarter.
The better-than-expected GDP figure did not help the Kiwi as traders continued to evaluate the Federal Reserve's (Fed) massive interest rate cut during a very erratic Wednesday session. Financial markets are currently pricing in over 50% of the Reserve Bank of New Zealand (RBNZ), cutting interest rates by 50 basis points as early as October.
Although there is growing conjecture that the Swiss National Bank (SNB) will prolong the policy-making process in September's fiscal policy, the Swiss Franc (CHF) continues to perform strongly versus the US Dollar. Given the sharp decline in Swiss inflation, the SNB is anticipated to announce its third consecutive interest rate cut. August saw a decline in the yearly Swiss Consumer Price Index (CPI) to 1.1%, the lowest since March of this year.
Let's see the further aspect of the NZDCHF pair from the following technical analysis:

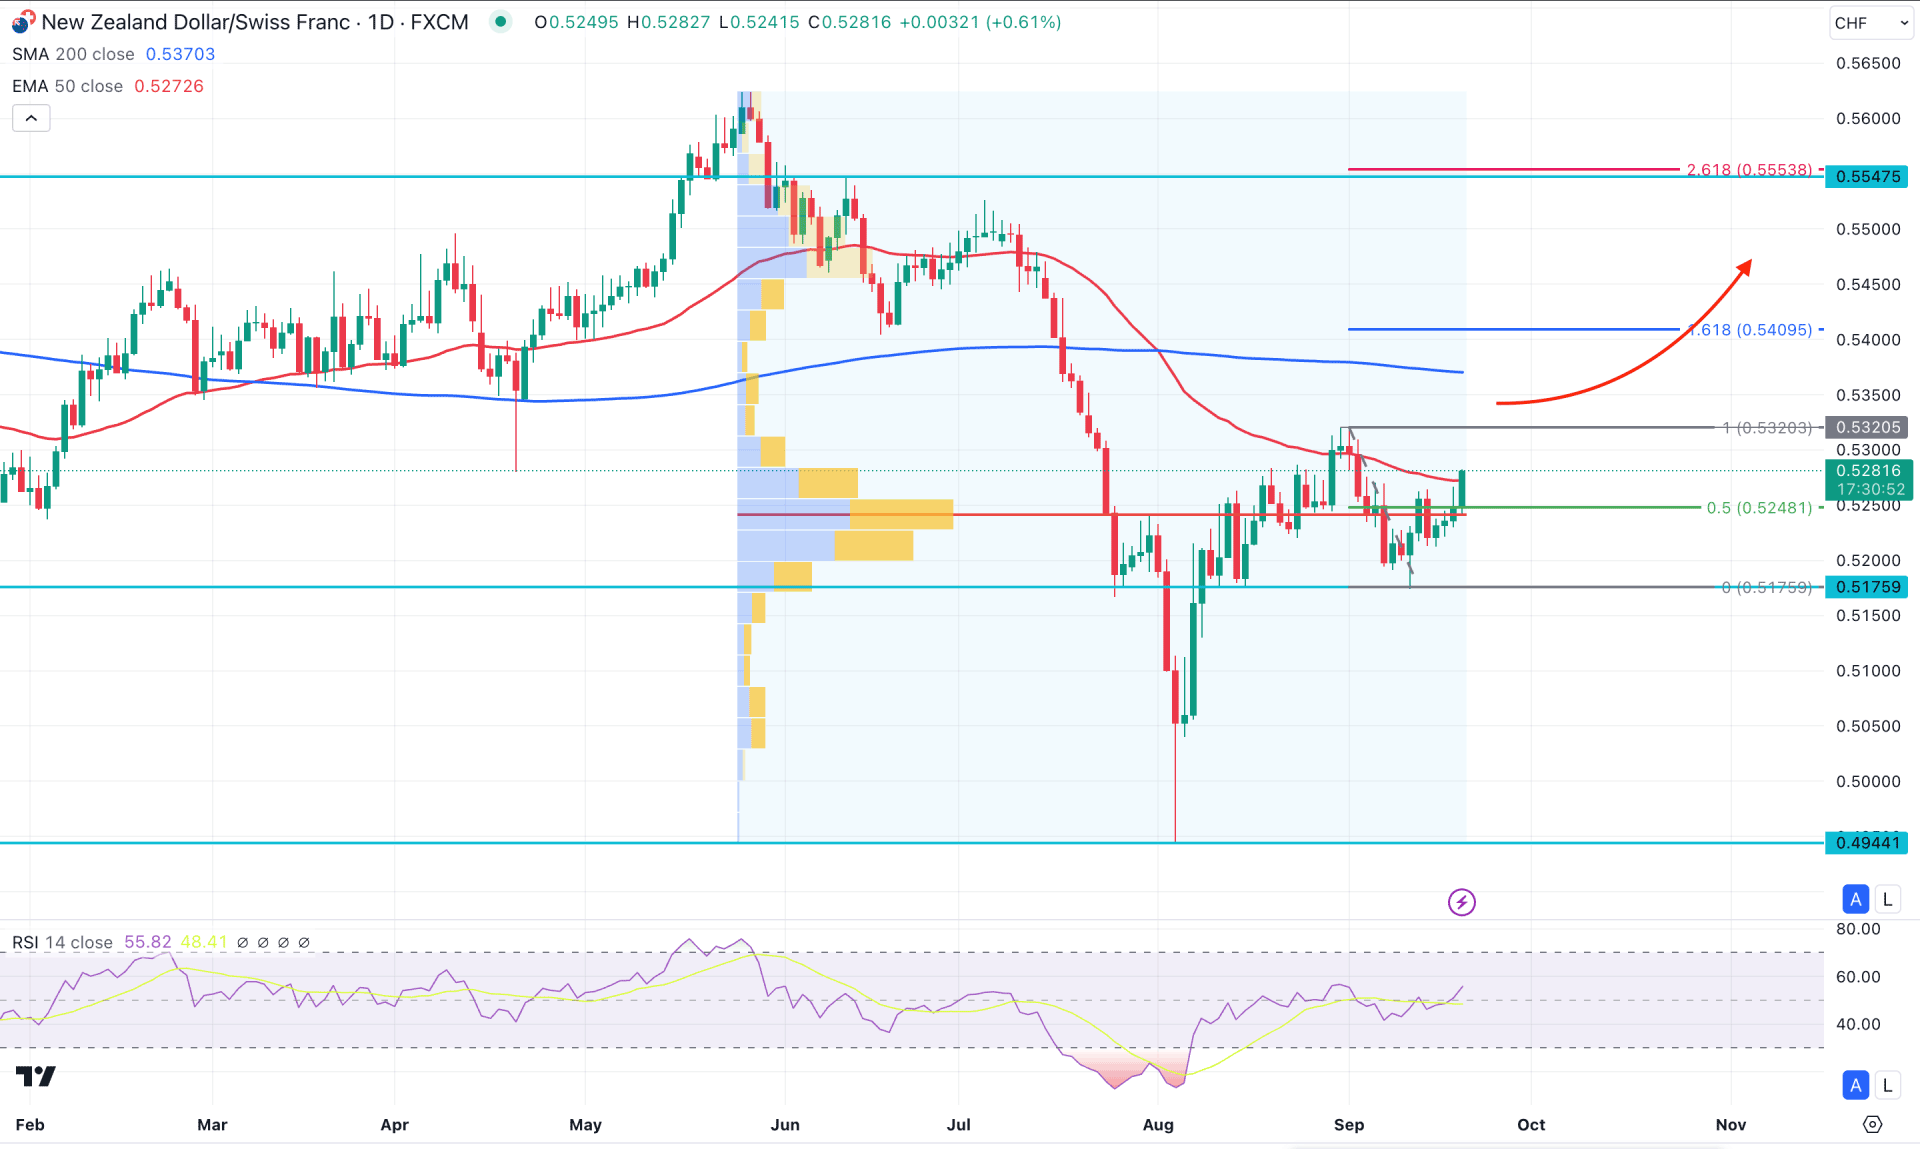
In the daily chart of NZDCHF, the recent price showed strong bearish exhaustion in August 2024, suggesting an overextended selling pressure. Later on, the price rebounded immediately with a bullish V-shape recovery, suggesting a market reversal.
In the recent time, the price remained sideways and found support at the 0.5175 static level. Therefore, the primary outlook of this instrument is bullish as long as the static level is protected. In the higher timeframe, the monthly candlestick in August closed as a bullish hammer, where a bullish price action above the August 2024 high could be a high probable long signal.
Looking at the volume structure, the largest volume was found at the 0.5241 level, which is below the current price. This is a sign that institutional investors are involved in this pair. However, the daily price is still unstable from the buyer's perspective, as the dynamic 200-day Simple Moving Average and 50-day Exponential Moving Average are above the current price.
In the secondary indicator window, the 14-day Relative Strength Index (RSI) rebounded from the oversold 30.00 level and moved above the 50.00 neutral point. As long as the RSI remains above 50.00, the long-term market outlook is bullish.
Based on the daily market outlook of NZDCHF, the current buying possibility is solid, where a bullish daily candle above the 0.5320 high could be a conservative bullish approach. In that case, the bullish continuation could extend and find resistance from the 0.5490 Fibonacci Extension level. Moreover, a stable buying pressure above the 0.5320 level might extend the upward pressure at the 0.5547 static resistance level.
On the bearish side, investors should monitor how the price reacts on the 50 day Exponential Moving Average as a valid bearish pressure below this line could resume the existing trend. In that case, a bearish daily close below the 0.5248 level could lower the price toward the 0.5100 psychological level.

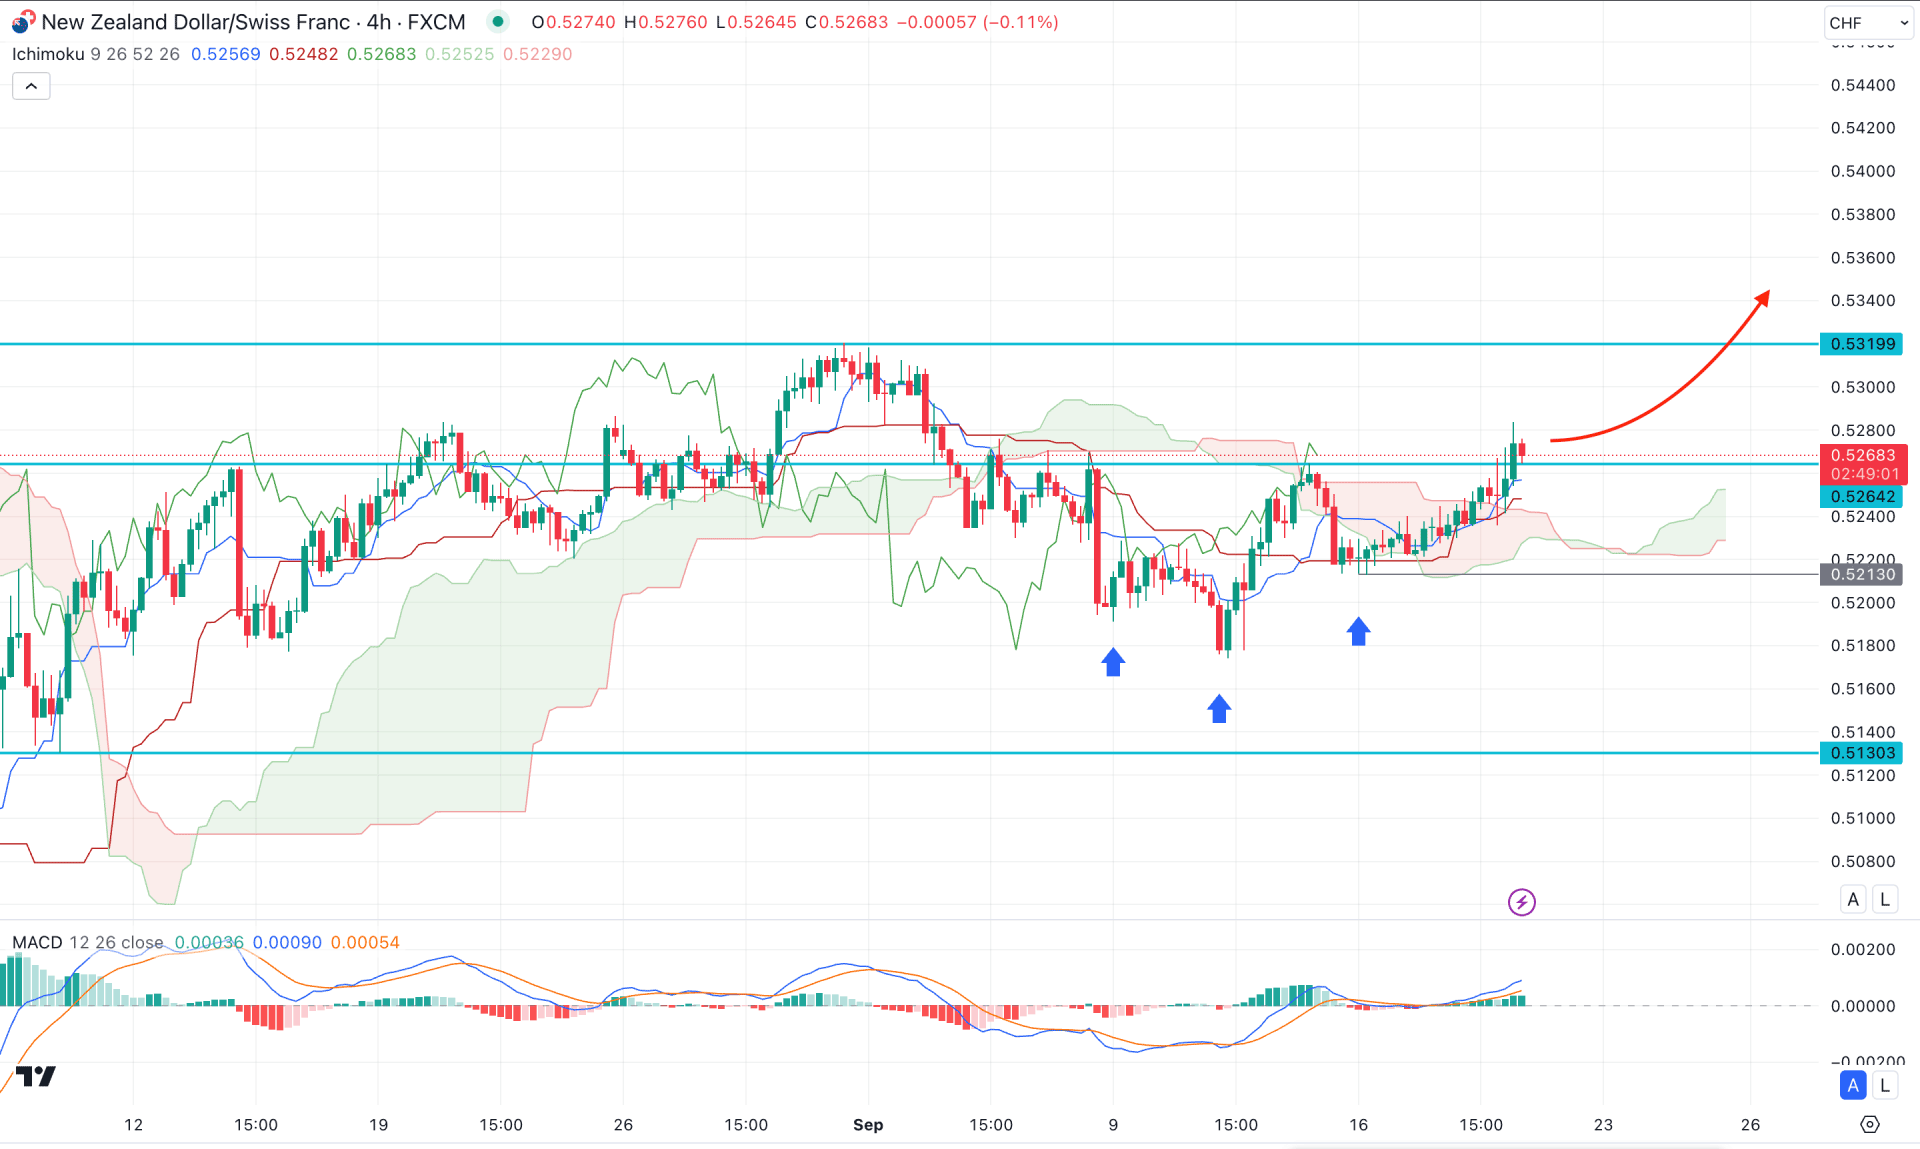
In the H4 timeframe, the NZDCHF is trading under bullish pressure, with the current price hovering above the Ichimoku Kumo Cloud. Moreover, the Futures Cloud remains bullish, with the Senkou Span A and B aiming higher with upward continuation momentum.
In the indicator window, the MACD Histogram remained steady, while the signal line is above the neutral point,
Based on the Ichimoku outlook, the recent price trades at the Inverse Head and Shoulders neckline, from where a valid bullish breakout might activate the long-term bull run. Primarily, the 0.5319 level would be a crucial resistance to look at. Moreover, a break above this line might extend the current momentum and reach the 0.5400 level soon.
On the bearish side, any immediate selling pressure with an H4 candle below the 0.5213 level could be a bearish continuation signal, aiming for the 0.5130 level.

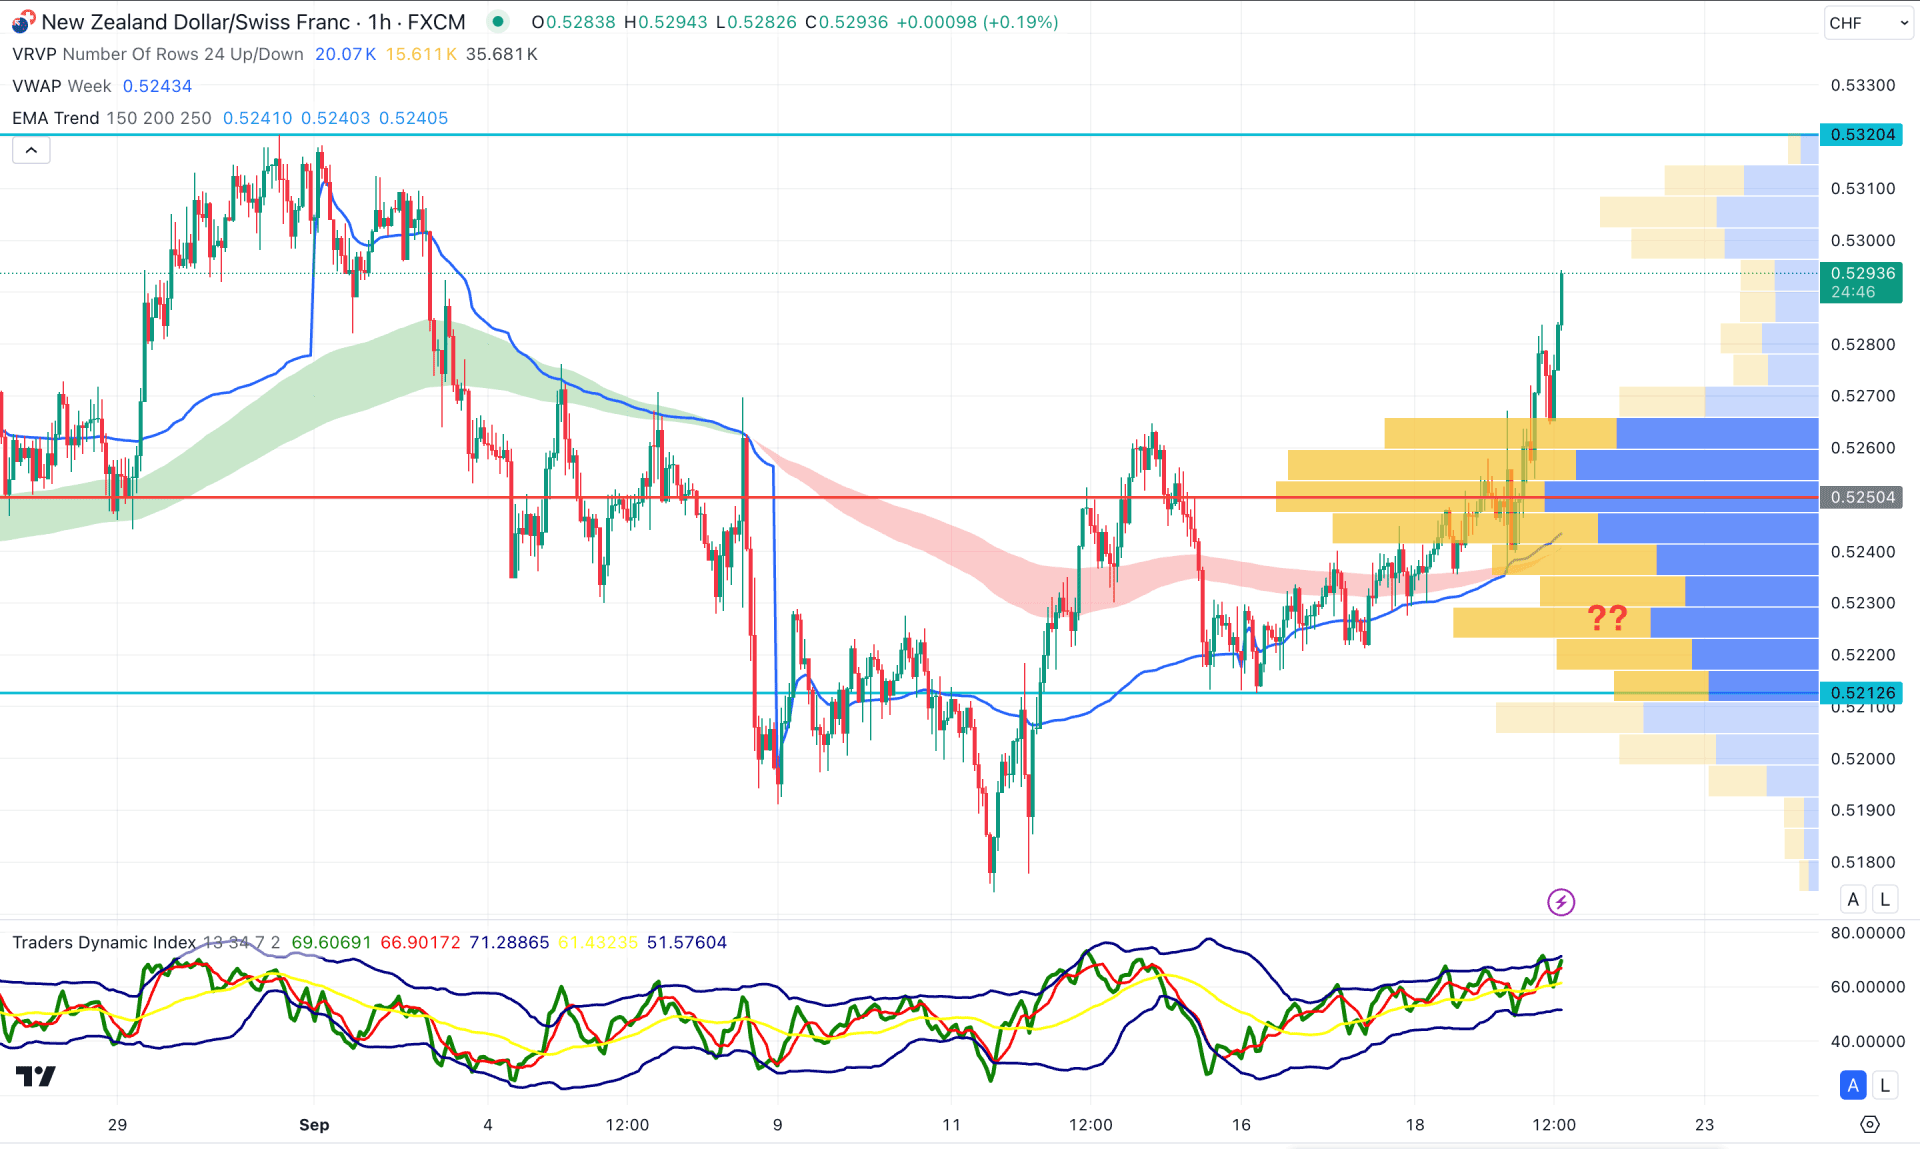
In the hourly time frame, NZDCHF is trading within an extreme intraday bullish pressure as the current visible range high volume line is below the current price. Moreover, the MA wave and weekly VWAP levels are below the current price and are working as a bullish slope.
In the secondary indicator window, the current TDI level is overbought, suggesting an active buying pressure.
Based on the hourly price structure, the buying pressure needs a sufficient downside correction before offering a continuation signal. The primary aim for this pair is to find a valid bullish reversal from the MA wave zone, before aiming for the 0.5330 level.
Based on the current market outlook, NZDCHF is more likely to extend the buying pressure as the recent price showed strong exhaustion at the bottom. As the near-term resistance is approaching, a valid breakout could be a highly probable long opportunity.