
Published: November 30th, 2023
Despite market predictions, the Reserve Bank of New Zealand (RBNZ) kept its cash rate at 5.5%. The consensus expected a status quo, but the RBNZ stressed that "inflation remains too high." This unexpected position caused the New Zealand currency to soar rapidly, surprising traders.
Among economic releases, the 1-year Overnight Index Swap (OIS) fell from 5.85% to 5.5% in recent weeks, indicating a peak rate. Although noted for its clear monetary policy communication, the RBNZ acted decisively and resisted political pressures. If economic data improves before the February meeting, rate hike expectations may climb, supporting the New Zealand dollar.
In the Swiss economy, the retail sector, excluding service stations, saw a 1.5% nominal turnover increase in October 2023 compared to October 2022, with a 0.2% actual growth. Food, alcohol, and tobacco sales increased 1.9%, while non-food sales increased 1.2% and 0.9%. Retail sales rose 0.4% seasonally adjusted nominally and 0.4% really from the previous month, excluding service stations.
A more precious view of CHF might come after Friday’s GDP release, which is expected to increase from 0.0% to 0.1%.
Let’s see the future outlook of this currency pair from the NZDCHF technical analysis:
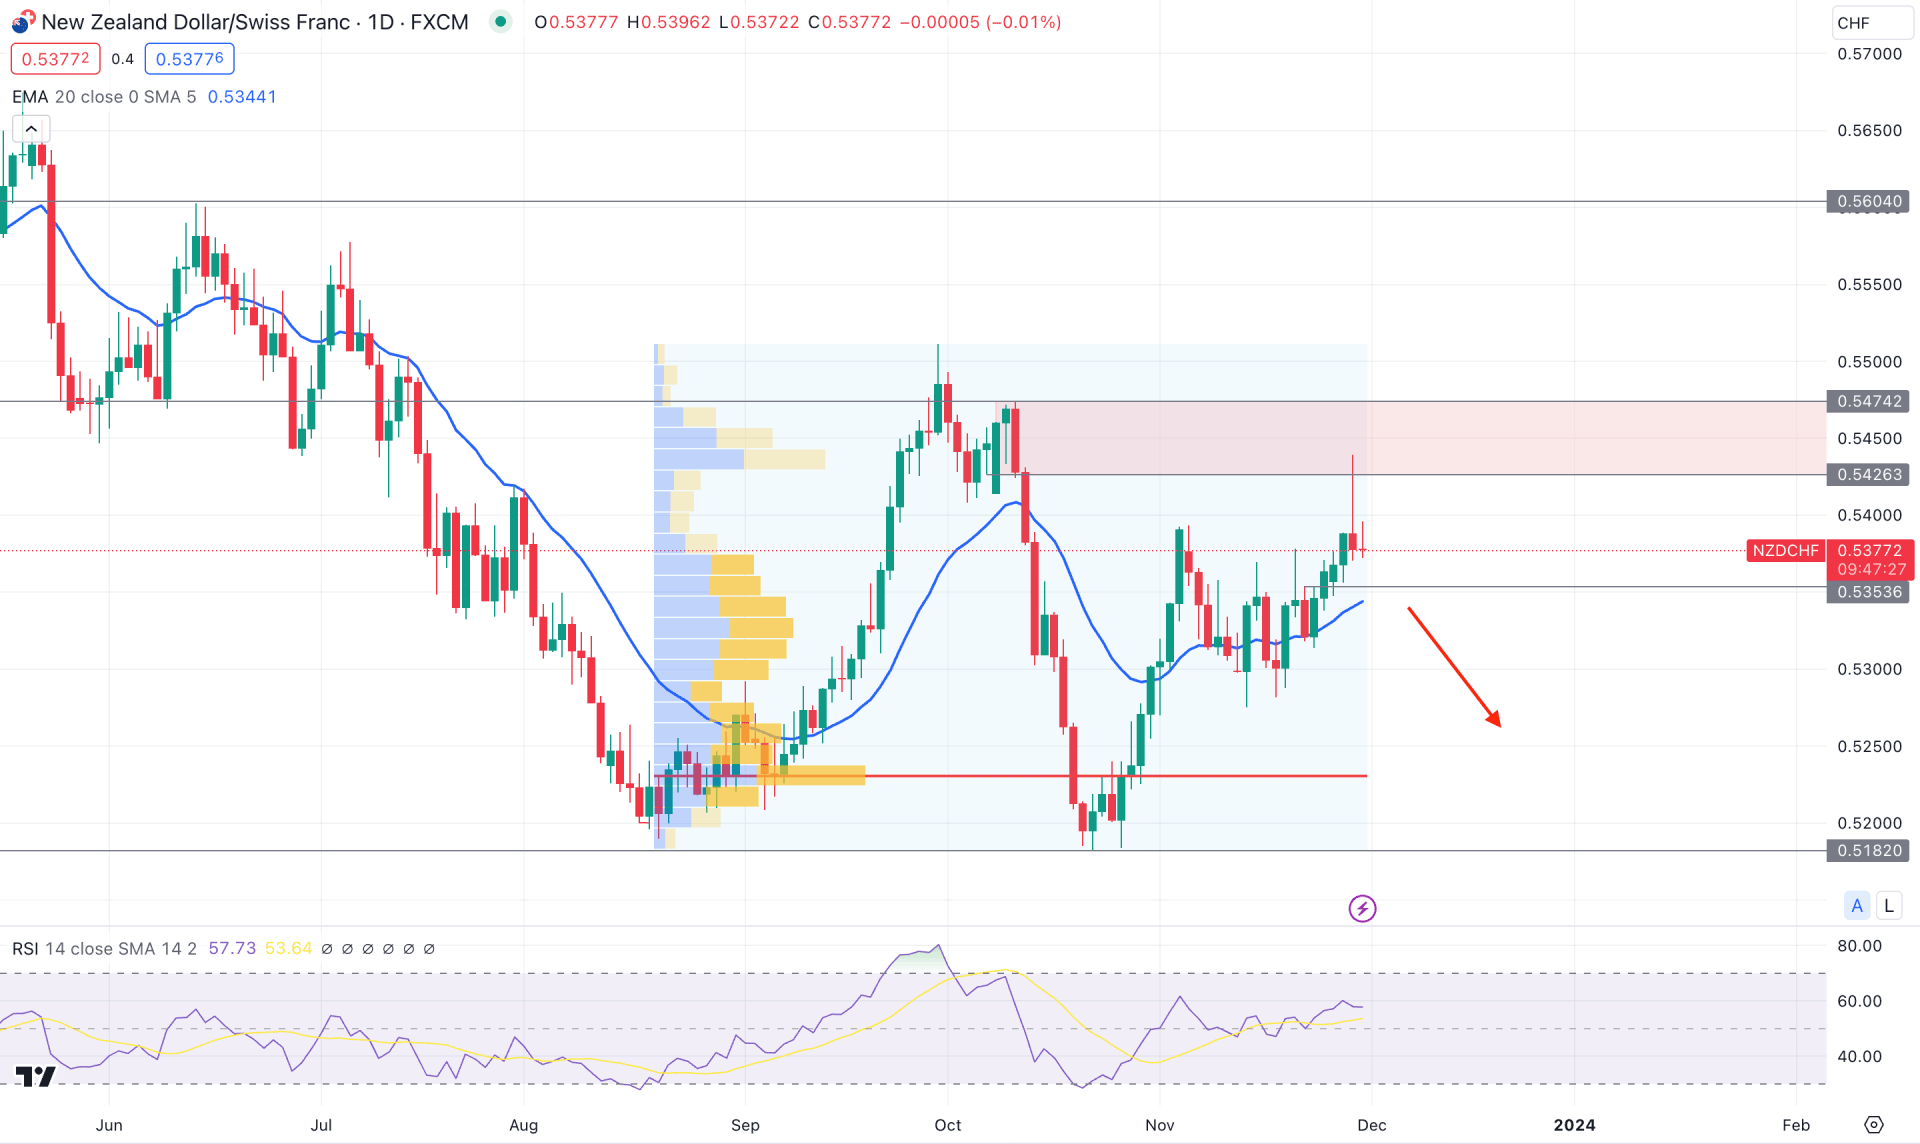
In the daily chart of NZDCHF, the overall market momentum is bearish, where the recent price shows a short-term buying pressure above the dynamic 20 EMA. Following the long-term trend, investors might find a decent short opportunity in this pair after forming a reliable buy-side liquidity sweep.
The monthly candle remains within the previous bearish body in the higher timeframe, suggesting sellers' presence in the market. Moreover, the weekly price suggests an early bullish reversal possibility with a U-shape recovery. Moreover, the 20-week EMA is below the current price with an upward slope, indicating a market buying pressure.
In the volume profile, the most active level since August 2023 is at the bottom, which suggests an existing bullish accumulation in the market. As the current price trades above the 0.5230 high volume level, we may expect bulls to continue taking the price higher.
In the daily chart, the current price trades higher above the dynamic 20 EMA, while the 14-day Relative Strength Index (RSI) remains above the 50.00 neutral line.
Based on the daily market outlook of NZDCHF, an immediate bullish pressure with a daily candle above the 0.5474 resistance level could be the first long signal for this pair. However, a downside correction is possible, where an additional buying pressure from the 0.5353 level could be another long opportunity with a discounted price.
On the bearish side, investors need selling pressure with a D1 candle below the 0.5320 level, which could activate the long-term bearish trend. In that case, the downside pressure might extend the momentum toward the 0.5182 static support level.
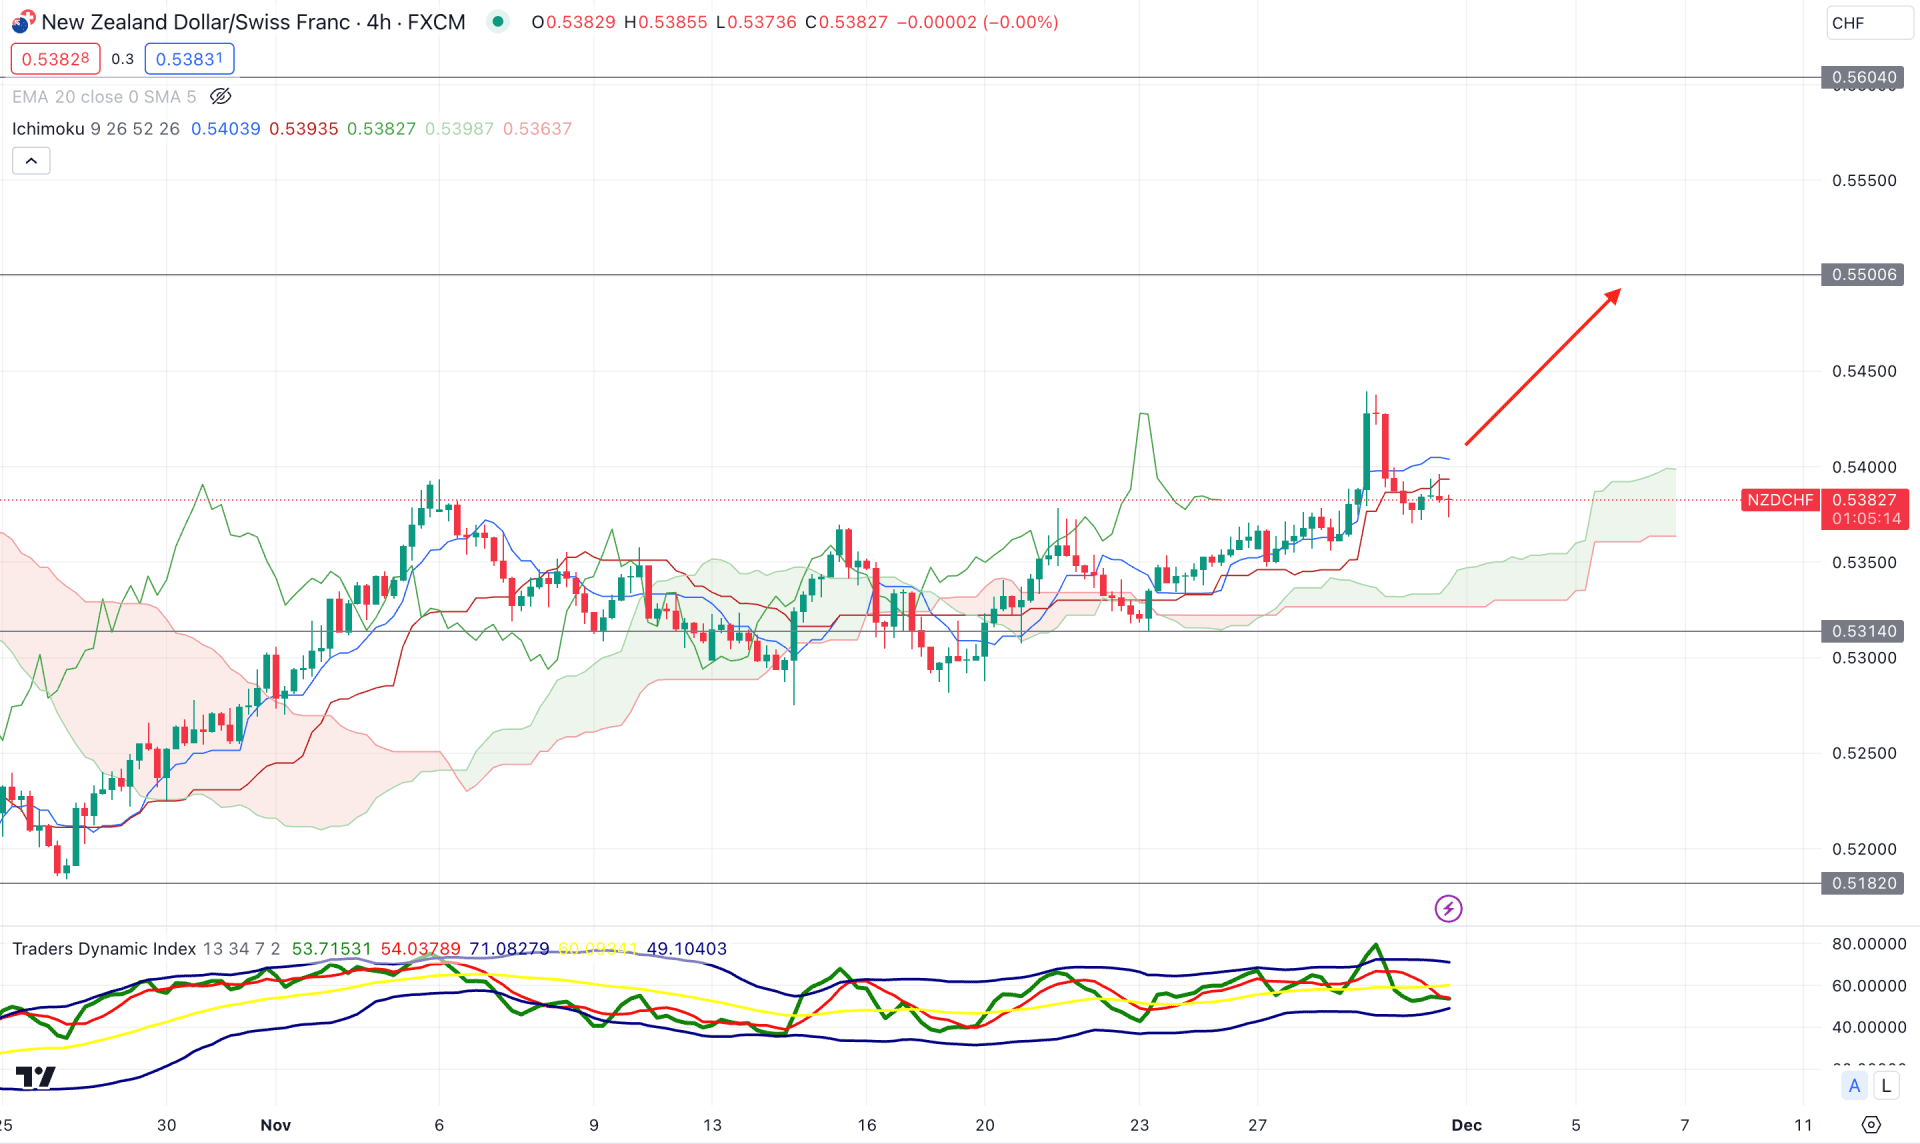
In the H4 chart, the current market momentum is bullish as the recent price trades above the Cloud support for a considerable time. Moreover, the future cloud is bullish as the Senkou Span A aimed higher, above the Senkou Span B.
In the secondary window, the current reading suggests a corrective pressure as the TDI level is sidelined at the 50.00 line. Moreover, downside pressure is visible from the bearish H4 candle below the dynamic Kijun Sen level.
Based on this outlook, a bullish rebound with an H4 close above the dynamic Kijun Sen could be a bullish trend continuation opportunity, targeting the 0.5500 level.
However, the long-term bearish trend might offer a trend continuation opportunity, which might come with a valid downside pressure below the dynamic Cloud support.
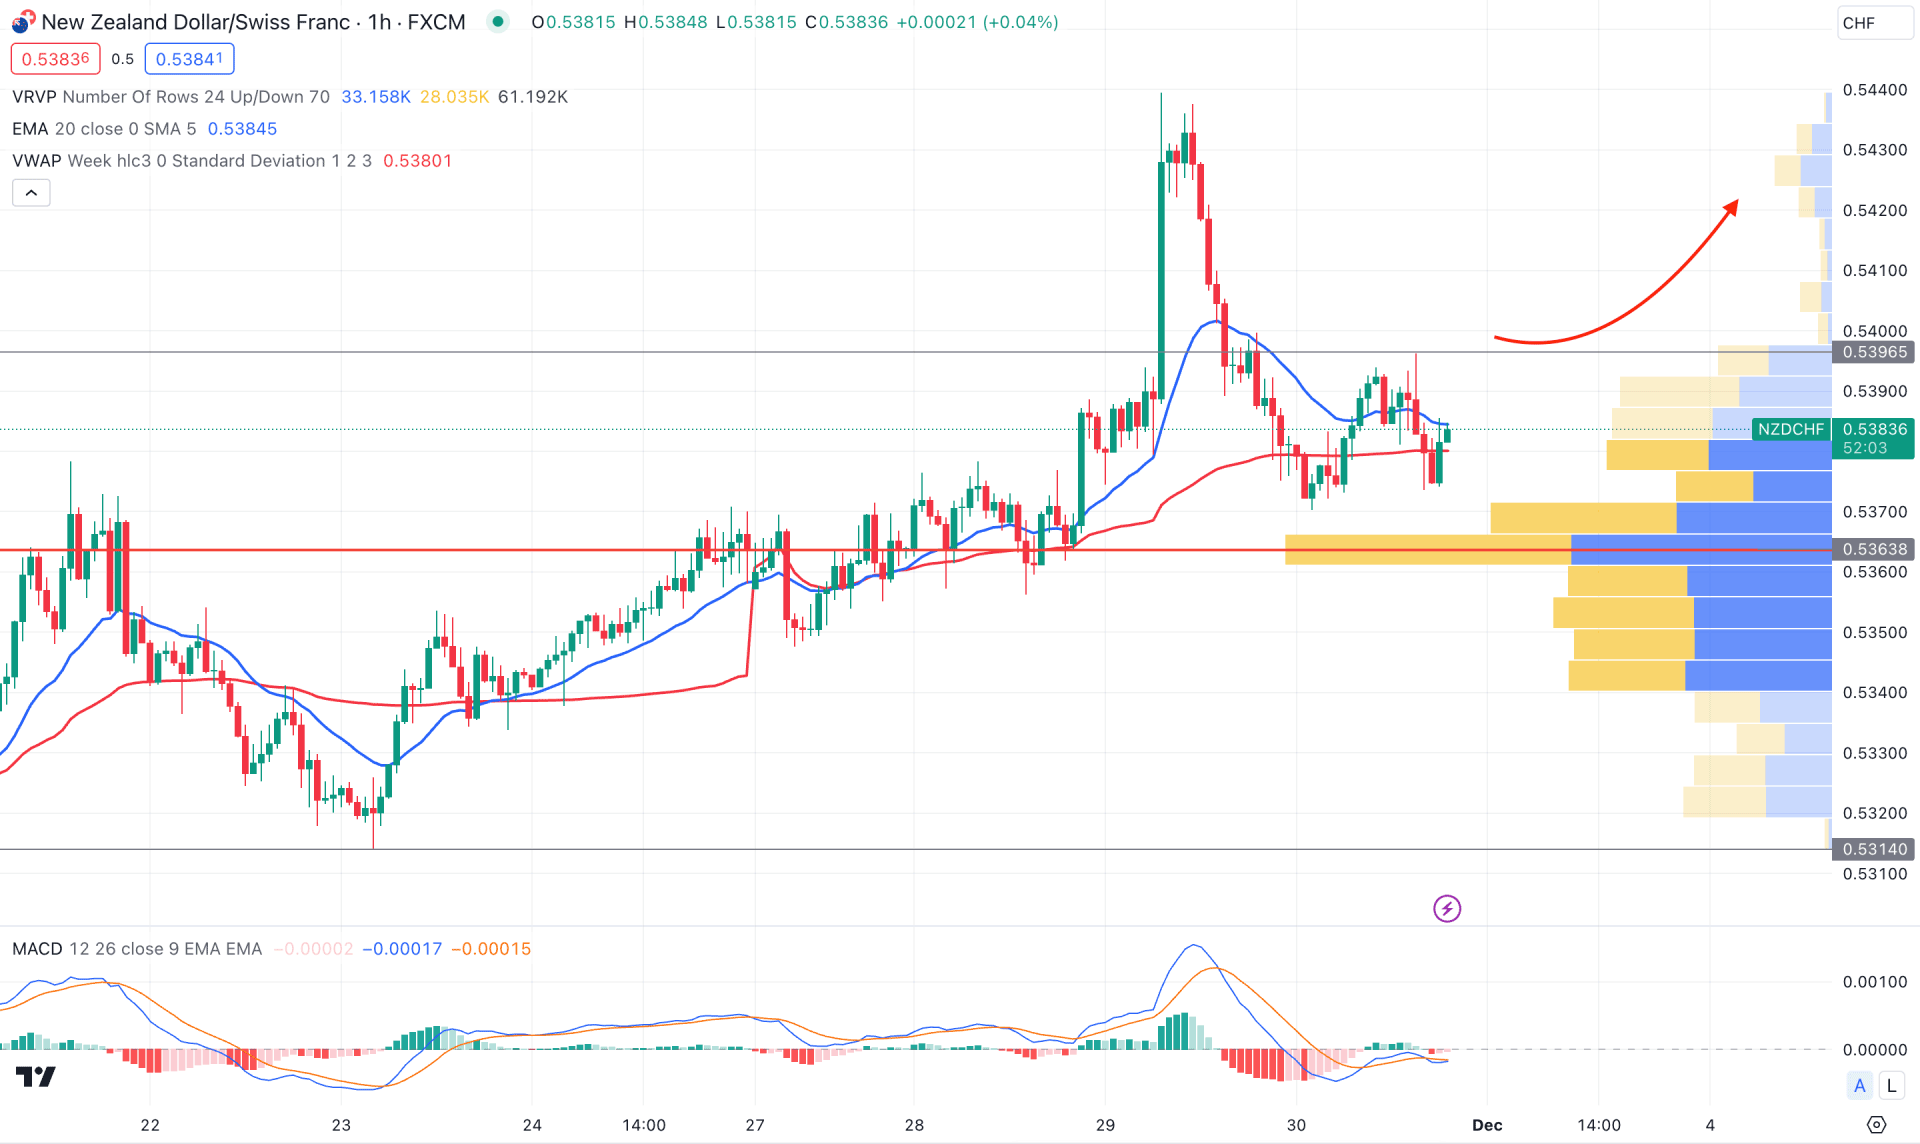
In the hourly chart, the NZDCHF price is trading within bullish pressure, supported by the visible range high volume level. Moreover, the dynamic 20 EMA works as an immediate support, from where buying pressure might come.
The MACD Histogram is below the neutral line, suggesting sellers’ presence in the market. However, MACD Signal lines are corrective below the neutral line, indicating a corrective price action.
Based on the H1 structure, a bullish breakout with a candle close above the 0.5396 level could be a long opportunity, targeting the 0.5500 level. Moreover, a bearish continuation might come after coming below the 0.5363 high volume level.
Based on the current multi-timeframe analysis of NZDCHF, the broader market direction is bearish, which needs a signal of buy-side liquidity sweep before forming a short opportunity. On the other hand, the long-term buying opportunity might come from the discounted price, but it needs a valid breakout in the daily chart.


