
Published: February 5th, 2026
The NZDCAD pair is trading with an intraday bearish pressure despite the broader outlook remaining bullish.
New Zealand's unemployment rate increased from 5.3% in the last September quarter to 5.4% in the 2025 December period, according to data released by Statistics New Zealand on Wednesday. This number represented the highest unemployment rate since the end of 2015 and was lower than the 5.3% estimate.
The Reserve Bank of New Zealand's (RBNZ) ongoing monetary easing, which caused the Kiwi to decline.
As oil prices drop by more than 0.5% following two days of increases, the commodity-related Canadian dollar (CAD) struggles. Following Tehran's confirmation of talks with Washington this week, the price of West Texas Intermediate (WTI) crude fell, reducing concerns about supply interruptions from a wider confrontation. A White House official confirmed preparations to engage Iran on a possible nuclear deal, while Iranian Foreign Minister Abbas Araghchi announced talks will take place in Oman on Friday.
Let's see the further outlook of this pair from the NZDUSD technical analysis:
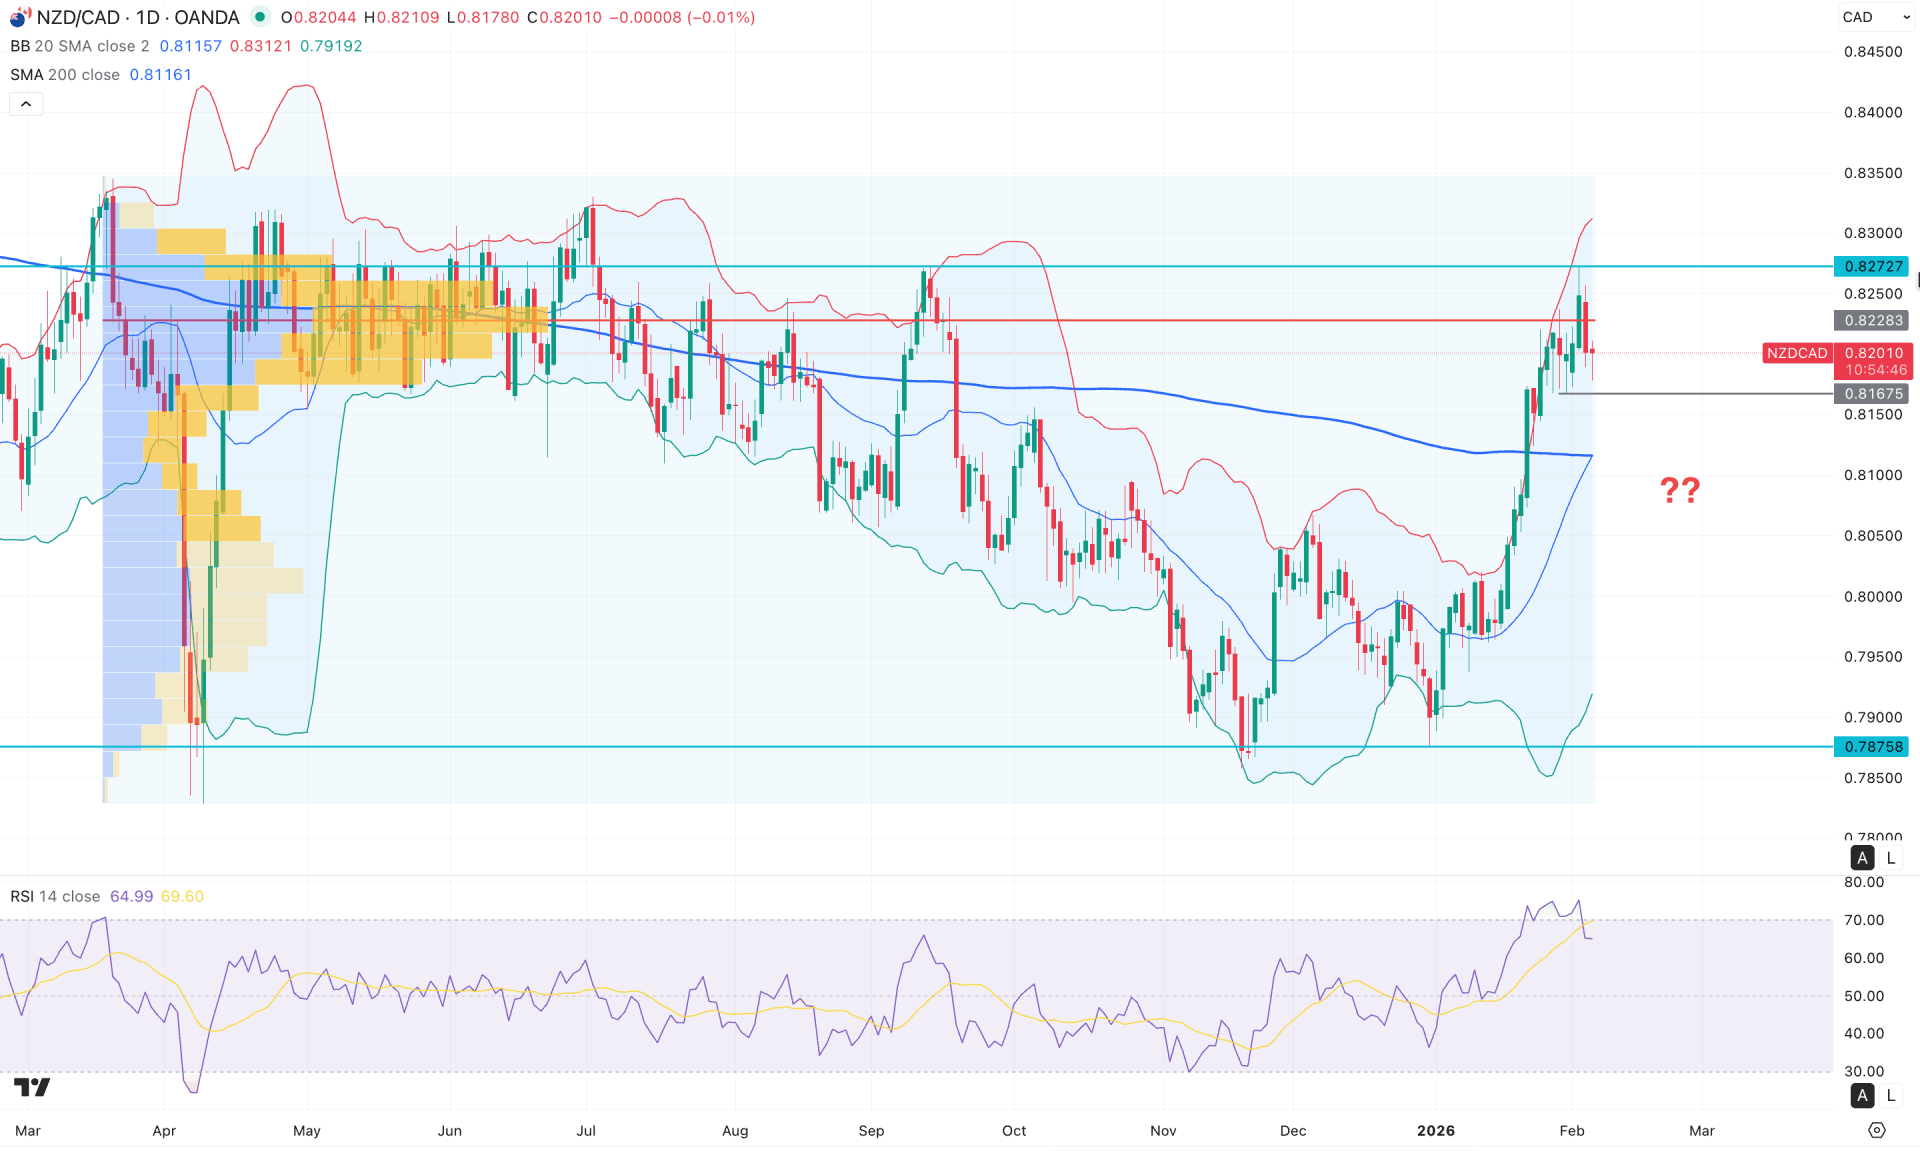
In the daily chart of NZDCAD, strong bullish pressure is visible as the price rebounded with a bullish range breakout. However, the most recent price has found resistance at 0.8272, from which selling pressure could emerge.
On the higher timeframe, a strong bullish monthly candle is visible, pushing the price above the three-month high in a valid engulfing pattern. This primarily signals a strong bullish reversal; however, more confirmation is needed before validating a long-term bullish wave. The weekly timeframe shows similar momentum, though the price is currently struggling to overcome weekly resistance near 0.8270.
In terms of volume, higher volatility is observed around the current price area, signalling a struggle to break above the immediate resistance. According to the high-volume indicator, the most active level since April 2025 is 0.8228, just below the current price. As a strong bearish daily candle may form from the high-volume line, a potential downside correction cannot be ruled out.
On the main price chart, the price is trading in a bullish, overextended zone, with the upper Bollinger Band acting as immediate resistance. As a result, a wide gap has formed between the price and the middle Bollinger Band, signalling a possible downside correction as a mean-reversion move.
Moreover, the 50-day EMA is below the current price and serves as strong support. The extended gap between the price and the 50-day EMA also suggests a short-term pullback, even though the broader market momentum remains bullish.
In the secondary indicator window, the Relative Strength Index (RSI) is hovering above the 70.00 overbought level, indicating an extremely bullish condition. However, no significant divergence is visible at the current level, suggesting no strong topping signal.
Based on the current market outlook, a minor downside correction is expected as the price approaches a resistance ceiling. Nevertheless, since the broader trend remains bullish, a strong daily close above the high-volume level could extend the rally toward the 0.8400 target.
On the other hand, failure to hold above the 0.8167 support level could increase downside risk, with the next major target being the 0.8000 psychological level.
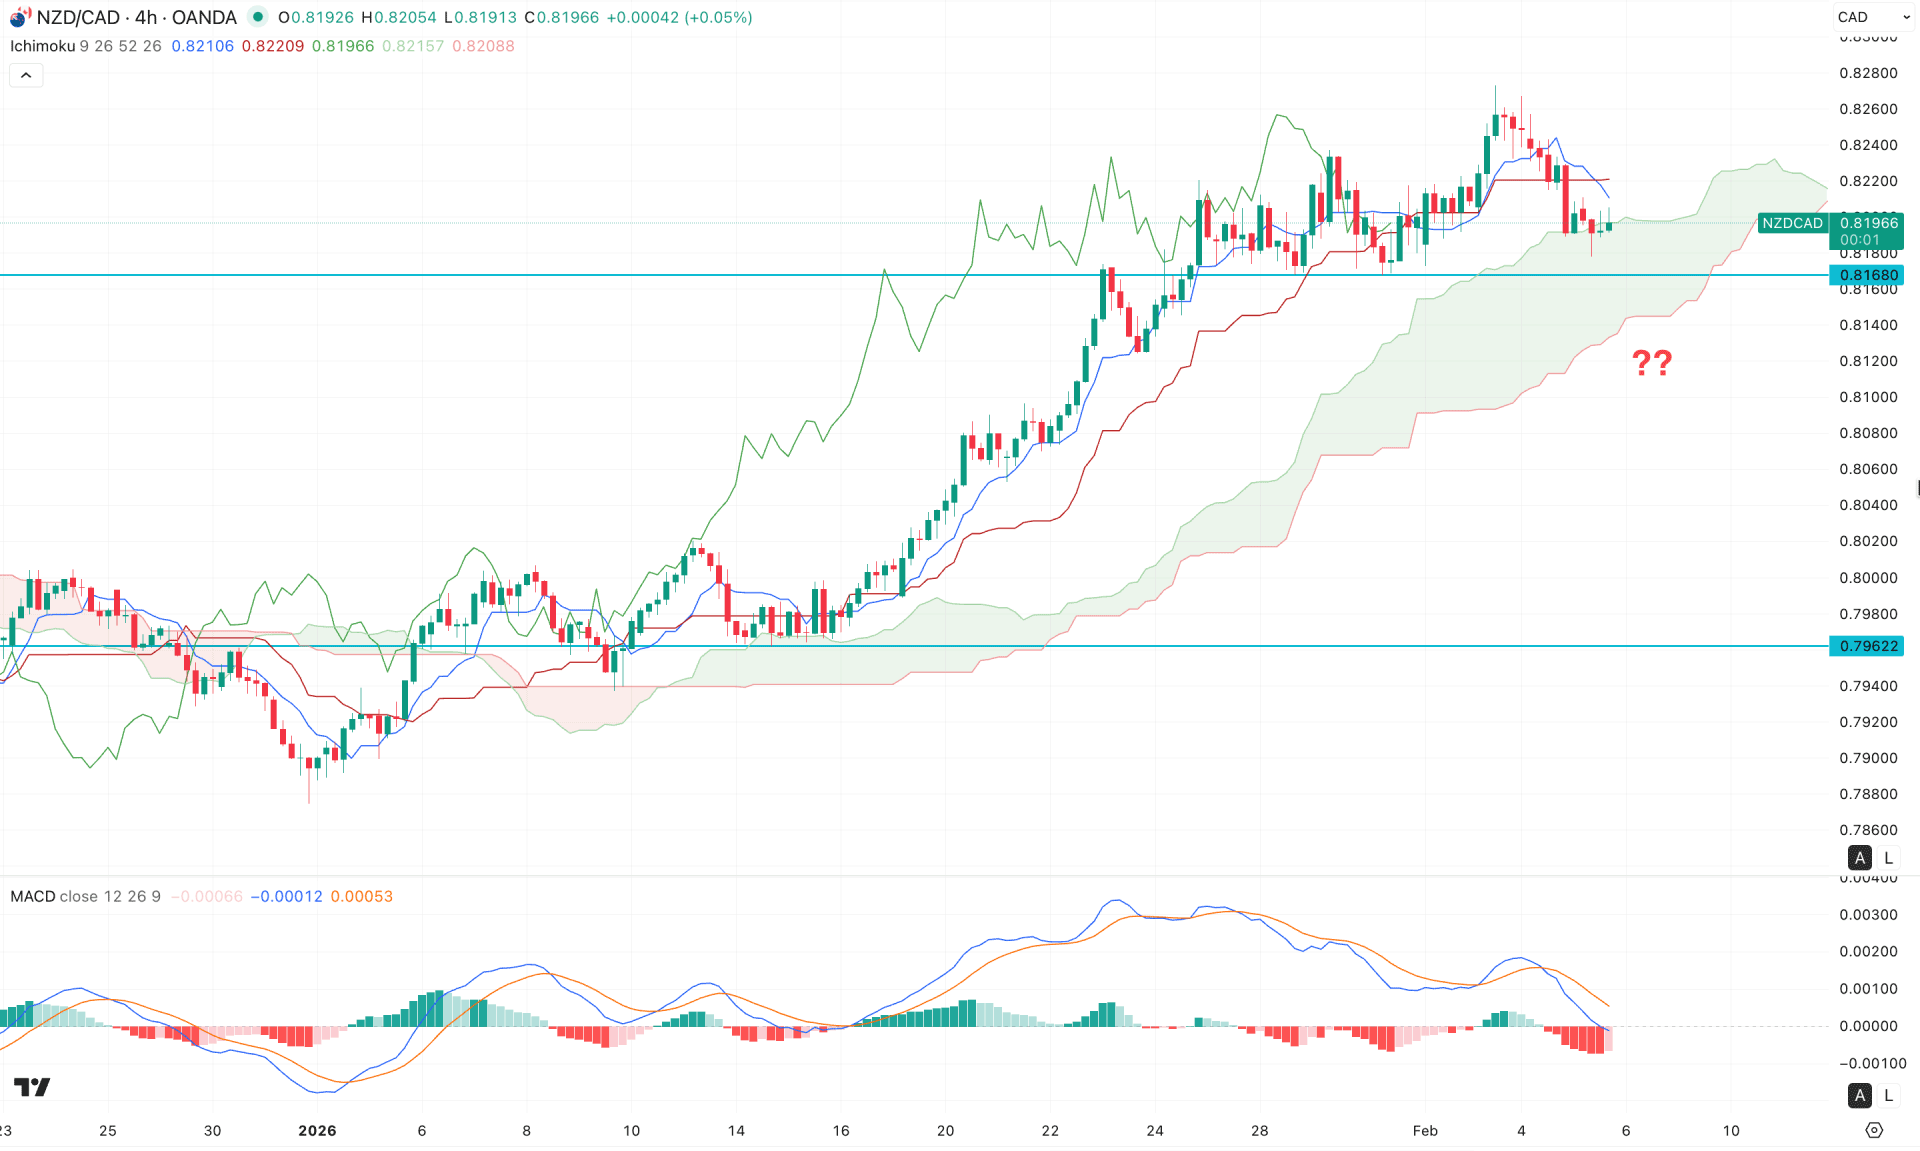
On the H4 timeframe, NZDCAD is trading above the Ichimoku cloud, signalling a potential bullish continuation. However, near-term price action has turned corrective, from where a trend extension remains possible.
In the future cloud, both Senkou spans have flattened, which signals a potential corrective phase within the current market trend. The recent bearish H4 close below the dynamic support level also suggests a temporary pause in buying pressure.
In the secondary indicator window, the MACD signal line has formed a bearish divergence against the recent price swing, indicating a possible loss of bullish momentum. Moreover, the histogram has remained below the neutral line for an extended period, maintaining downside pressure.
Based on the current market outlook, an immediate bullish reversal with an H4 close above the dynamic resistance level could offer a bullish continuation opportunity. Traders should closely monitor price behaviour around the 0.8168 level, as a strong breakout followed by a bullish rebound could present a high-probability setup. In both scenarios, the primary target would be the 0.8300 psychological level.
However, failure to hold above the 0.8168 support level, accompanied by a bearish H4 close, would be a challenging signal for buyers. In that case, a valid break below the Ichimoku cloud could open a short opportunity, targeting the 0.7980 level.
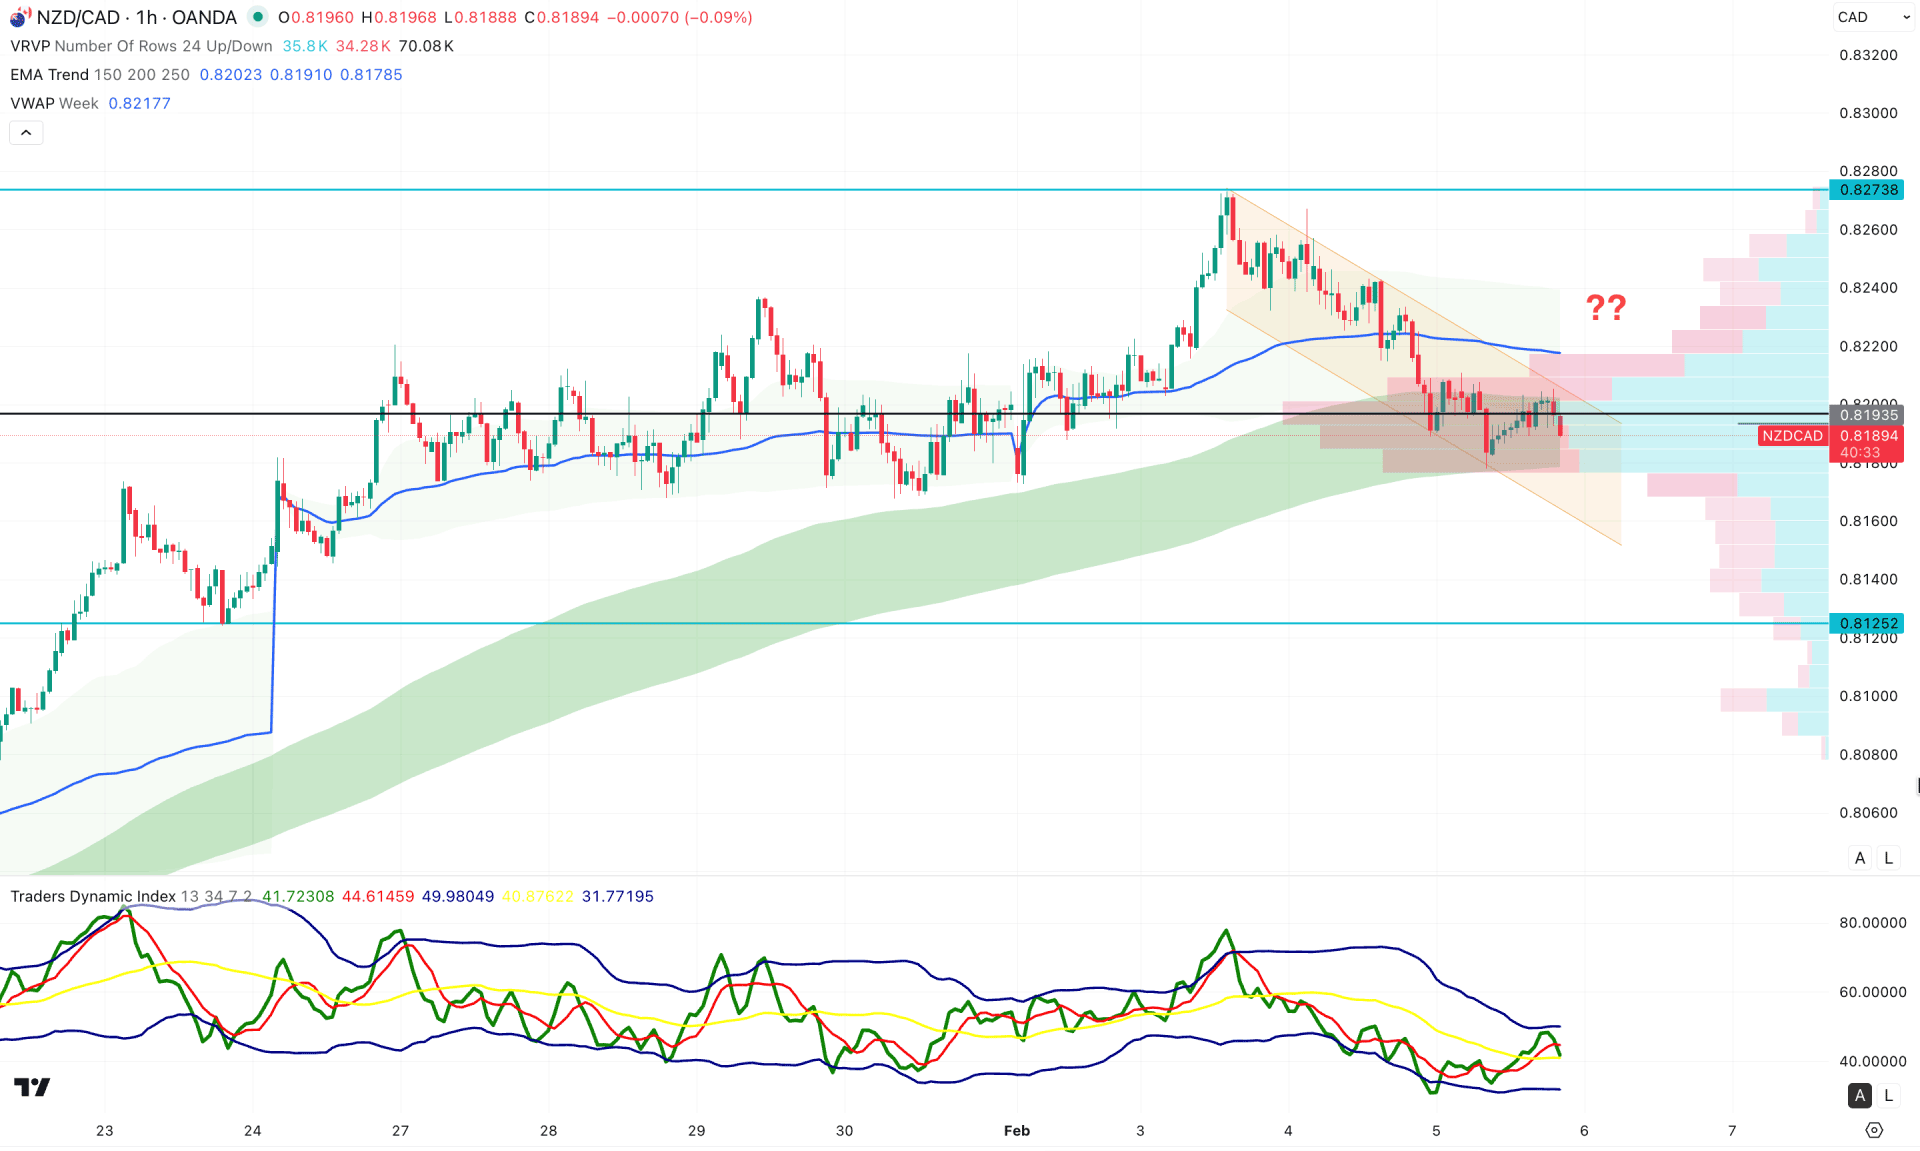
On the hourly timeframe, NZDCAD is trading within a descending channel, where recent price action is failing to break above the channel resistance, indicating emerging selling pressure. Moreover, the weekly VWAP is positioned above the current price and is acting as strong overhead resistance, reinforcing the resistance zone above the channel.
In the indicator window, the Traders Dynamic Index (TDI) has flipped from the upper peak area, signalling the emergence of selling pressure in the market.
Based on this outlook, the primary bearish objective is to monitor a channel continuation, with the initial target at the 0.8160 support level.
However, since the broader market momentum remains bullish, traders should closely observe price behaviour near the channel resistance area. A bullish breakout, confirmed by a valid one-hour close above the weekly VWAP, could present a long opportunity in line with the higher-timeframe trend.
From a broader market-structure perspective, NZDCAD is currently testing a key resistance zone, from where strong selling pressure has not yet materialised. The price remains above the key structural support, meaning any bullish signal could still extend the dominant trend. That said, as the price has already tested historical resistance, a liquidity sweep from the buy side followed by bearish confirmation could offer a short-term short opportunity.


