
Published: January 3rd, 2023
Since the beginning of the 2023 trading session, the NZD/CAD pair witnessed a sell-off despite China's upbeat Caixin Manufacturing PMI data.
The Kiwi declined against the Canadian dollar and reached the 0.8470 area despite figures remaining better than expectations but lower than the previous release. The economic data released at 49.0 vs. 48.8, the projections could help the Kiwi to gain against the CAD as it is the largest trading partner of China.
Going forward, investors will focus on how China’s current foreign trade and promotion status is released. As per the recent findings, Pan Gongsheng, China’s State Administration of Foreign Exchange (SAFE) Director, mentioned that the country will use exchange policy tools where the main aim is to promote foreign trades and manage its FX reserve assets in 2023.”
On the other hand, Loonie trades will focus on how the employment data comes on Friday. As of now, the Canadian economy is facing trouble from higher wage prices. The increase in employment bills might keep the inflation rate high. In that case, the BOC Governor might focus on further tightening policies.
In the energy sector, the Crude oil price could stay above the $80.00 level as investors are expecting a surge in the Covid infection in China.
Can the Canadian Dollar extend its gain against the Kiwi? Let's see the complete price prediction from the NZDCAD technical analysis:
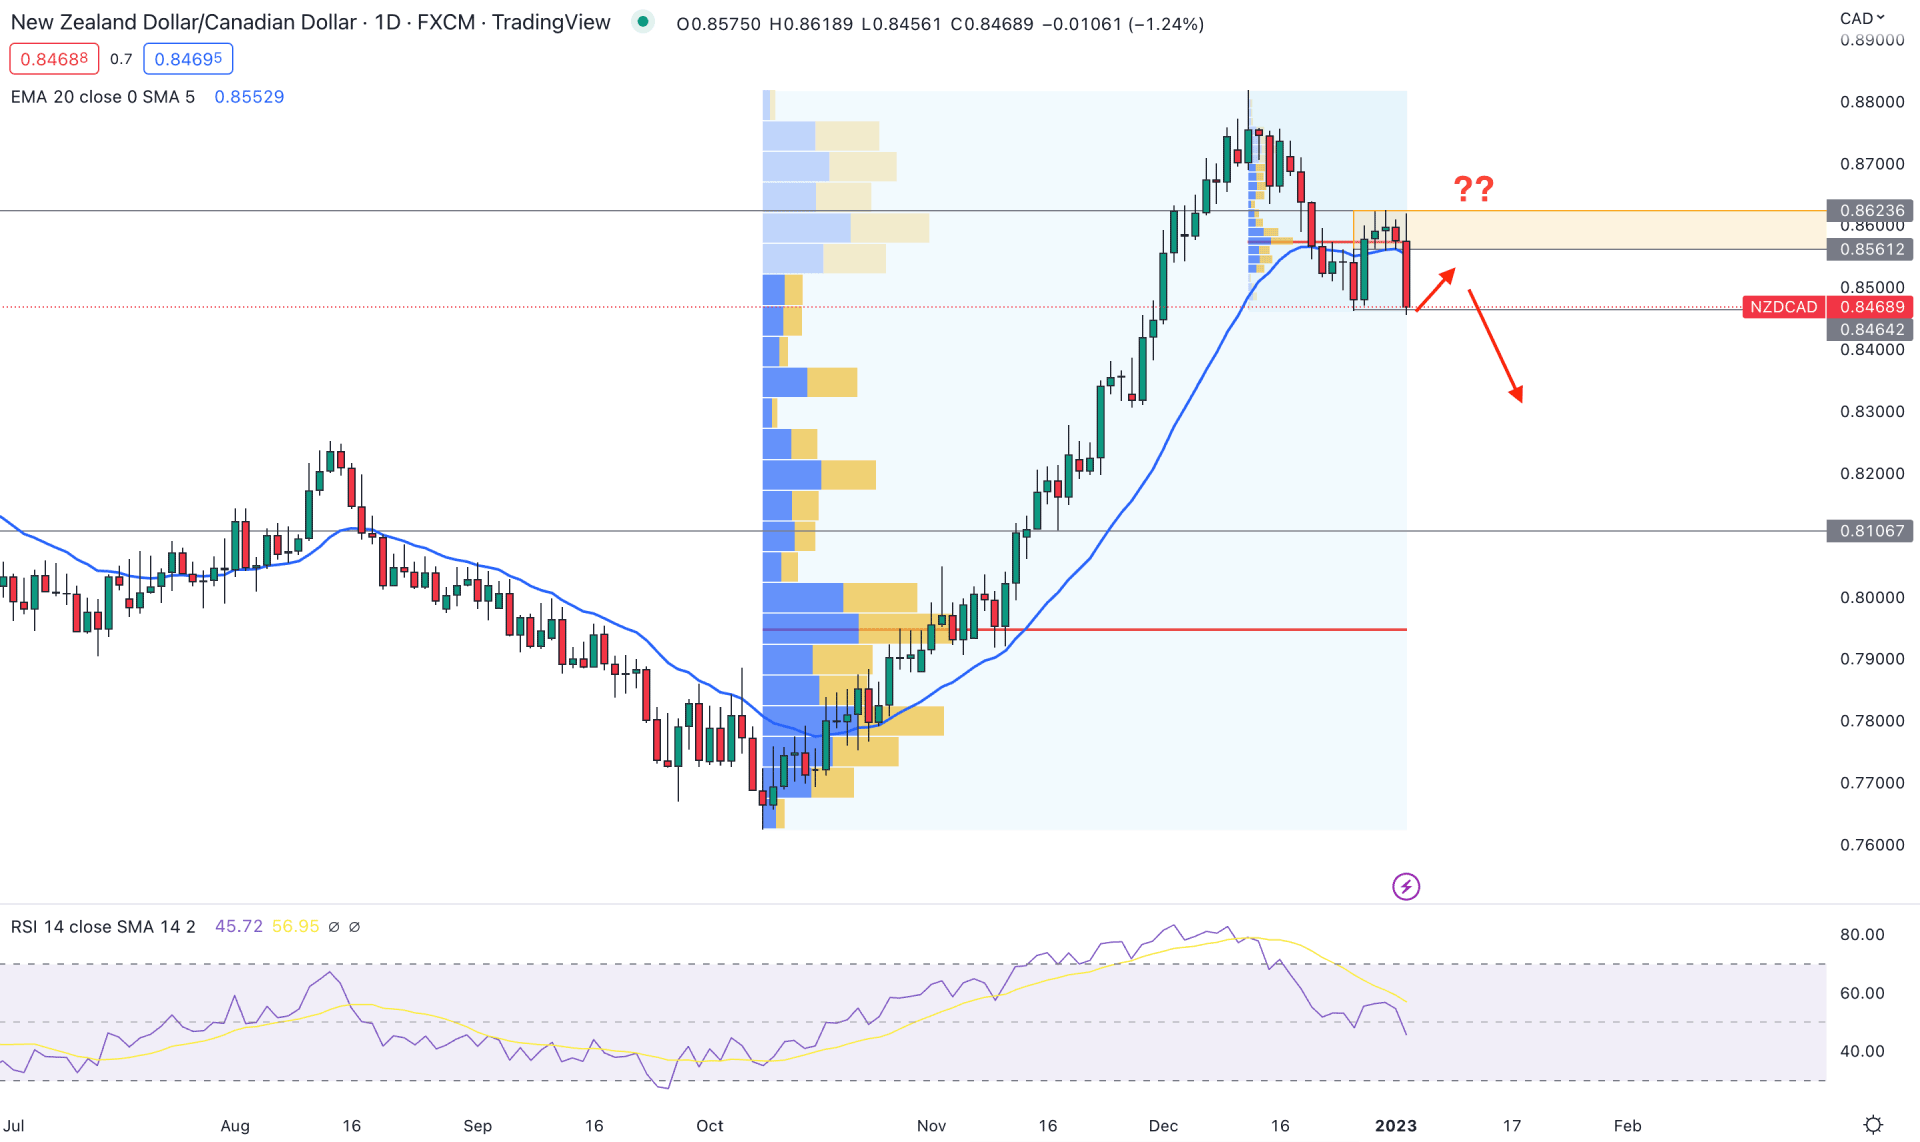
In the daily chart, the current price is trading downwards but it is still within a broader bullish trend. The top of the bullish swing is spotted at the 0.8818 level, which is the highest peak of the current tradable range. On the downside, no solid bottom is formed, which is a sign that sellers have more space to take the price lower.
From the October 2022 low to December 2022 high, the highest trading volume level is spotted at 0.7984 level, which is 500 pips below the current price. Therefore, bulls from the 0.7984 area might offload some gains, which can lower the price as a mean reversion. Moreover, the high volume level from the December-January peak is at 0.8574 level, which is above the current price. It is a sign that short-term bears have joined the market, and can lower prices in the intraday chart.
A new swing low below the 0.8464 level would validate the 0.8626- 0.8560 area as a valid supply zone. In that case, any upside correction would increase the bearish possibility, where the ultimate target is to reach the 0.8100 area.
The Indicator window shows how the RSI is heading toward the 30% area, where a stable momentum below the 50% level could increase the selling pressure on the price.
Based on the daily outlook, a bearish possibility in this pair is potent as long as it trades below the 0.8623 resistance level. In that case, investors should closely monitor the intraday chart to find a bearish trend trading opportunity.
On the upside, a stable price above 0.8650 is needed before aiming for the 0.8900 area.
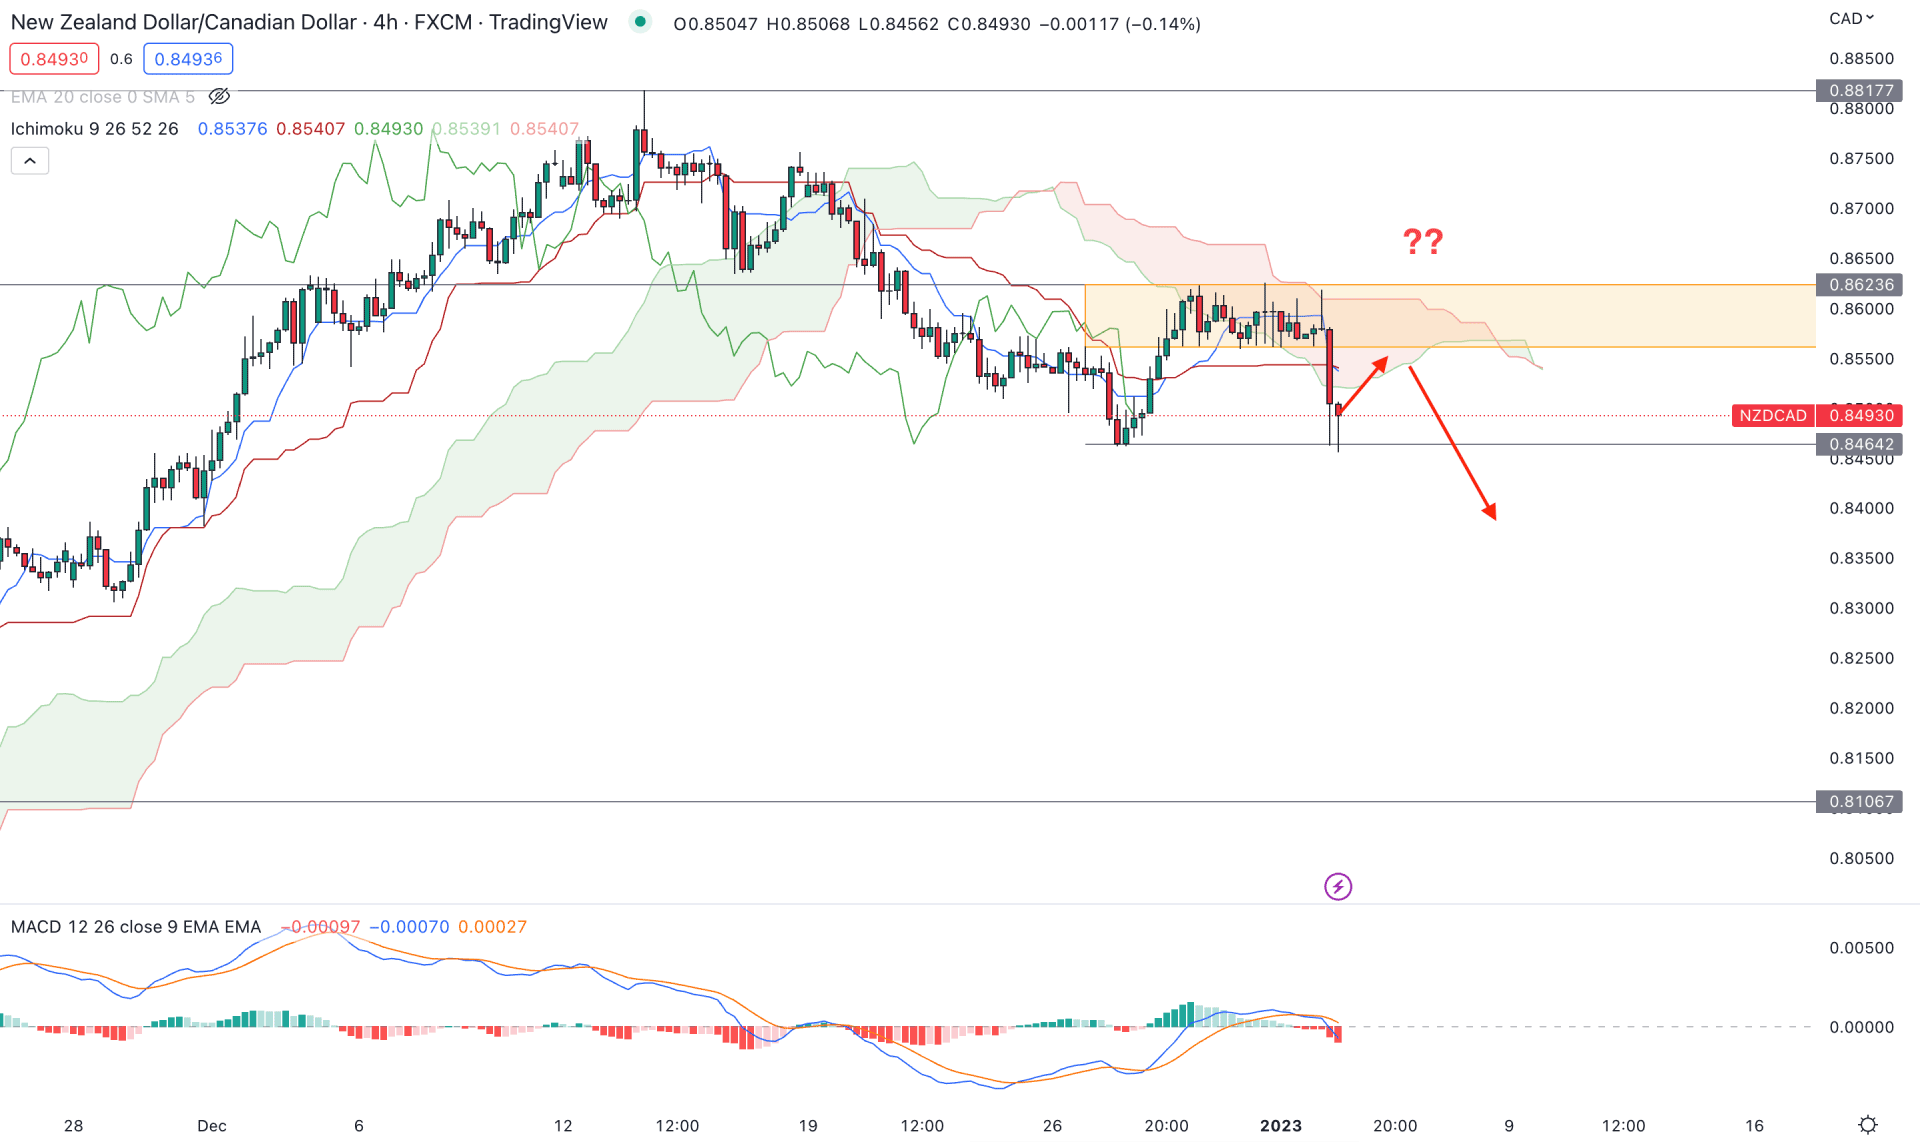
In the H4 timeframe, the broader outlook for the NZDCAD price is bearish as it is trading below the dynamic Cloud resistance. However, the selling pressure appeared with a solid breakout and a retest of the cloud area. In that case, any bearish trend trading opportunity in this pair is valid as long as it trades below the 0.8623 swing high.
In the future cloud, the Senkou Span A and B are closer together, which is a sign of a price reversal. Moreover, the MACD Histogram is bearish where MACD lines have more rooms to move down.
Based on the H4 structure, a bearish trend trading opportunity is valid as long as the current price is trading below the 0.8623 resistance level. In that case, the price has a higher possibility of lowering toward the 0.8300 psychological level in the coming hours.
On the other hand, a solid recovery and an H4 candle above 0.8650 could open a bullish opportunity, targeting the 0.8850 area.
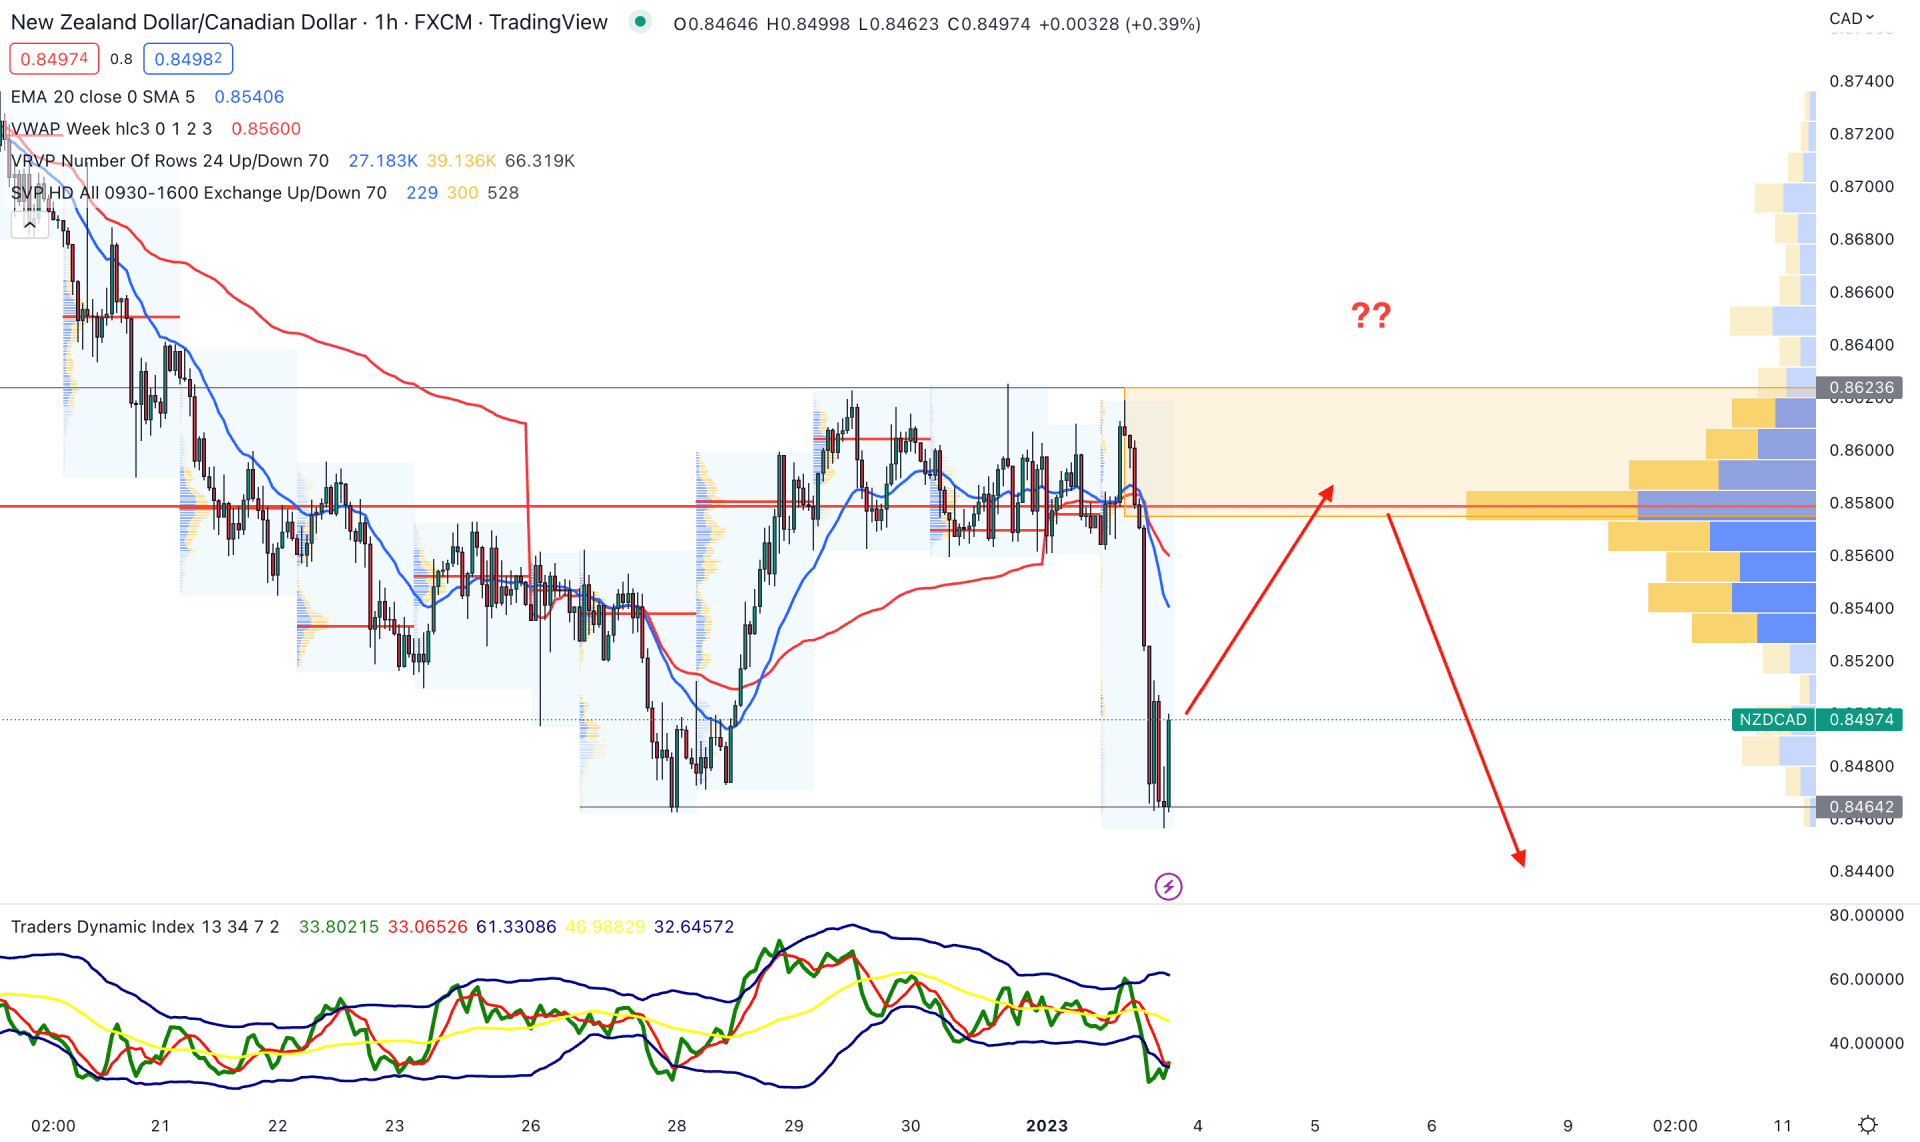
In the hourly chart, the current price is below the visible range high volume level, which is a sign that the current market outlook for this instrument is bearish.
However, there is a strong gap between the price and the near-term supply zone, which can open a short opportunity after a correction.
The primary aim of the current bullish pressure is towards the dynamic weekly VWAP from where a bearish pressure could come. However, breaking above the 0.8650 level would invalidate the current bearish pressure and validate bullish Quasimodo formation, targeting the 0.8800 area.
Based on the current price outlook, the bearish possibility in the NZDCAD is potent but it needs validation from the intraday chart. However, the H1 and H4 outlooks are still bullish and investors should find a solid bearish rejection before opening a short position.


