
Published: November 22nd, 2022
In New Zealand, the PPI data showed inputs gaining 0.8% q/q in Q3, down from 3.1% q/q the last quarter, while in Q2 outputs gained 1.6% q/q, down from 2.4% q/q.
RBNZ may welcome that price pressure is decreasing as an indication of a slower gain compared to Q2. GDT price increased 2.4% as there is an excellent bounce back in dairy prices. This comes after three continuous declining auction prices so still subdued overall dairy prices.
We will have Q3 consumption data and the RBNZ meeting this week. With the OIS curve discounting 63 bp, market positioning hovers between 50 bp-75 bp rate hike.
In Canada, the October inflation report was as expected as the headline reading remained unchanged at 6.9% y/y. Core readings were upside across the board with the median trimmed to 5.3% y/y, ticking up to 4.8% y/y.
The overall economic condition of this country shows a better position for Canada, which could offer a short opportunity in this pair. Moreover, the daily and weekly trend is bearish, where investors should find a buy-side liquidity grab before opening the short position.
Let’s see the future price of NZDCAD from the NZDCAD technical analysis:
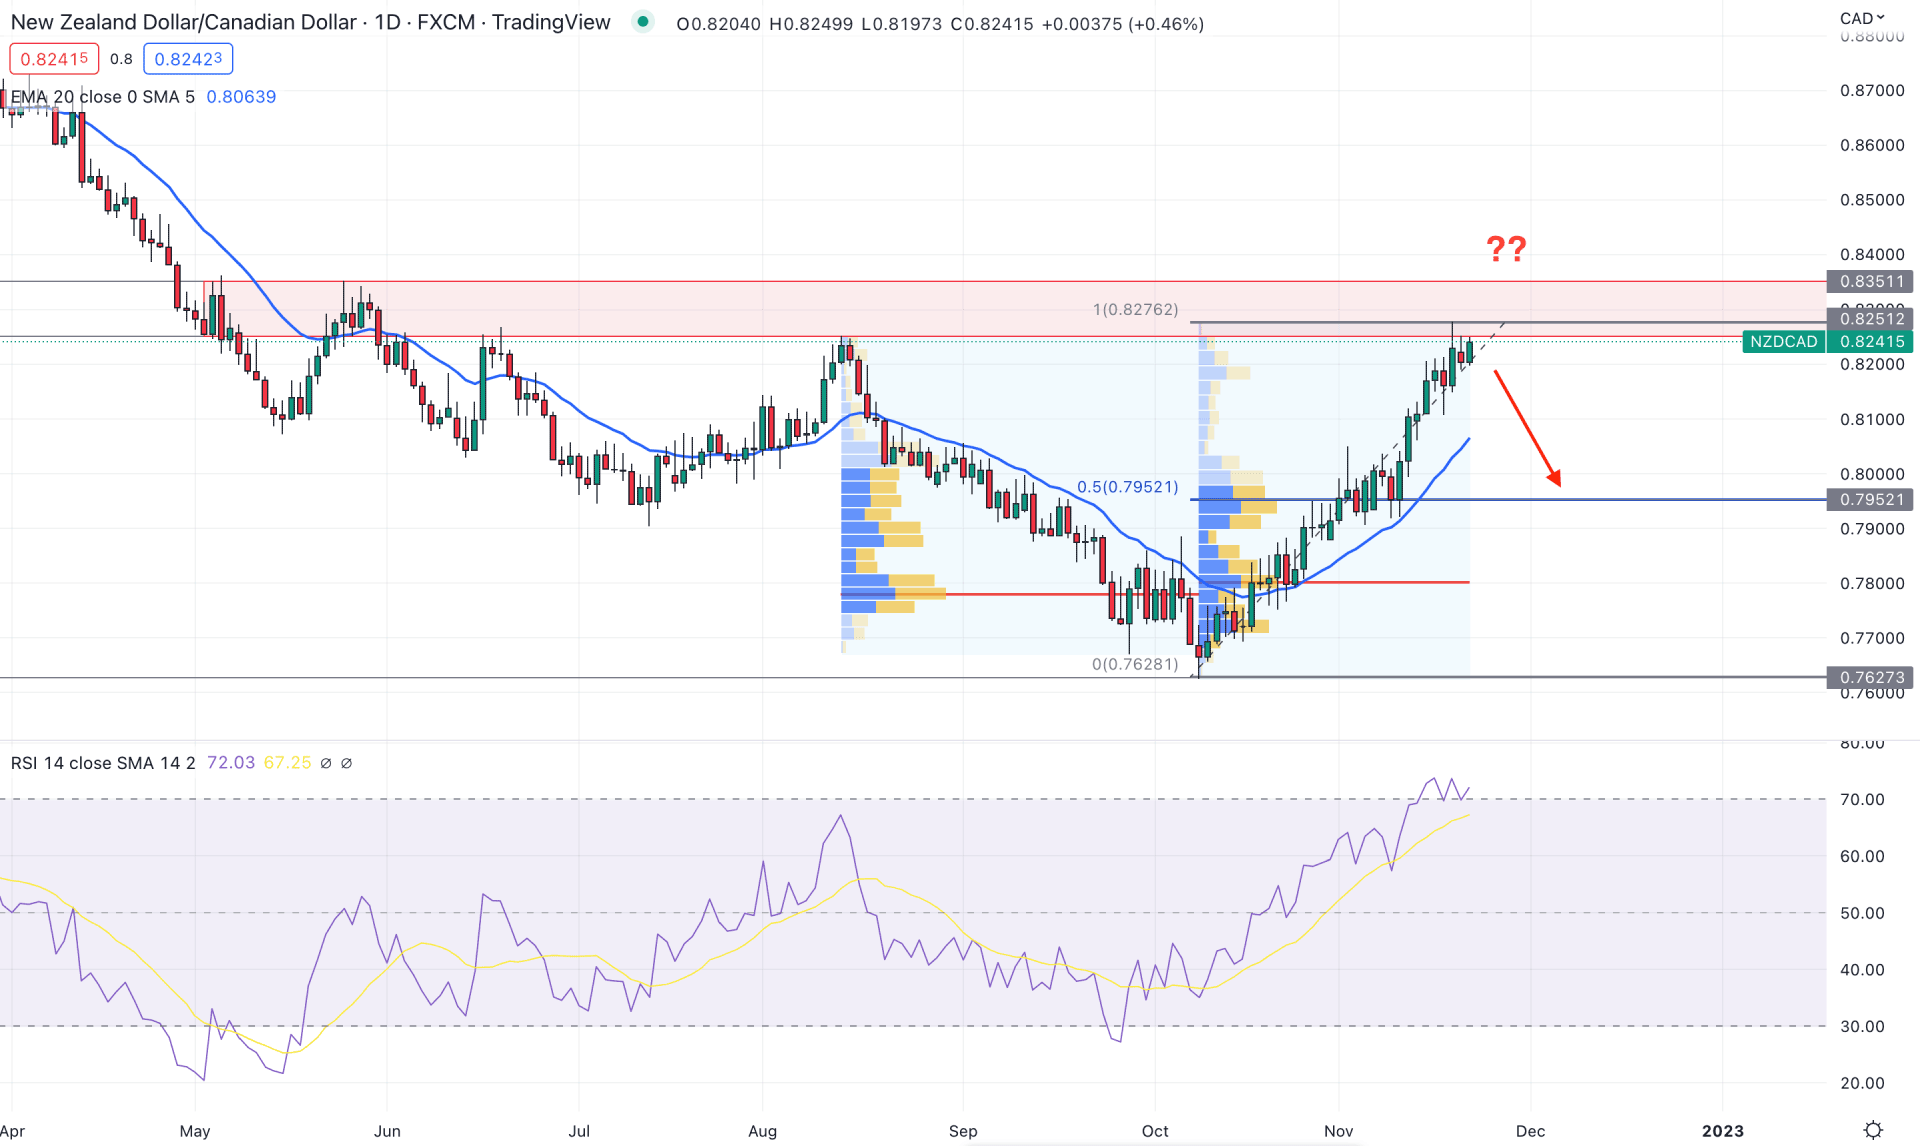
In the NZDCAD daily chart, the broader outlook is bullish as the current price is aiming higher by creating swing highs. However, the buying pressure from the 0.7627 swing low came by forming a bullish Quasimodo pattern, which would be the lower limit of the current trading range. As the current price is trading in the premium zone from 0.8151 high to 0.7627 low, any bearish opportunity could have more space to provide a decent return.
Based on the fixed range high volume indicator, the highest trading volume from the August high to October low is at 0.7778 level. From the October low to November high, the highest volume level was slightly changed at 0.7802 level. It is a sign that lots of buyers are present in this zone, who might take some profits from the current premium price.
There is a strong gap between the price and the 20-day Exponential Moving Average, which indicates that a minor bearish correction is pending in this pair. Moreover, the Relative Strength Index (RSI) reached the overbought zone, which is another sign that bulls might be done with their activity.
Based on the current daily outlook of NZDCAD, any selling pressure from 0.8250 to 0.8300 could offer a short opportunity where the primary aim is to test the 0.7952 level.
The alternative approach is to wait for the precise, breaking above the 0.8355 level to consider the short opportunity as invalid. In that case, the buying pressure could extend toward the 0.8600 area.
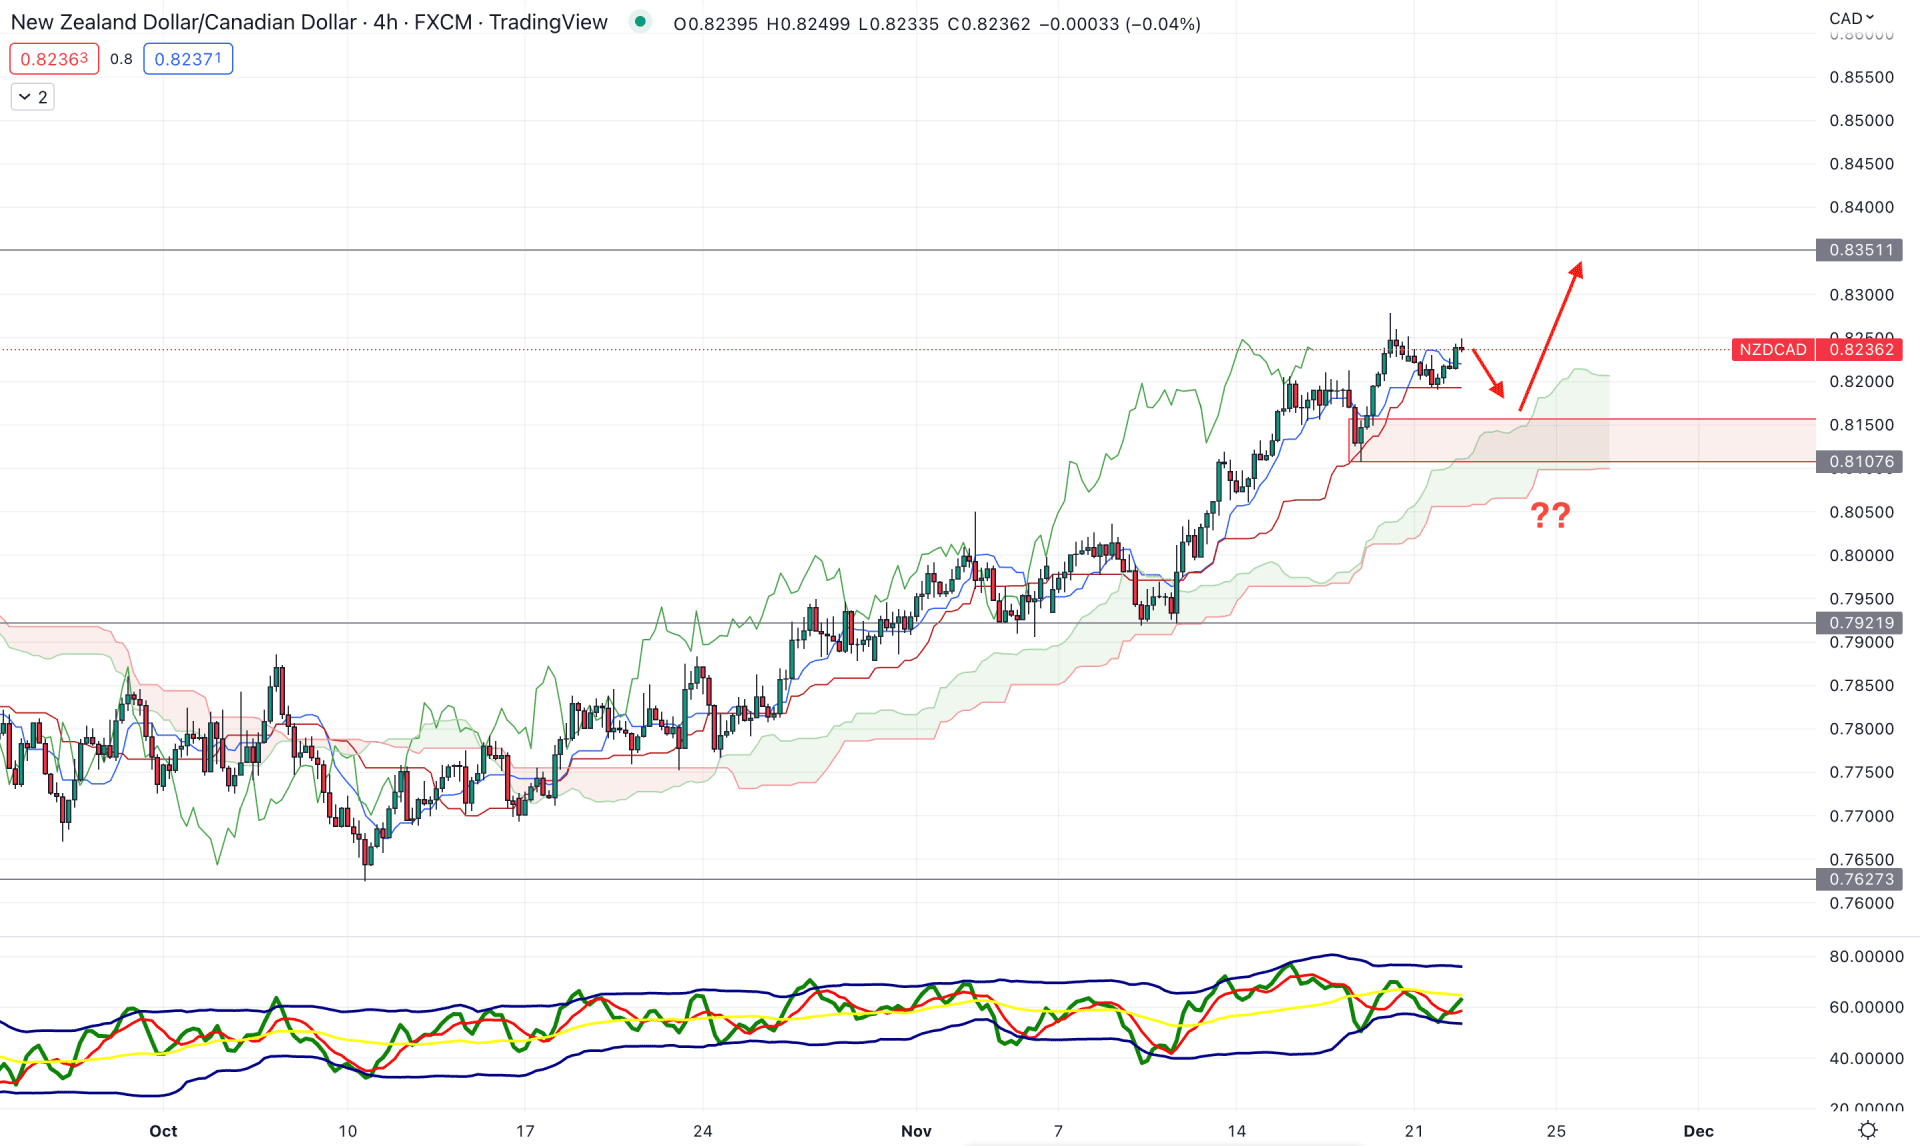
As the current price is at the premium zone, investors should wait for a bearish Break of the structure before aiming for a short opportunity from the Ichimoku Cloud breakdown.
As per the current position of the future cloud, the bullish momentum is still valid as the Senkou Span A is above the Senkou Span B. Moreover, the Lagging Span is above the price, showing a strong buyers’ presence in the market.
In the indicator window, the Traders Dynamic Index (TDI) shows a buying pressure also, where the current TDI level has formed a bullish crossover at the 50% level. Moreover, the dynamic Tenkan Sen and Kijun Sen are still below the price, working as a support level.
Based on the NZDCAD H4 outlook, the bearish pressure should come with a new low below the 0.8100 area. On the other hand, any false break below the dynamic Kijun Sen and a recovery could offer a long opportunity, targeting the 0.8357 level.
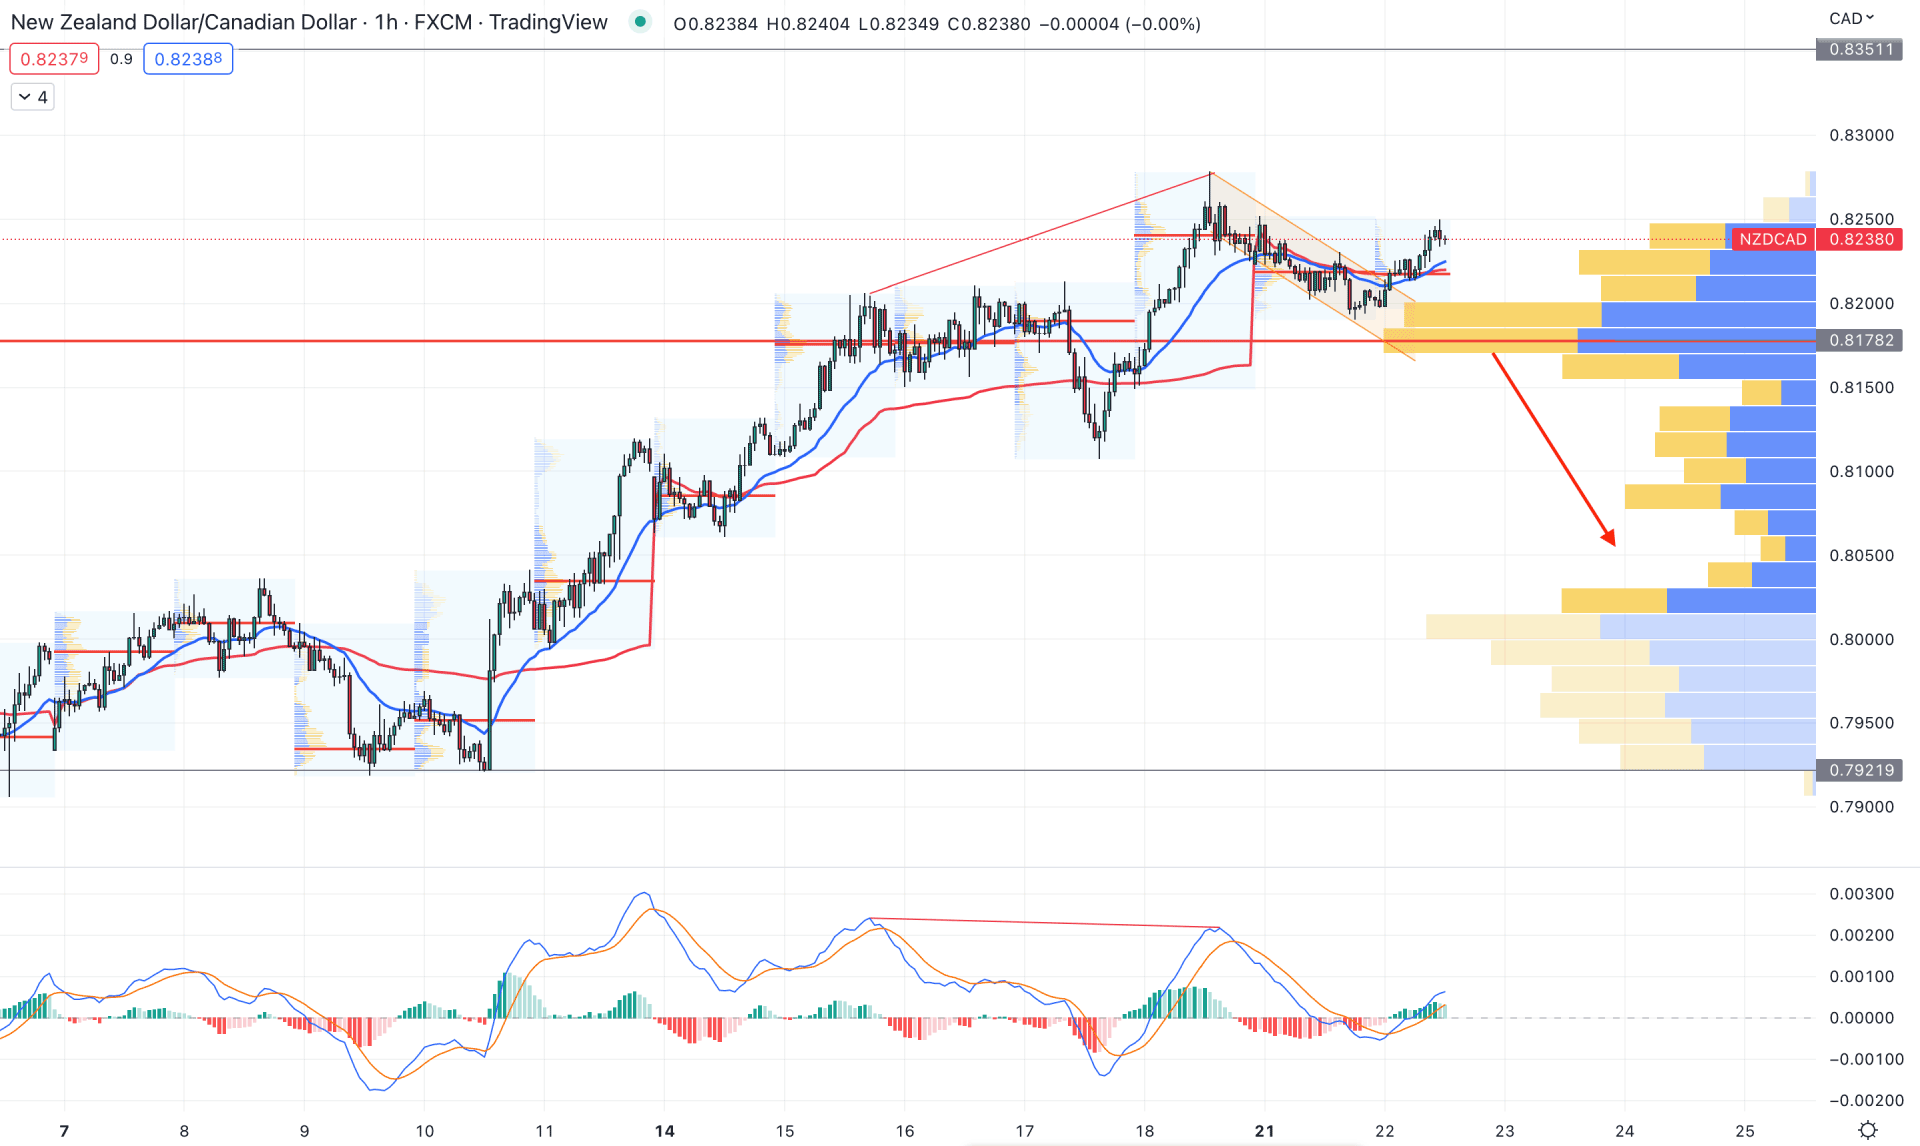
In the hourly chart, the buying pressure is visible in the NZDCAD pair as the current price is aiming higher from the descending channel breakout. Moreover, the visible range high volume indicator shows that bulls are still active, despite a divergence with MACD.
The dynamic weekly VWAP and 20 EMA are below the price, while the session's high volume level is providing buying pressure. In that case, any bullish rejection could extend the price toward the 0.8350 area.
In the daily chart, the peak should be confirmed from the H1 price action, where a violation of the bullish pressure with a bearish break of structure could open a short opportunity, towards the 0.8000 area.
Based on the current price outlook for NZDCAD, the upside pressure is still valid, where multiple lower low formations in the intraday price could indicate sellers' presence in the market. However, as the current price is in the overbought area, any short opportunity could come with a high risk vs. reward ratio.


