
Published: December 7th, 2020
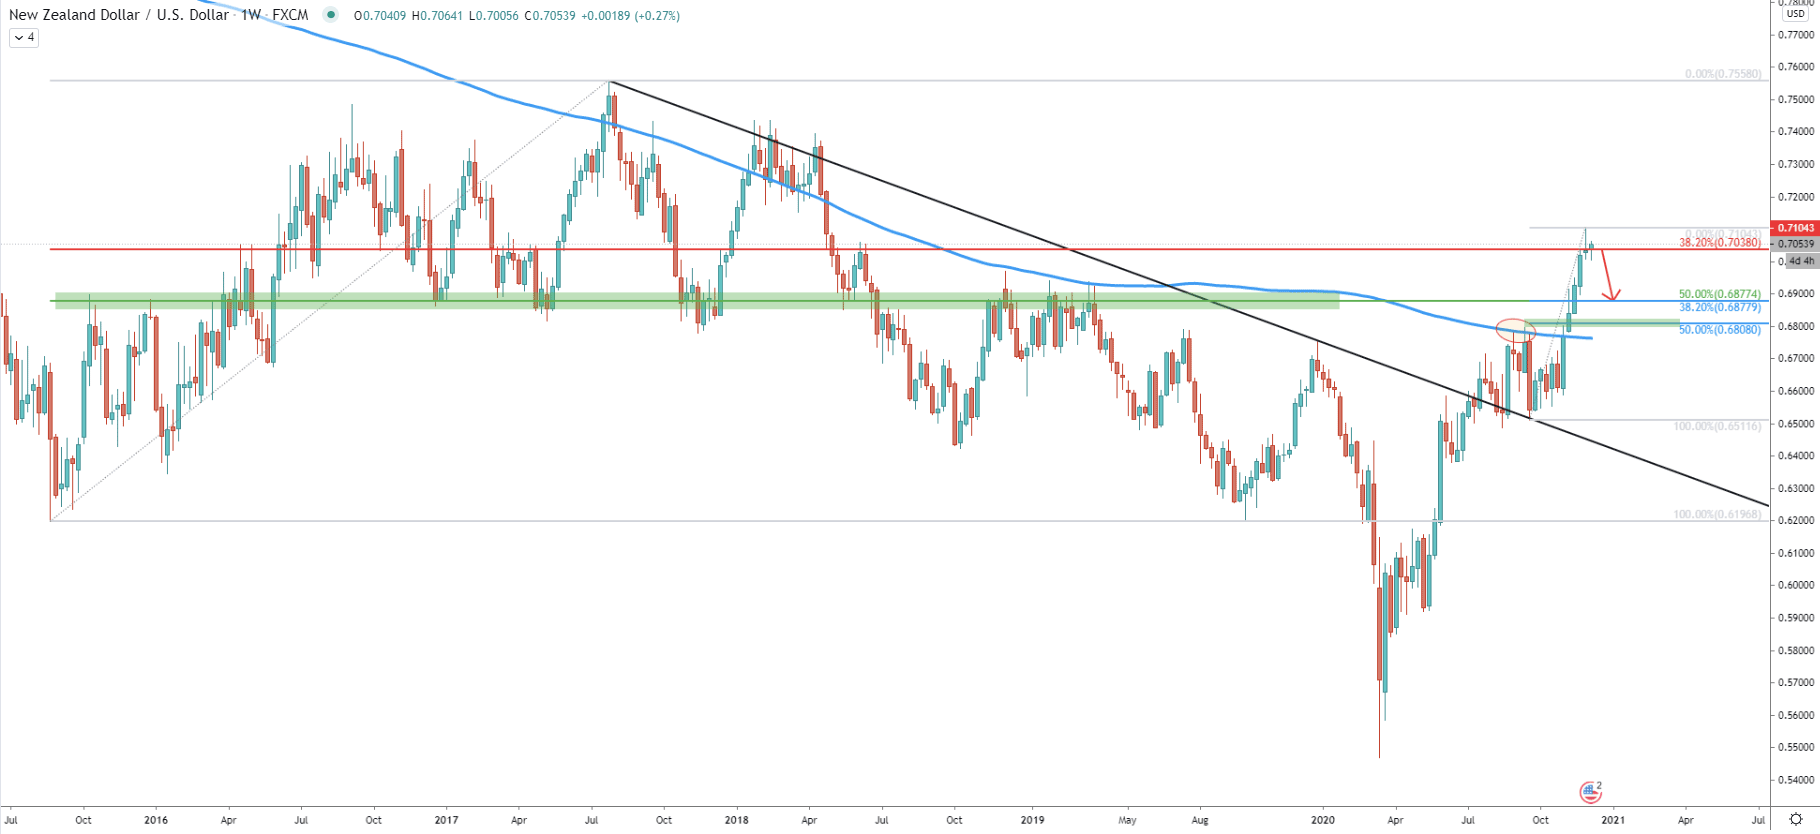
On March 19, NZD/USD bottomed out while hitting the 0.5469 low. Since then pair has been on a steady rise and has managed to recover 29.9% up until last week. Two weeks ago, the price has reached and rejected 0.7038, which is the 38.2% Fibonacci retracement level, applied to the 2015 - 2017 corrective move up. This was a clean rejection at first, but then the price has produced a spike above, but then failed to close higher than 0.7038, validating the resistance.
Perhaps the high at 0.7104, which was tested last week, is the top of the current uptrend. It should either result in a trend reversal or at least a correctional move down. There are two very important support levels, where NZD/USD could be heading, as long as current resistance holds. The first is at 0.6872, which is confirmed 2 Fibs, 50% and 38.2% Fibs applied to the last wave up, which started where NZD/USD rejected the downtrend trendline. The second is at 0.6808, which is a 50% retracement level, corresponding to the previous resistance area, where NZD/USD rejected the 200 Simple Moving Average.
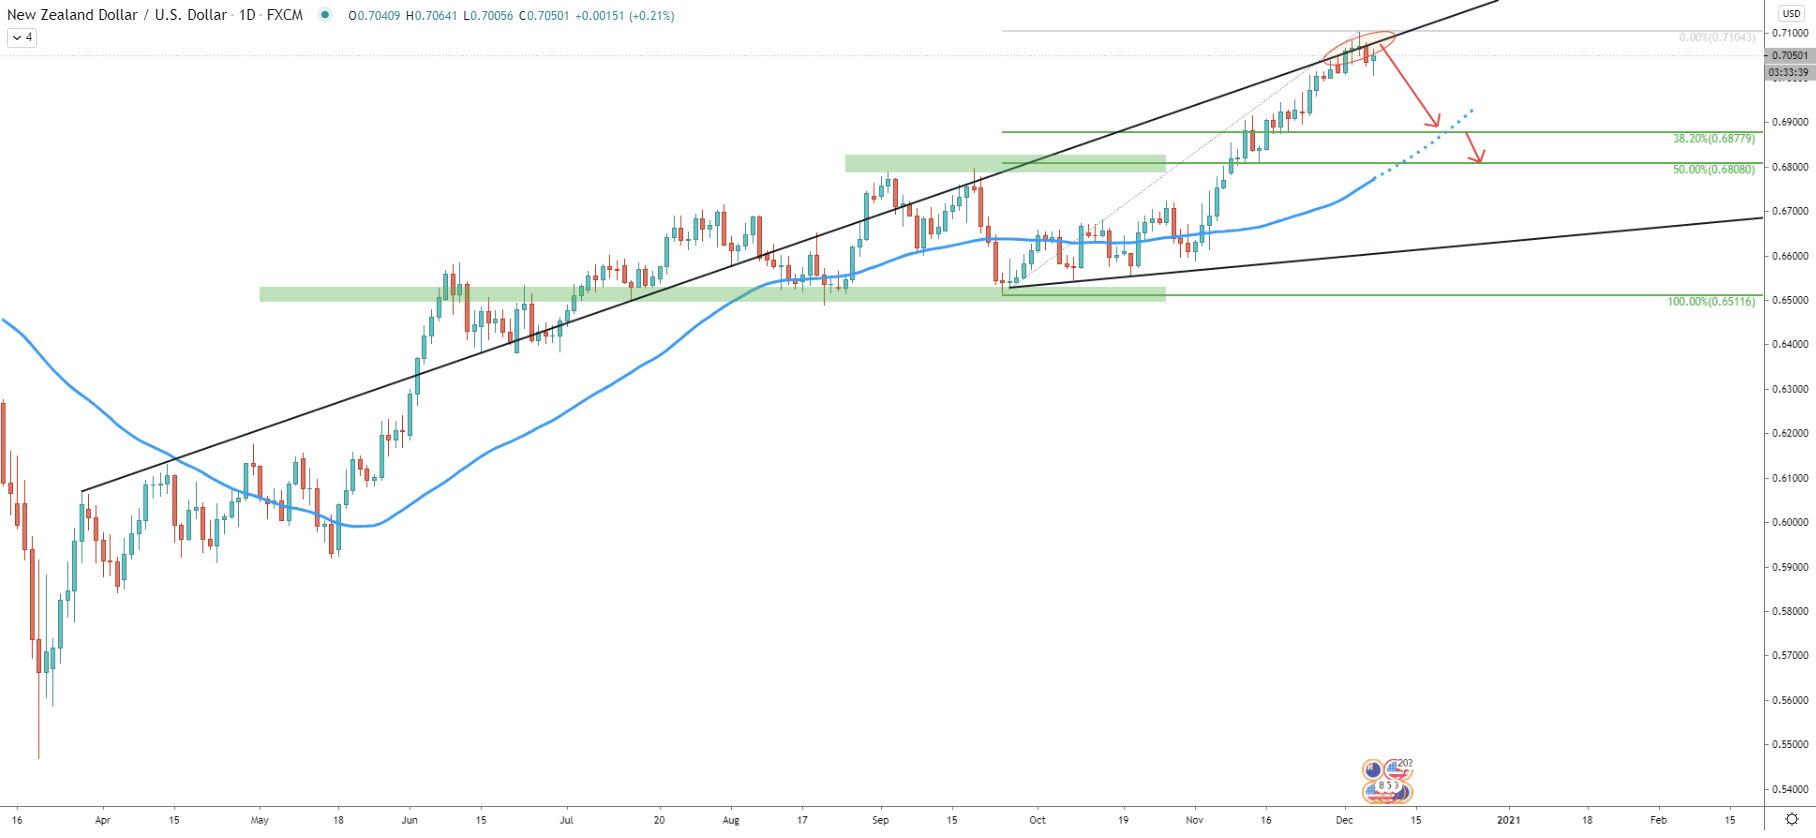
On the daily timeframe, it can be seen, that NZD/USD has reached and rejected the average-price uptrend trendline, suggesting a potential trend reversal. The previously discussed support levels, on this chart also correspond to other indicators. The first target at 0.6878 corresponds to the extended 50 Moving Average, while the second target at 0.6808 corresponds to the previously formed supply/demand zone.
Yet again, there are more confirmations that price could be declining towards one of the two support levels. The 0.6878 on this chart corresponds to the bottom of the ascending channel as well as the average-price uptrend trendline. The 0.6808 support corresponds to the 200 Exponential Moving Average. This goes to show, that to each support, there are multiple confirmations and that at the very least NZD/USD might decline by 180 pips. But if it reaches the second target, this will be a 240 drop in price. Based on the support indicators crossing with the Fibonacci, the downside move could be ending this month, suggesting 2-3 weeks of a downtrend.
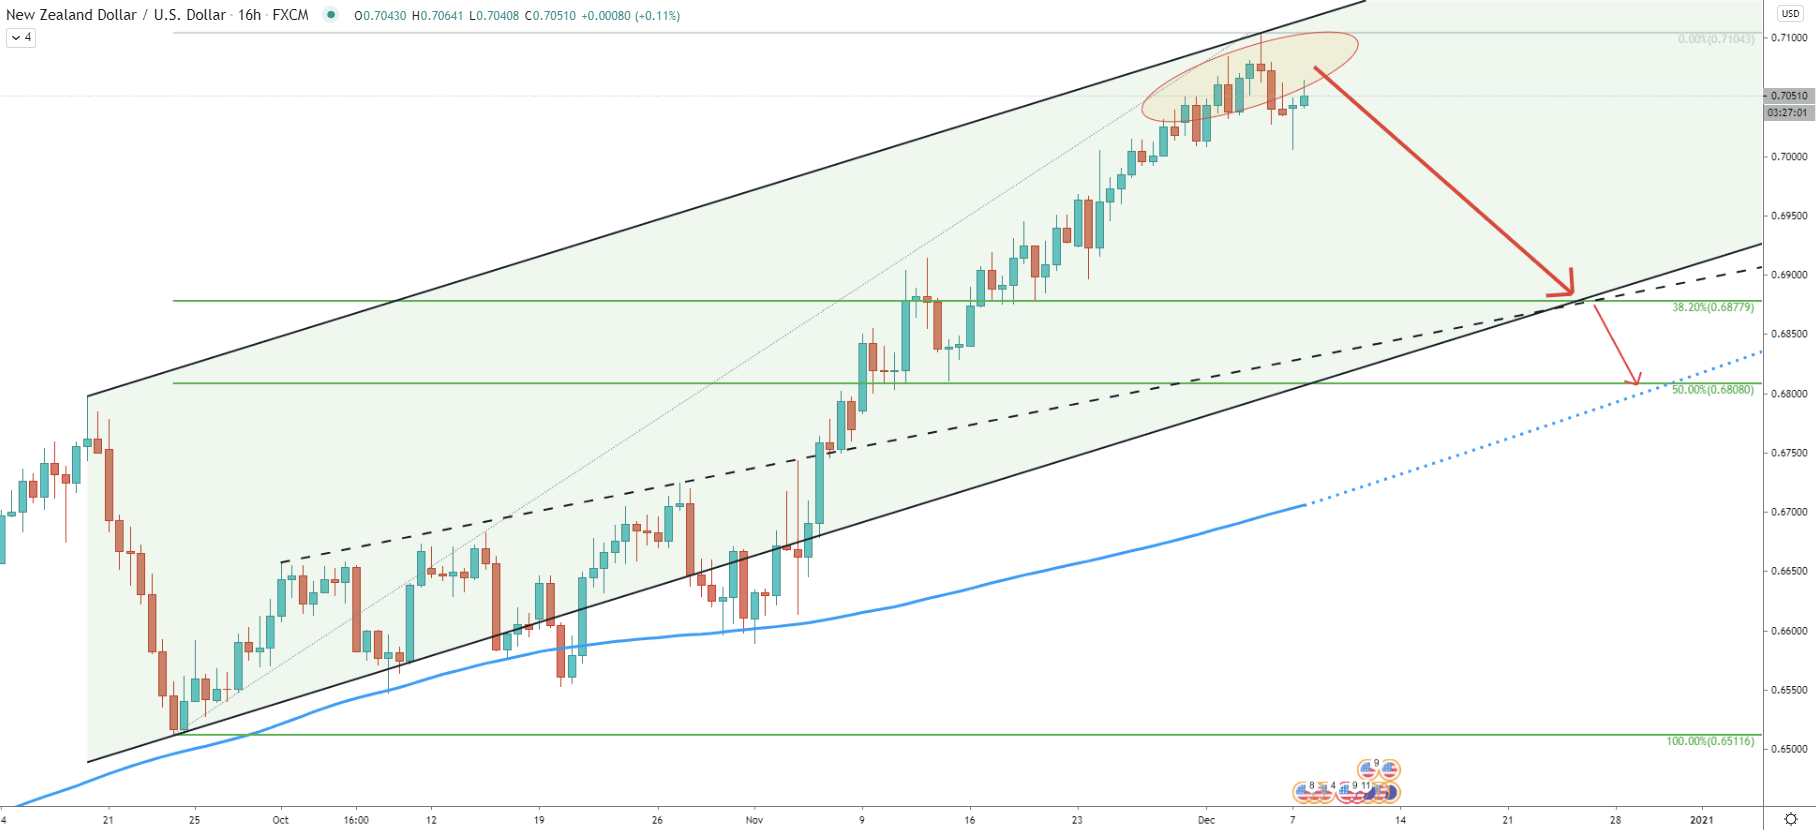
While NZD/USD tested the 0.7104 high, it rejected cleanly the resistance trendline, and RSI formed a bearish divergence. The following price action resulted in NZD/USD falling below the 200 EMA, which yet again implies that the trend could be changing.
Maybe it will not change fast, and consolidation will take place. As can be seen on the chart, the price could be stuck between 0.7060 resistance and 0.7100 support area for the time being. But considering the fact that 200 EMA was cleanly rejected at first, and then broken to the downside, the probability is in favor of a downtrend. Besides, the price is near the top of the range and could be very attractive for counter-trend traders.
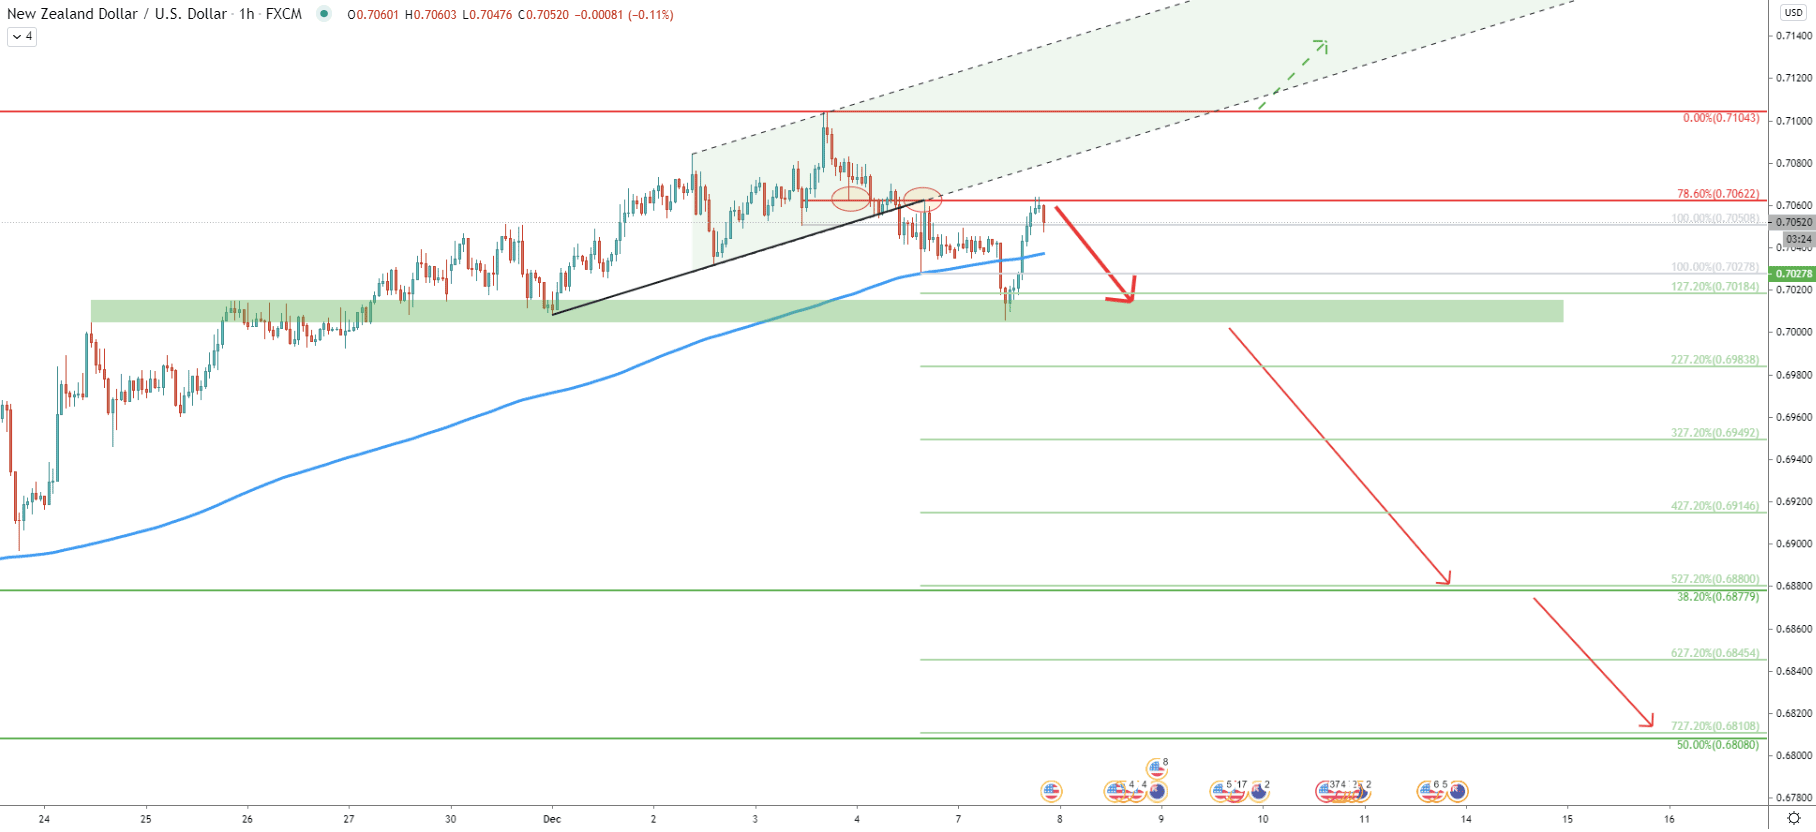
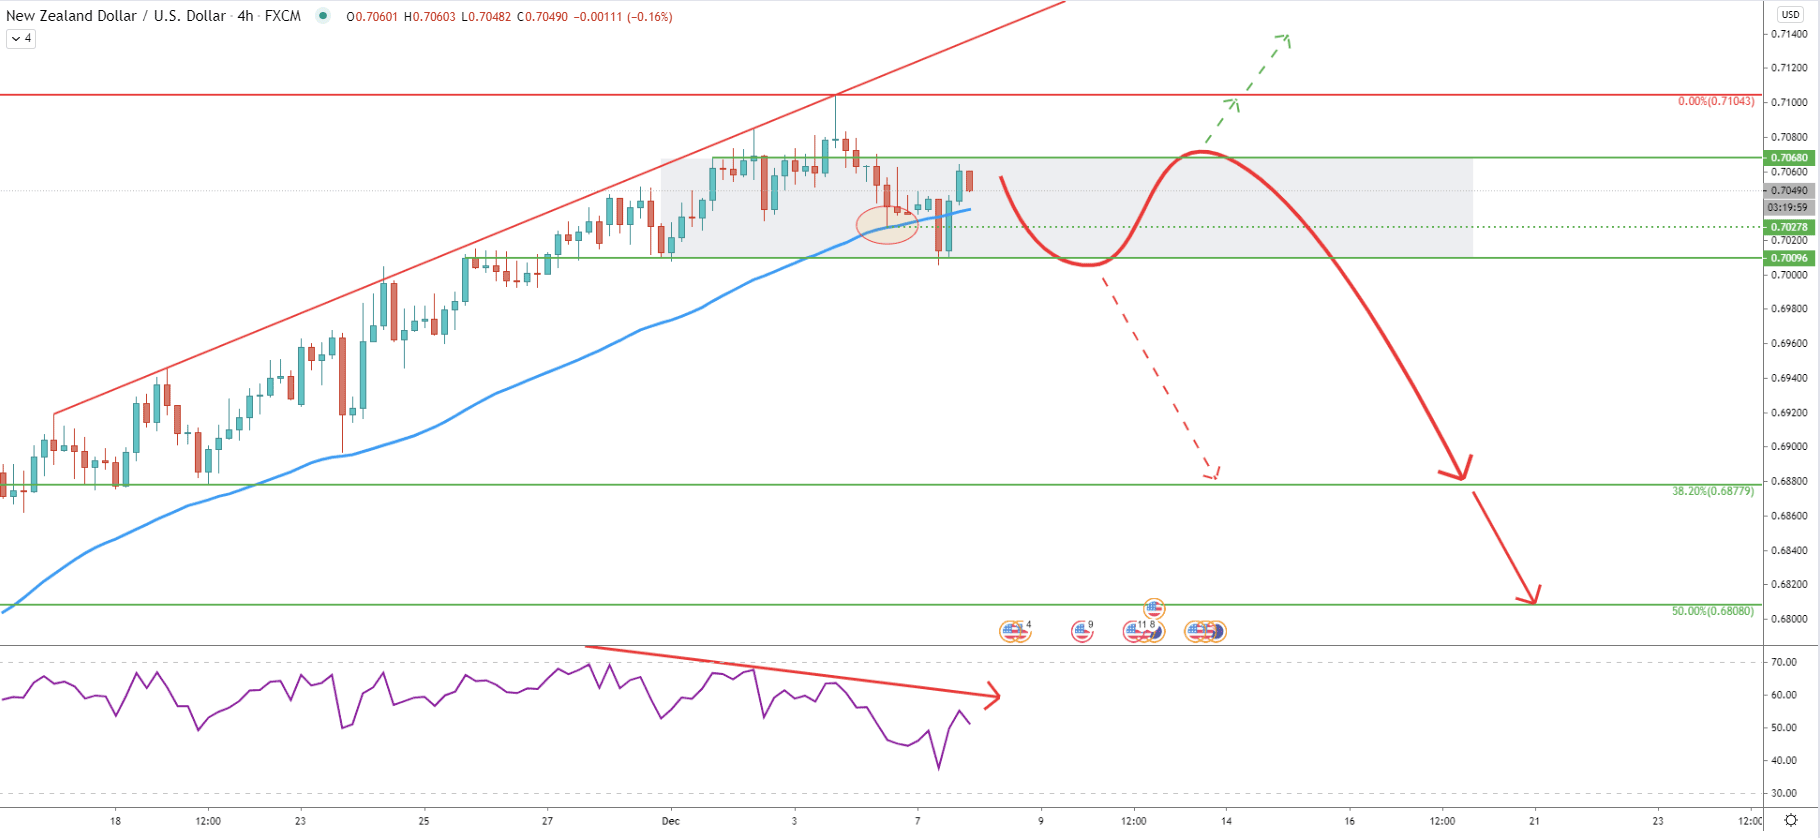
Finally comes an hourly chart, where NZD/USD cleanly bounced off the 0.72062 level, which is a 78.6% Fibonacci retracement. Then it produced a new lower low and broke below the 200 EMA. Right now, NZD/USD correct up, towards the 78.6% Fibonacci resistance, which is likely to trigger a downside move as long as this resistance holds.
Based on Fibonacci, applied to the corrective move up, where 78.6% retracement level was rejected, there are multiple minor support levels to watch. Nonetheless, there seem to be only two major target levels for sellers. These are 0.6878, corresponding to 38.2% and 527.2% Fibs, and 0.6808, corresponding to 50% and 727.2% Fibs.
While the NZD/USD trend is strongly bullish, the risk of the downside correction is increasing. This could result in a 150 - 250 pip downside move, as long as recently produced high/resistance at 0.7104 is being respected.
As per the weekly chart, there are two key support levels, each of which might. be the final downside target. These are 0.6878 and 0.6808
As per the hourly chart, a break above the current resistance at 0.7062, is likely to result in a further uptrend or an extended consolidation phase. However, only daily break and close above the 0.7104 resistance will invalidate the bearish scenario and the NZD/USD long-term uptrend can be expected to continue.
Support: 0.7000, 0.6878, 0.6808
Resistance: 0.7038, 0.7068, 0.7104