
Published: August 24th, 2020
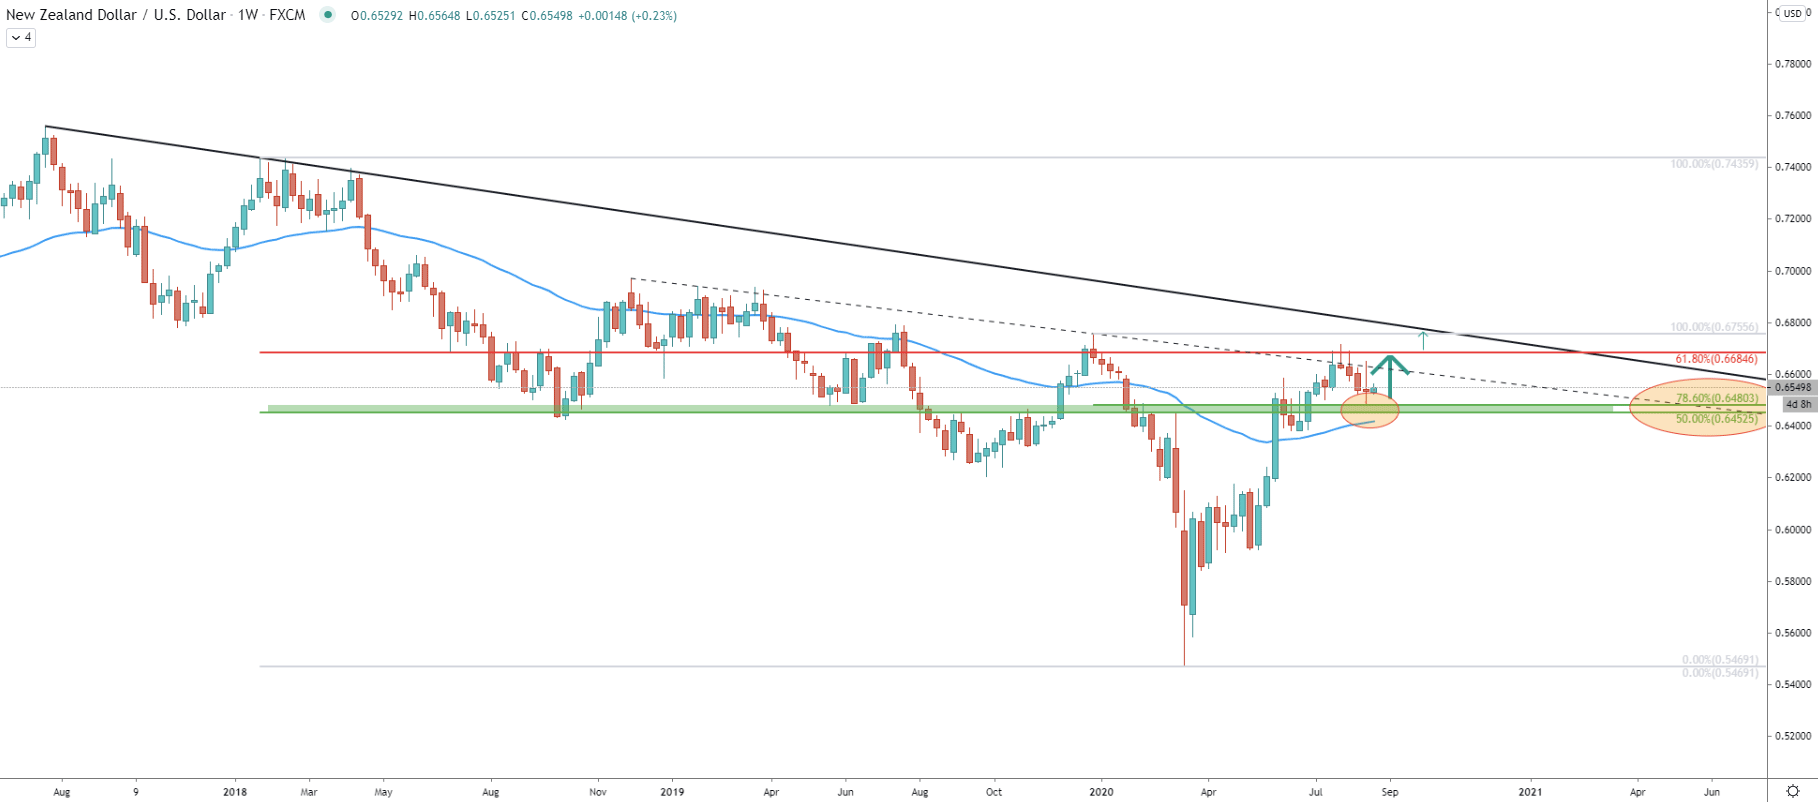
The overall long term trend of the NZD/USD remains bearish and the price is still below the downtrend trendline. Nonetheless, there still is medium-term upside potential, considering this is a weekly chart. We can observe the support and resistance levels based on the Fibonacci retracement indicator. The support is located at 78.6% Fibs applied to the last wave down. The resistance is located at 61.8% Fibs, applied through the second point of the downtrend trendline and the bottom tested in March this year.
It shows that price could be stuck between the support and resistance and a long term consolidation phase can be expected. Although if NZD/USD will manage to break above the 0.6684 resistance and the long term downtrend trendline, the picture will become much more bullish in the long run.
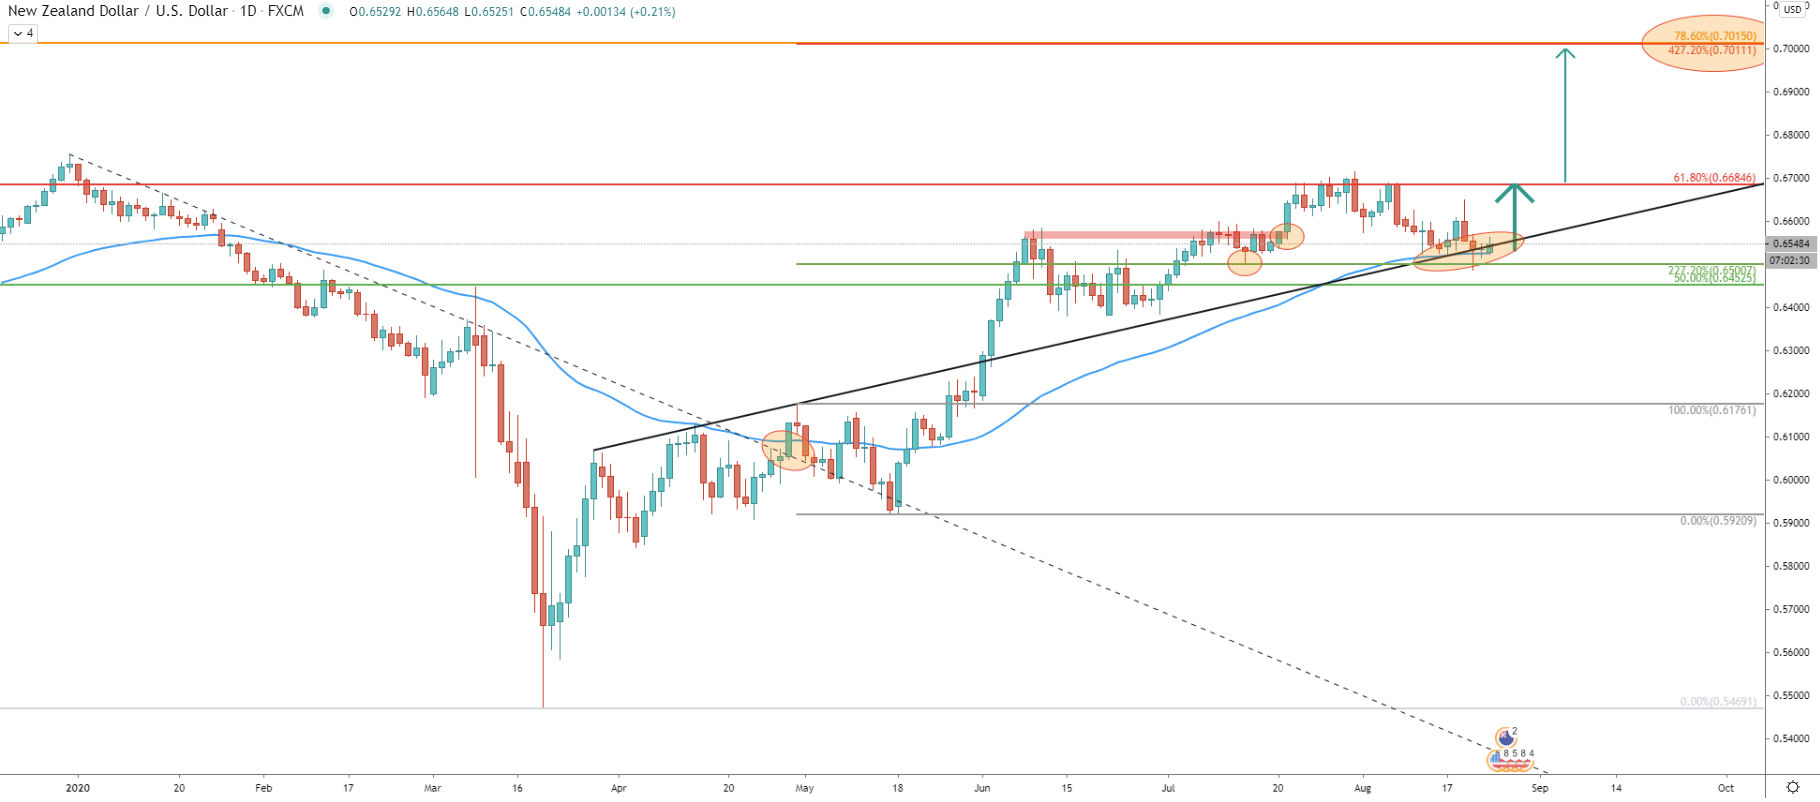
Few trading days ago NZD/USD rejected the average-price uptrend trendline, which might initiate the next wave up. Prior to that, the 0.6600 resistance area was broken and the pair has reached 61.8% resistance. NZD/USD could be about to form a triangle pattern while moving up towards the nearest resistance once again.
When/if 0.6684 resistance is will get broken, NZD/USD with high probability can rise towards the 0.7010 upside target confirmed by two Fibonacci retracement levels. First is the 78.6% Fibs applied to the overall downtrend and second is 427.2% Fibs applied to the corrective wave down after the downtrend trendline and 50 Exponential Moving Average were broken. This Fibs also shows that 227.2% retracement at 0.6500 previously acted as the support and was rejected cleanly. And yet again, we see the rejection of this support along with the 50 EMA and the average-price uptrend trendline.
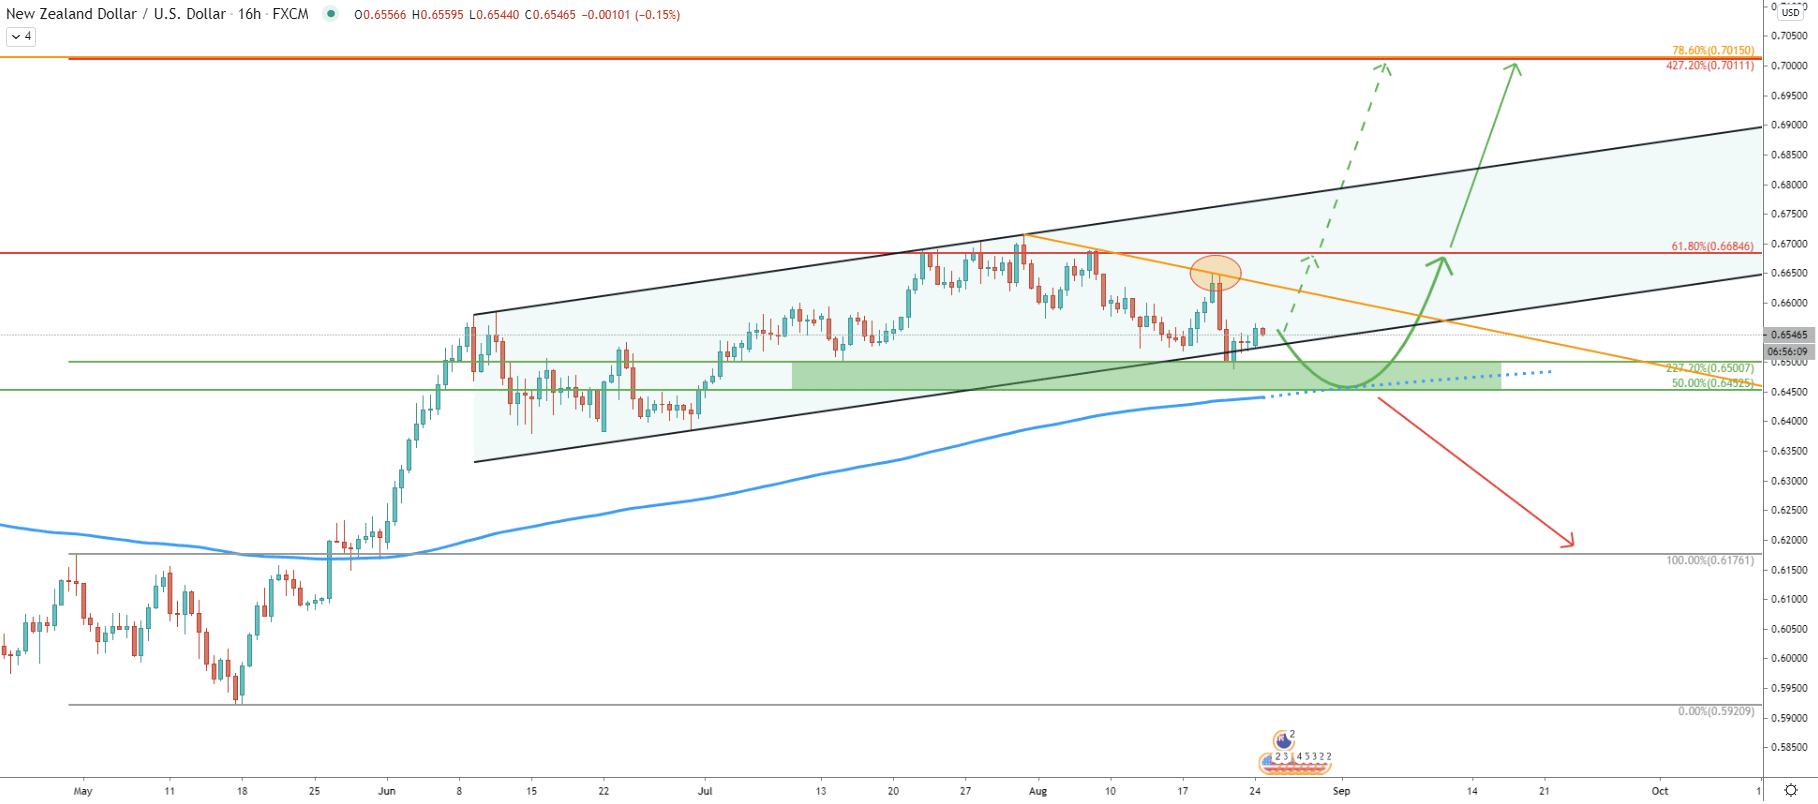
NZD/USD is trading near the bottom of the ascending channel and while it certainly looks like it has been broken, the price failed to break below the 227.2% Fibonacci support at 0.6500 psychological level. But at the same time, considering the recent rejection of the downtrend trendline, there could be yet another attempt to break below this support. Spikes down can reach 50% Fibs at 0.6452, which also corresponds to the 200 EMA. But in regard to the downside risk, only daily break and close below 0.6452 support and the 200 EMA can invalidate the expected continuation of the uptrend.
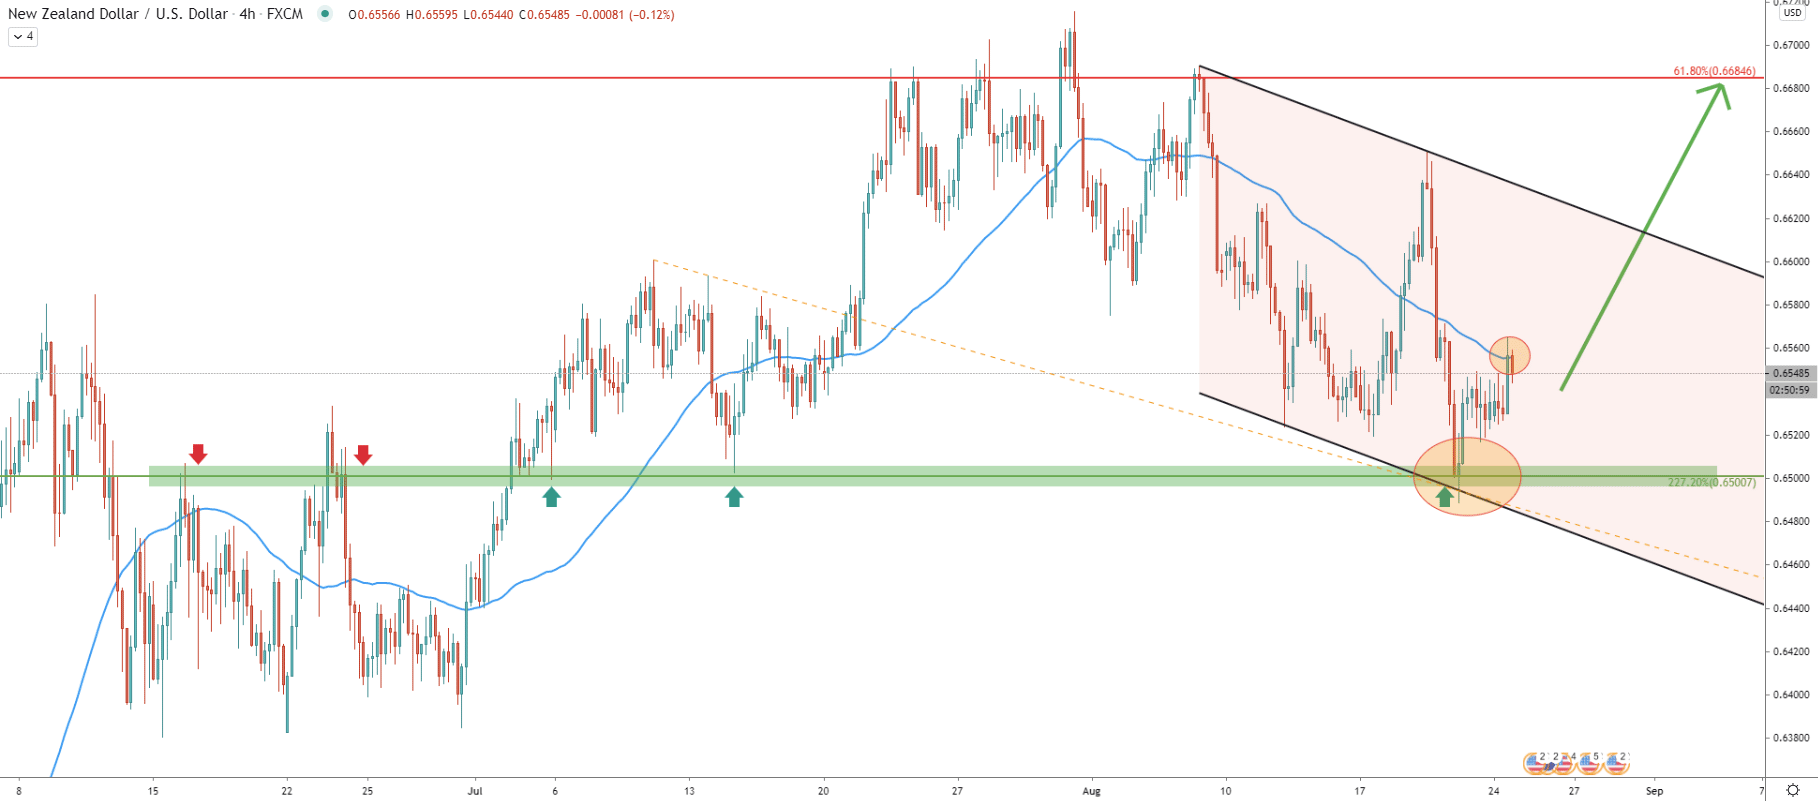
On the 4-hour chart is clearly visible that NZD/USD is right at the key demand zone, which is near 0.6500 level and previously has acted as the support as well as resistance. Besides, the price has reached and rejected the bottom of the descending channel after which broke above the 50 EMA.
It does look like the downside correction on lower timeframes could have come to an end and now trend should be turning bullish. But this is only if the price will manage to hold the support area, while spikes below on the daily chart can still be expected.
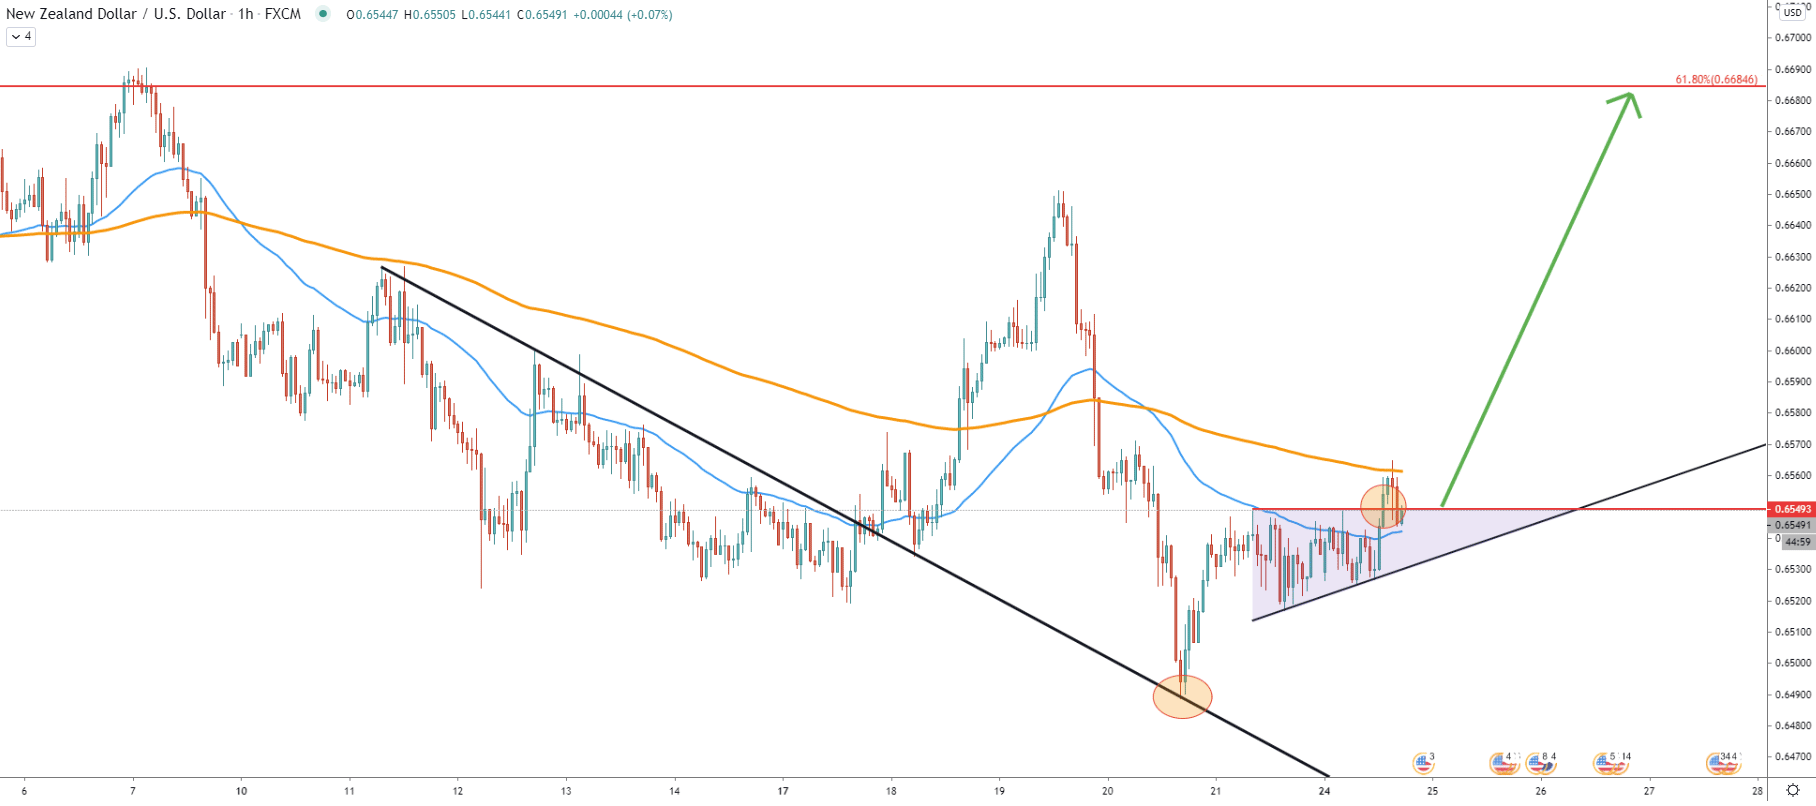
Here NZD/USD has rejected the average-prie downtrend trendline, went up, and started to form the triangle pattern. Today price broke above the triangle but rejected the 200 EMA. For the short period of time NZD/USD can continue to trade between the 50 EMA support and 200 EMA resistance. However, the price action is already turning strongly in favor of the bull market and perhaps the final confirmation of the uptrend will be an hourly break and close above today’s’ high, which was printed at 0.6565.
NZD/USD long term upside correctional move is expected to continue, to test the previous resistance area near 0.6685. But the upside correction could be turning into a long term uptrend if the resistance will be broken with confidence. For now, the buying opportunity could have been presented, and buying pressure is likely to increase throughout this week.
As per the 16-hour chart, there are two major resistance levels to watch. The first is 0.6685, confirmed by 61.8% Fibs. The second resistance is much further away and is located at 0.7010, confirmed by 78.6% and 427.2% Fibs.
As per the 16-hour chart, only break and close below the 0.6452 support will invalidate bullish outlook. If such scenario will take place, the long term downtrend of the NZD/USD will have a much higher probability compared to the uptrend.
Support: 0.6500, 0.6452
Resistance: 0.6565, 0.6685