
Published: April 28th, 2020
In this analysis, we will continue the JPY topic, where previously we were emphasizing the JPY domination across the board. Not only the NZD/JPY pair seem to be moving down, but also many other major fiat currencies are struggling to outperform JPY.
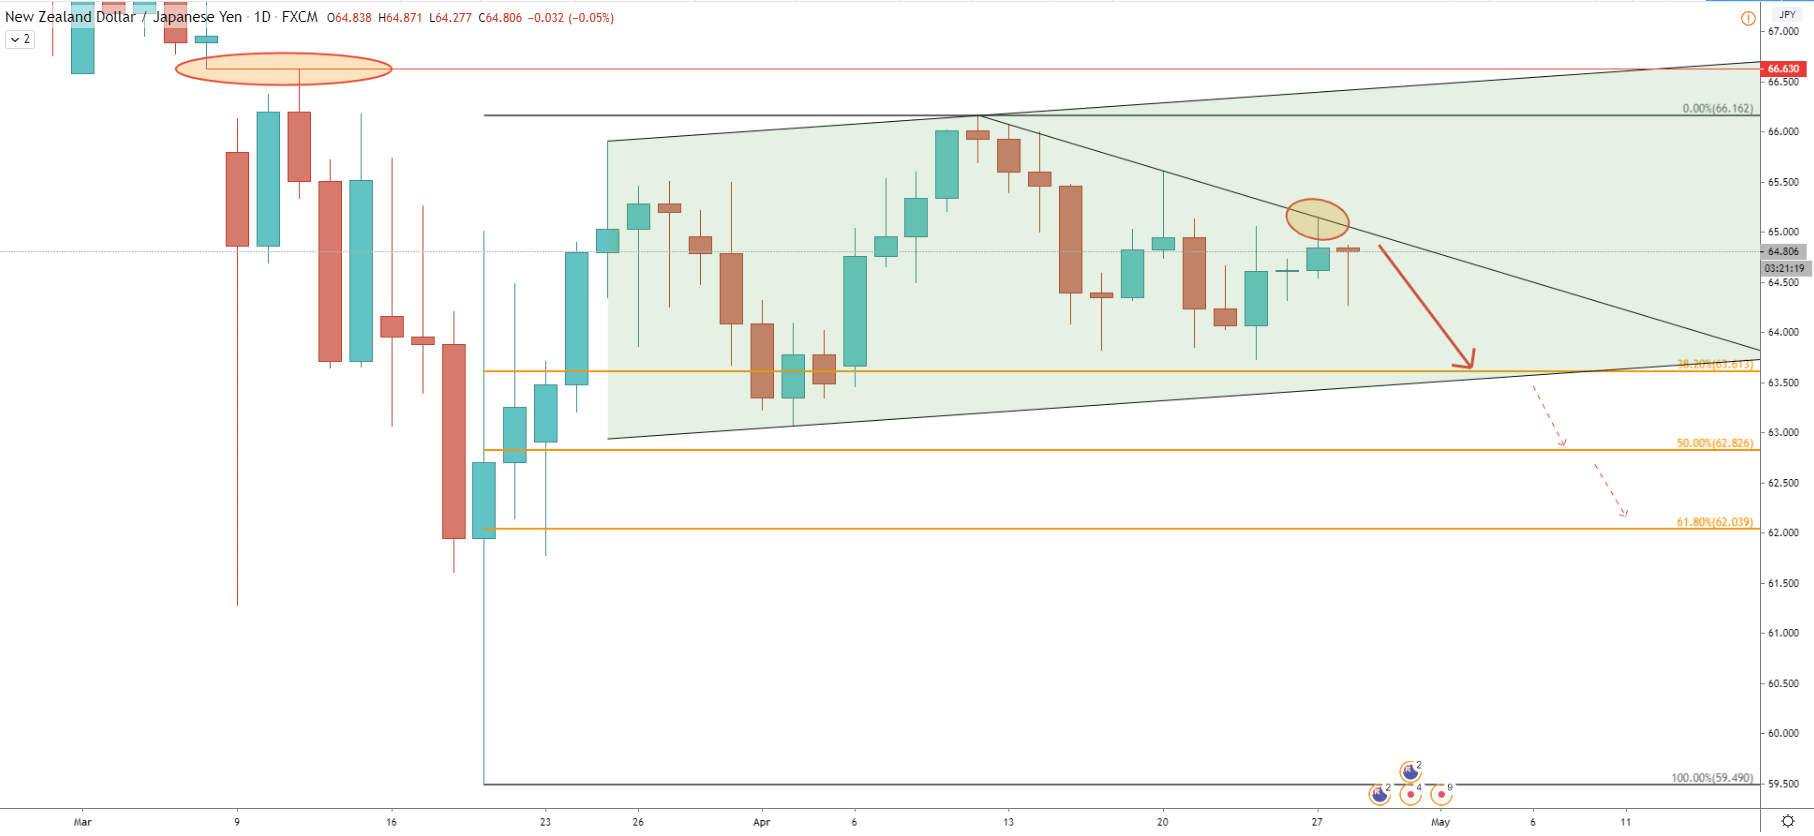
We will start with a Daily chart, where we can see NZD/JPY moving within the ascending channel. Although, up until now, pair failed to test the lower trendline of the channel and perhaps this could be the first downside target in the coming days. We can see that the downtrend trendline has been rejected and based on the Fibonacci retracement indicator nearest target is seen at 63.61, which clearly corresponds to the lower trendline of the channel. One of the reasons why NZD/JPY can be expected to move lower is the closure of the price gap, formed between the 6-9 of May. This could mean that price is ready to continue a long term downtrend with the first downside target at 63.61. But there are also other Fibonacci based targets, which can be reached if the ascending channel will be broken. The second target is seen at 50% Fibs that is 62.82, while the third target is based at 61.8% Fibs, which is 62.00.
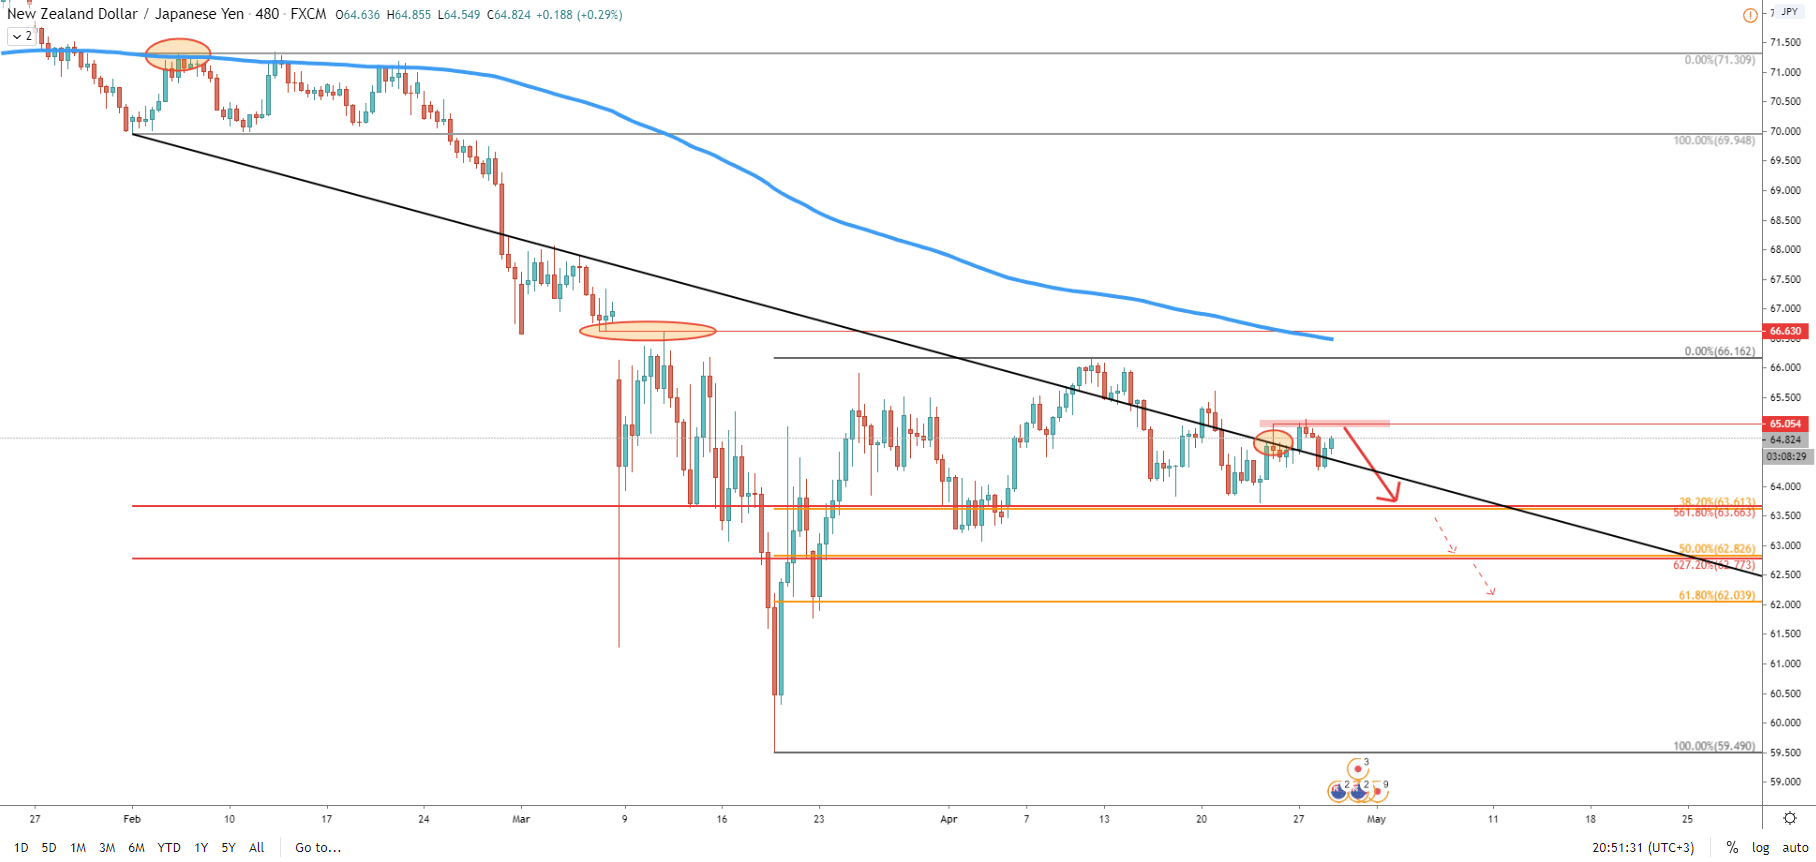
On the 8H chart, the price has rejected the average price trendline at 64.75. Price managed to produce a spike above, hitting 65.05 high, although it failed to close higher. This makes 65.00 psychological level key support considering a medium and long term price action. As long as 8H close remains below this price, NZD/JPY should be expected to start moving lower towards one of the Fibonacci support levels. It is worth mentioning that 2 of the previously discussed downside targets correspond to other Fib levels. Specifically to the 561.8% and 627.2% Fibs applied to the corrective wave up after breaking the 200 Exponential Moving Average.
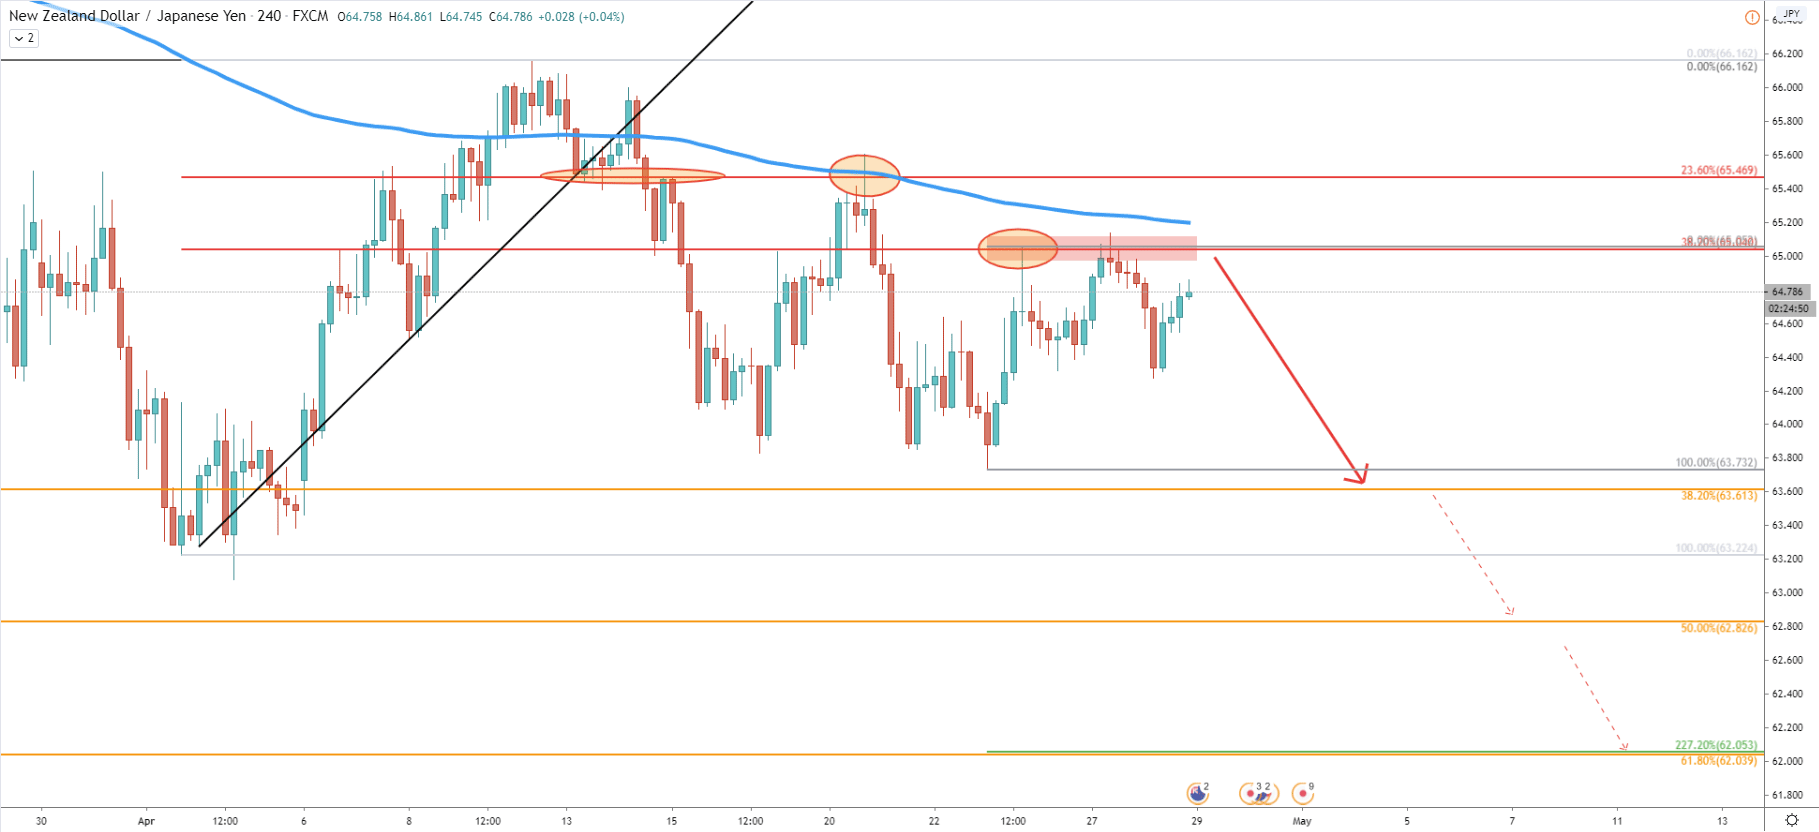
Moving on to the most common timeframe, the 4h chart. Here we can see that 23.6% Fibs at 65.47 and then 38.2% Fibs at 65.05 were rejected. This is quite a consistent bounce off resistance levels, which also suggests the continuation of the downtrend. Besides, the price broke below the 200 EMA and then rejected it, as it was acting as the resistance. Finally, the third downside target at 62.05 corresponds to the 227.2% Fibonacci retracement level applied to the most recent corrective wave up.
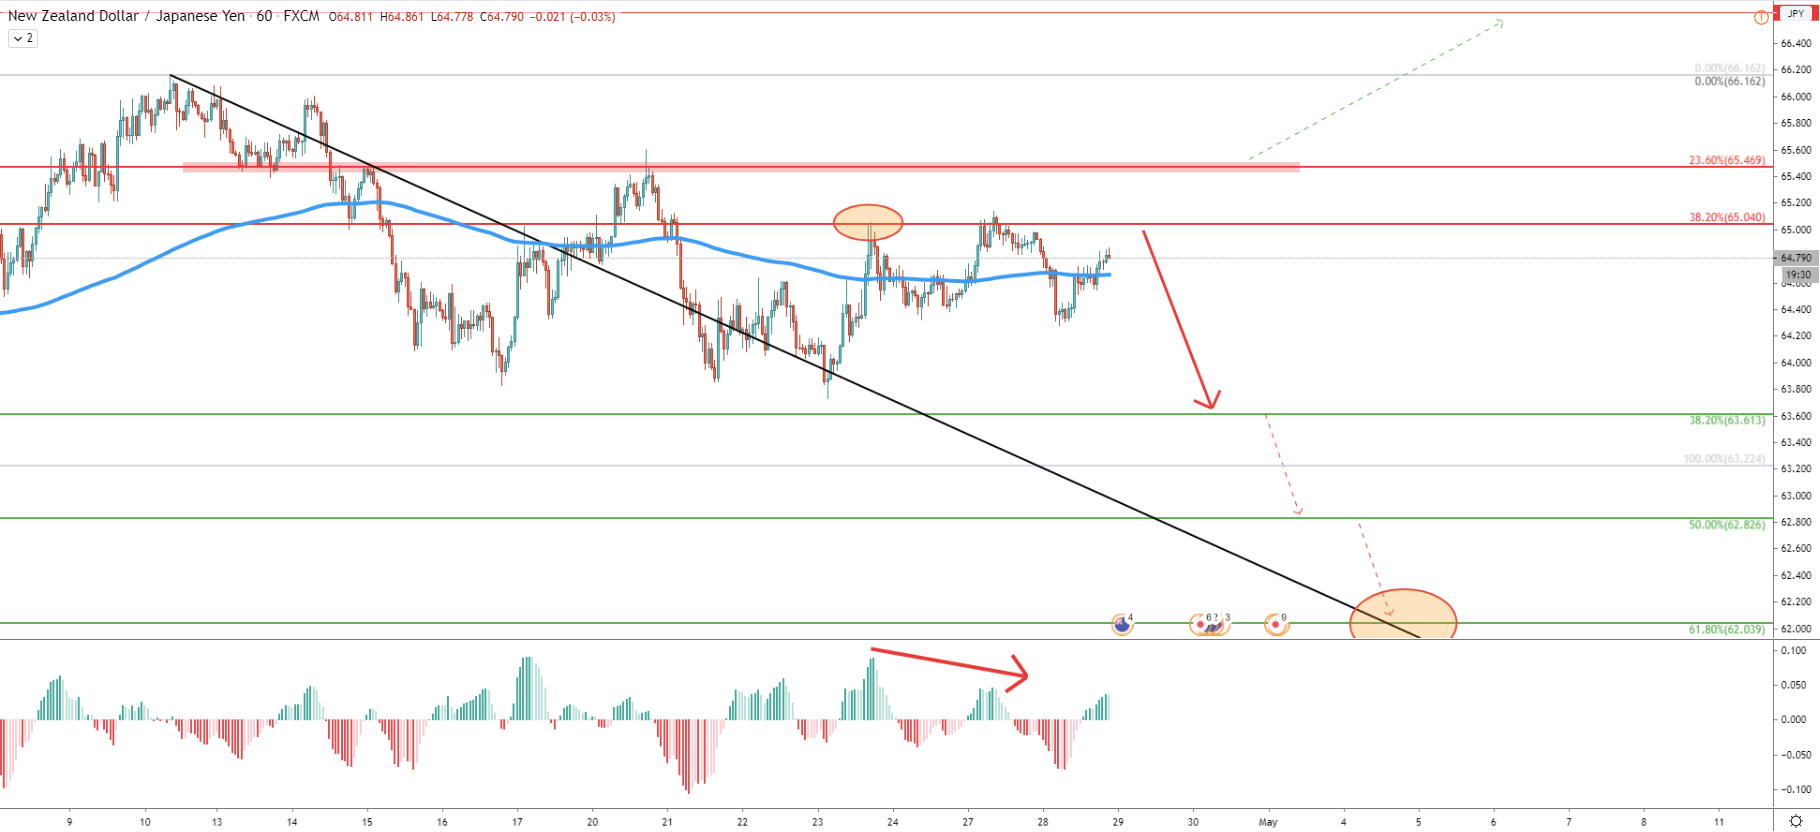
The 1H chart shows how cleanly the 38.2% Fibs retracement level was rejected and up until now, NZD/JPY is struggling to produce a clean break and close above the 200 EMA. Also, after rejecting the 65.04 resistance level, MACD has produced a bearish divergence, after which price went down and broke below the 200 EMA. All-in-all, everything is pointing out to the continuation of the downtrend, especially continuous print of the lowers lows and lower highs. On this chart, we can also see the final downside target at 62.00 corresponding to the average price downtrend trendline.
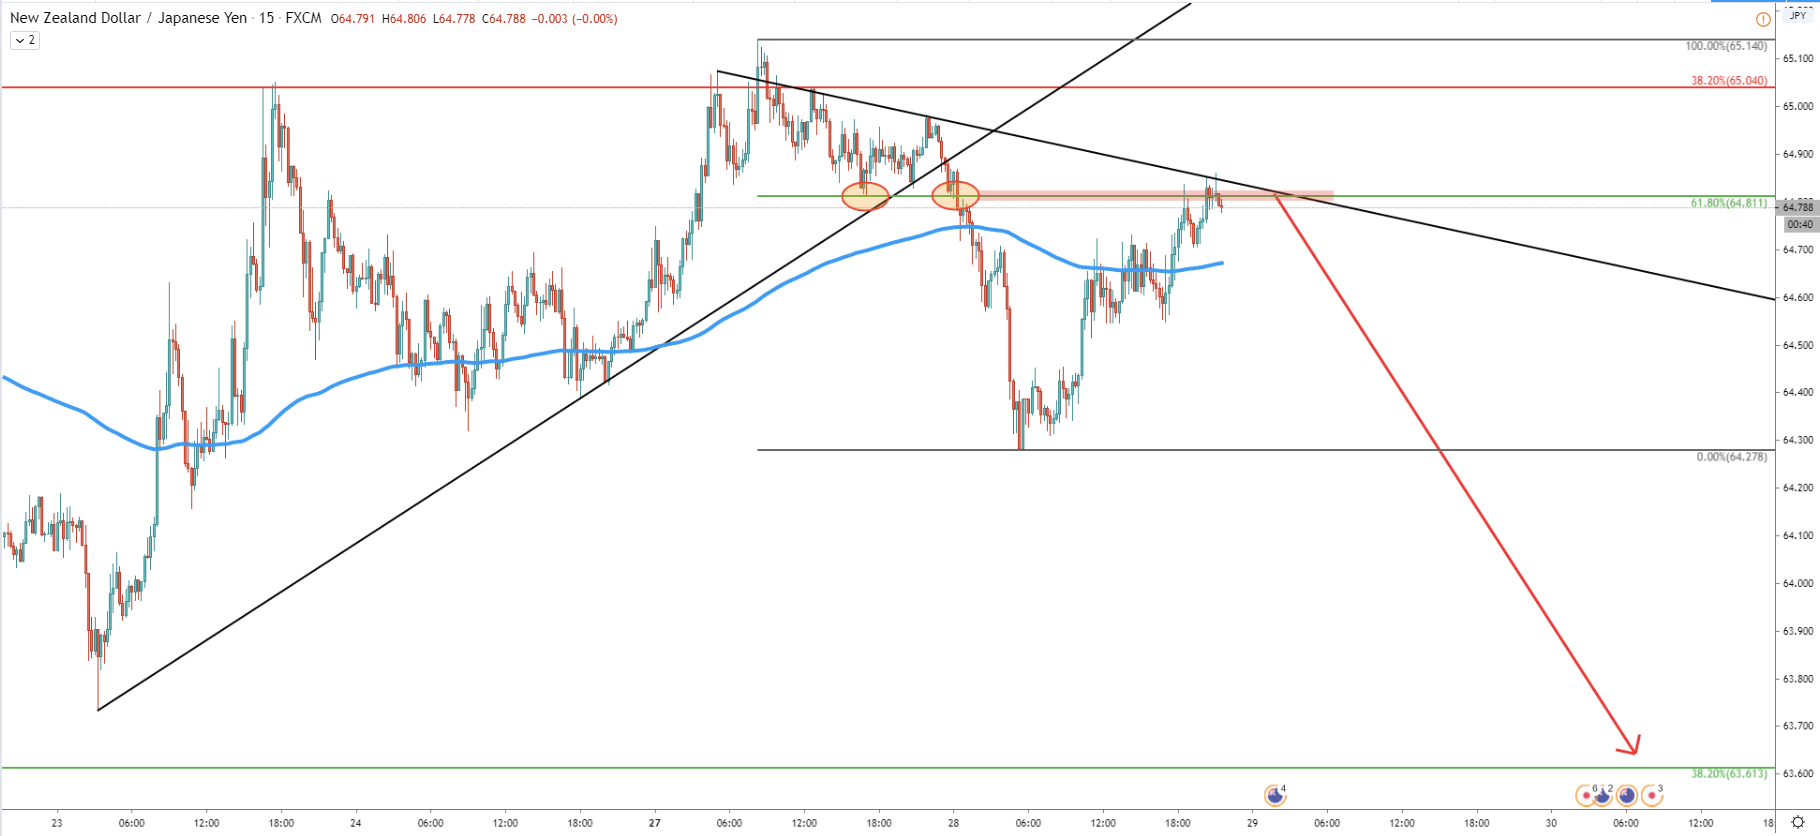
On the 15m chart price broke below the uptrend trendline and the 200 EMA. Then, NZD/JPY corrected up and found the resistance at 61.8% Fibs, which is 64.81 level. Price attempted to break higher, although it failed to close above this level with confidence. Finally, the downtrend trendline has been rejected and we might see the very beginning of the downtrend continuation in the mid to long term.
On multiple timeframes, NZD/JPY is showing signs of weakness while multiple Fibonacci resistance levels are being rejected. Downtrend trendlines also are being rejected while the uptrend trendlines are being broken. For now, the bearish scenario is extremely high and the pair could drop as much as 300 pips from the current price.
Overall, there are 2 downside targets, which correspond to the Fibonacci retracement levels as per the Daily chart. First being 38.2% Fibs at 63.61, second being 50% Fibs at 62.82 and the third one is 61.8% Fibs at 62.03.
Right now, the key resistance level is seen at 65.10, which is the April 27 high. If this level will be broken, with a daily close above it, NZD/JPY bearish scenario will be invalidated and the price is highly likely to start moving up in the medium term.
Support: 63.61, 62.82, 92.03
Resistance: 65.10


