
Published: July 10th, 2020
The financial crisis has begun at the beginning of 2020 when most currency pairs went through a very difficult time. The trading volume was staggering and price volatility was far above the average. During that period NZD/JPY dropped by nearly 20%, which was equivalent to 1400 pips. Since March 16 the pair has been moving up strongly and until this point recovered 18%. Will the recovery continue? Let’s try to find out in this analysis.
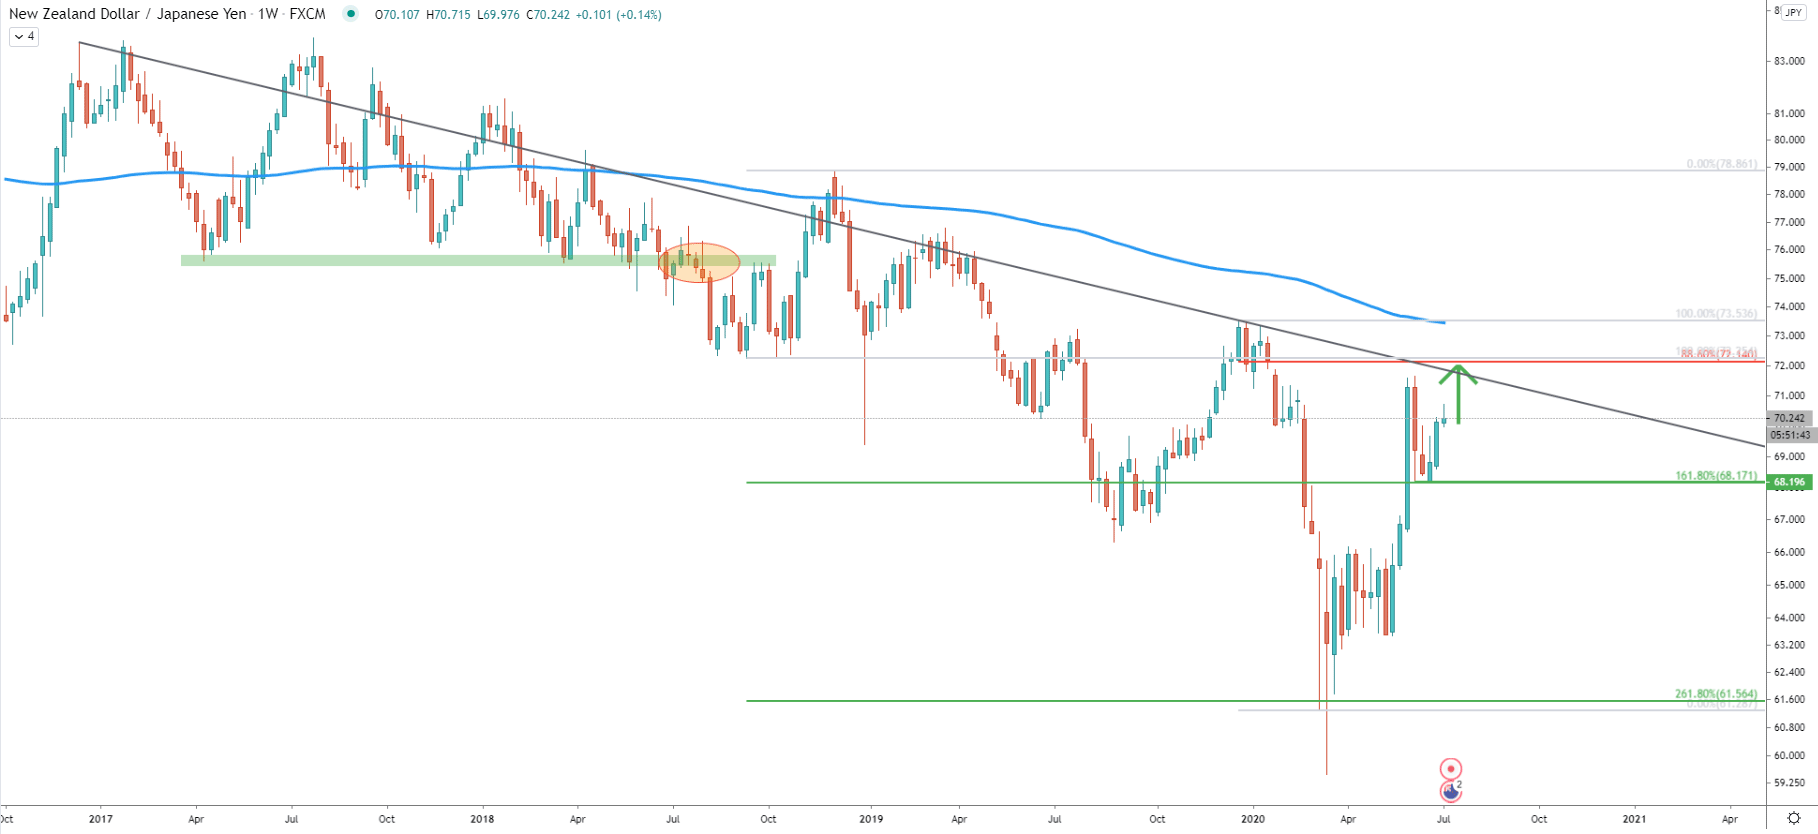
We have applied two Fibonacci retracement indicators to the Weekly chart. First to the overall downtrend, after price broke below the major support area near 76.00. A couple of weeks ago, the 50% retracement level at 68.17 was rejected cleanly and the price started to move up. Bulls defended this support very well and perhaps price could be heading towards a new higher high. The resistance is seen at the 88.6% retracement level from the second Fibs, applied to the last wave down, which also corresponds to the long term downtrend.
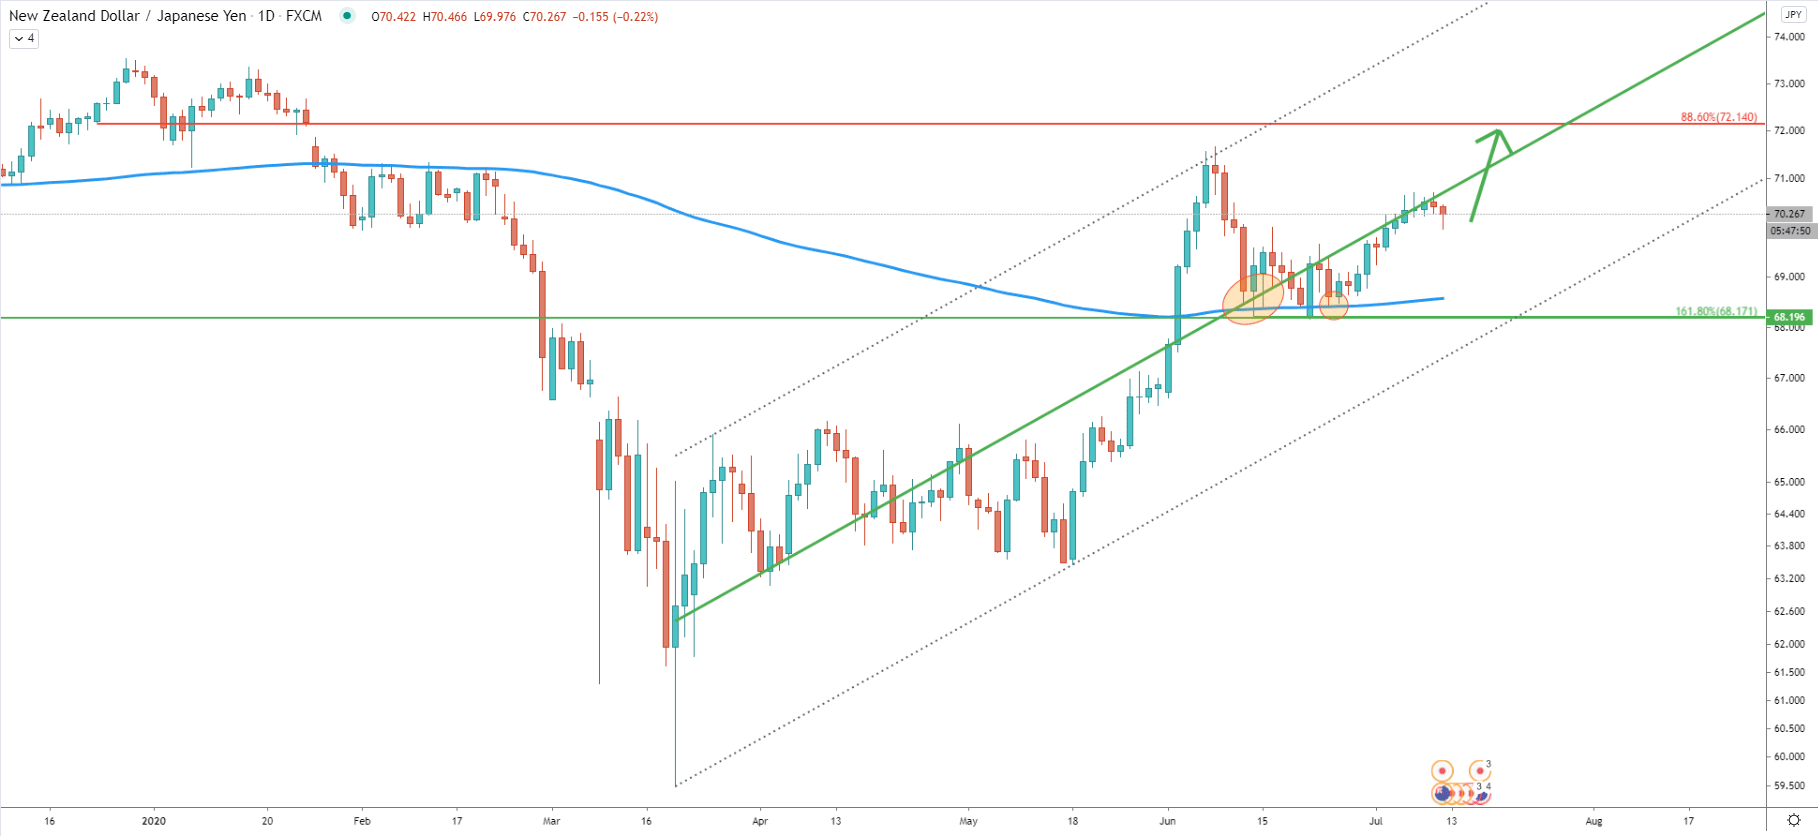
On the Daily chart price is moving within the ascending channel. Back on June 12, NZD/JPY rejected the 200 Exponential Moving Average as well as the middle trendline of the channel. The double bottom has been produced near 68.20 support, after which price started to print higher highs and higher lows. All-in-all, it shows that the uptrend remains still valid.

On the 4-hour timeframe, it is very clear that NZD/JPY formed and then broke above the triangle pattern. The breakout occurred on the June 30, after which price has reached the 70.71 high. While the price has been rising it marked two support levels. The first is 69.25, which is the low produced after breaking above the downtrend trendline. The second is 69.86, which is the 50% Fibonacci retracement level, rejected cleanly. In the near future, these levels might play an important role, but that if the price will attempt to correct further down.
As long as NZD/JPY remains above 69.86, further price increase should be expected. On this chart, the previously mentioned resistance at 72.14 is also confirmed by 527.2% Fibs applied to the correction down after breaking the triangle. This is a potential 200 pip increase that might start in the beginning of the next week.
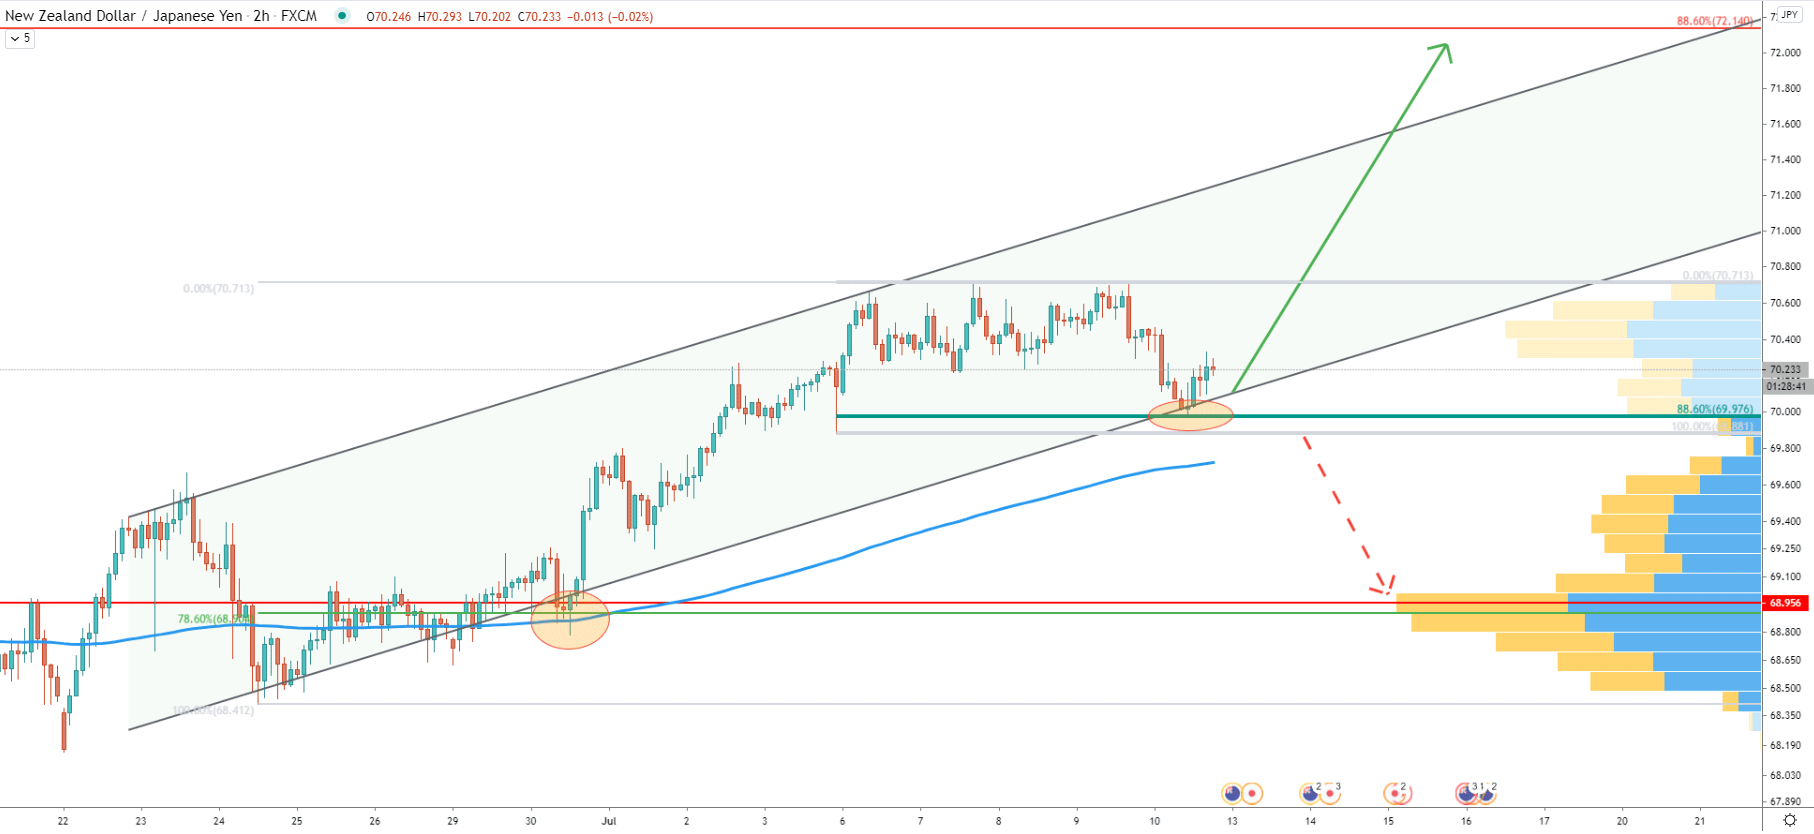
Same as on the daily chart, on the 2-hour timeframe, price is moving within the ascending channel. Today NZD/JPY has reached the bottom of the channel and cleanly rejected 88.6% Fibonacci retracement level at 69.97. It seems that 70.00 psychological price is providing extremely strong support in the short, which currently is valid.
If there will be a daily break and close below 70.00, bulls might start losing the battle to bears, and as a result, the price can easily start moving gown. On this chart, we can see the strong supply area near 69.00, which is confirmed by the Volume Profile indicator as well as 78.6% Fibonacci retracement level. This is the nearest downside target in case of a downtrend.
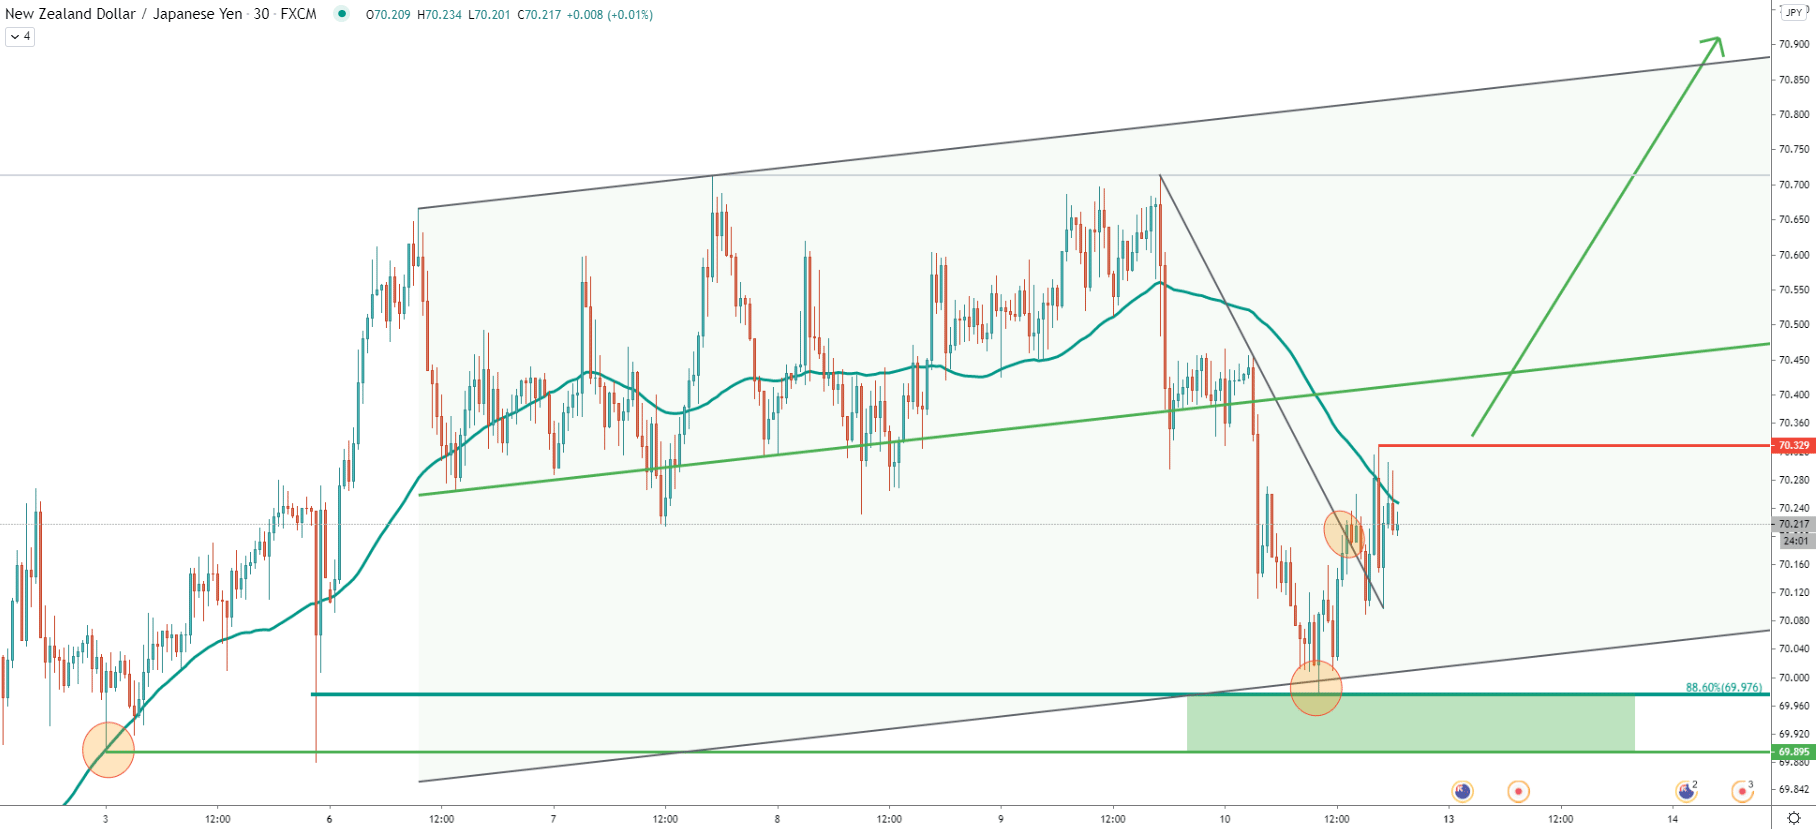
On the 30-minute chart, NZD/JPY has reached the lower trendline of the extended descending channel, where 88.6% Fibs was rejected. The previous bounce off the 50 EMA was on July 3, when the price tested 69.89 low. This could mean that the support area is between 69.90 and 70.00, and obviously, as long as price remains in or above this zone, NZD/JPY will remain attractive for buyers.
On the other hand, price is currently rejecting the 50 EMA, and perhaps the confirmation of the upcoming wave up should be the break and close above the 70.33 level, which is the most recent high.
NZD/JPY upside recovery continues and the price might rise by another 200 pips very fast. Although for this scenario it must remain above 70.00 psychological support.
As per the Weekly and 4-hour charts, the key resistance and the potential upside target is located at 72.14 and confirmed by two Fibonacci retracement levels, 88.6%, and 527.2%.
Daily break and close below 70.00 support will invalidate bullish outlook and NZD/JPY might start trending down. In this case, the nearest strong support is at 69.00, but if the pair will move below, a stronger downtrend might take place.
Support: 70.00, 69.25, 68.60
Resistance: 70.33, 70.71, 72.14