
Published: June 29th, 2020
Throughout the past three weeks, we have been sharing analyses on multiple Australian Dollar related currency pairs. We all know how strongly it correlates to the New Zealand Dollar and therefore will be sharing analysis on NZD/JPY. Perhaps this week there will be multiple analyses on various NZD pairs, but at this stage, the NZD/JPY looks very attractive in terms of the short to a medium-term buying opportunity. Obviously there are multiple factors to support such a claim, and now we will go through all of them while analyzing 4 different timeframes on.
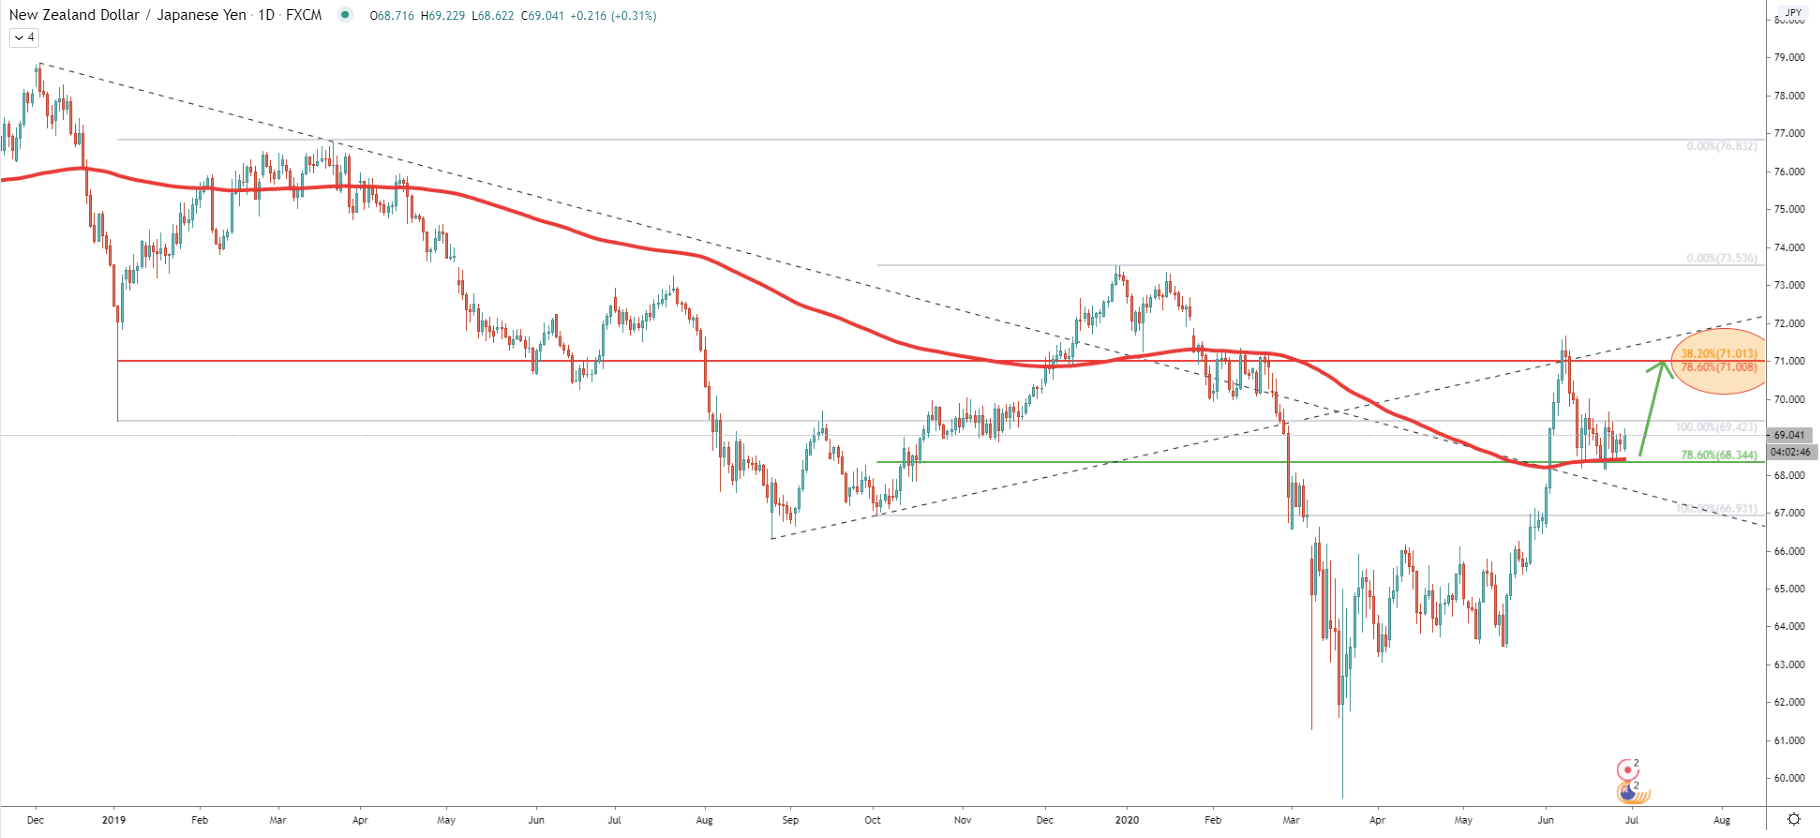
There was a consistent downtrend going on since the end of 2018 where the NZD/JPY exchange rate has reduced by 24.56% after it tested the 59.49 low on March 19. After reaching this low, the price has been consolidating under extreme volatility, but then managed to move up quite substantially. NZD/JPY broke above the downtrend trendline as well as 200 Exponential Moving Average simultaneously. This happened on June 2, after which price tested the 71.66 high.
All-in-all it was a very strong pullback up by the NZD/JPY where price managed to recover 20.47% in just 81 days. But as we can see, the correction down followed, and the price drop was stopped by the EMA which acts as the strong support, along with the 78.6% Fibonacci retracement level at 68.34. This Fib was applied through the second point used to draw the uptrend trendline to the 73.53 high. Yet another Fibs was applied through the second point of the downtrend trendline and combined they show the potential upside target.
It is located at 71.00, which might be the key psychological long term resistance for the NZD/JPY, and this level is confirmed by 38.2% and 78.6% Fibs. While the price is currently at the support and remains above the EMA, we can expect at least one more wave to the downside towards the key resistance. It means that there is still potential for at least 200 pips growth.
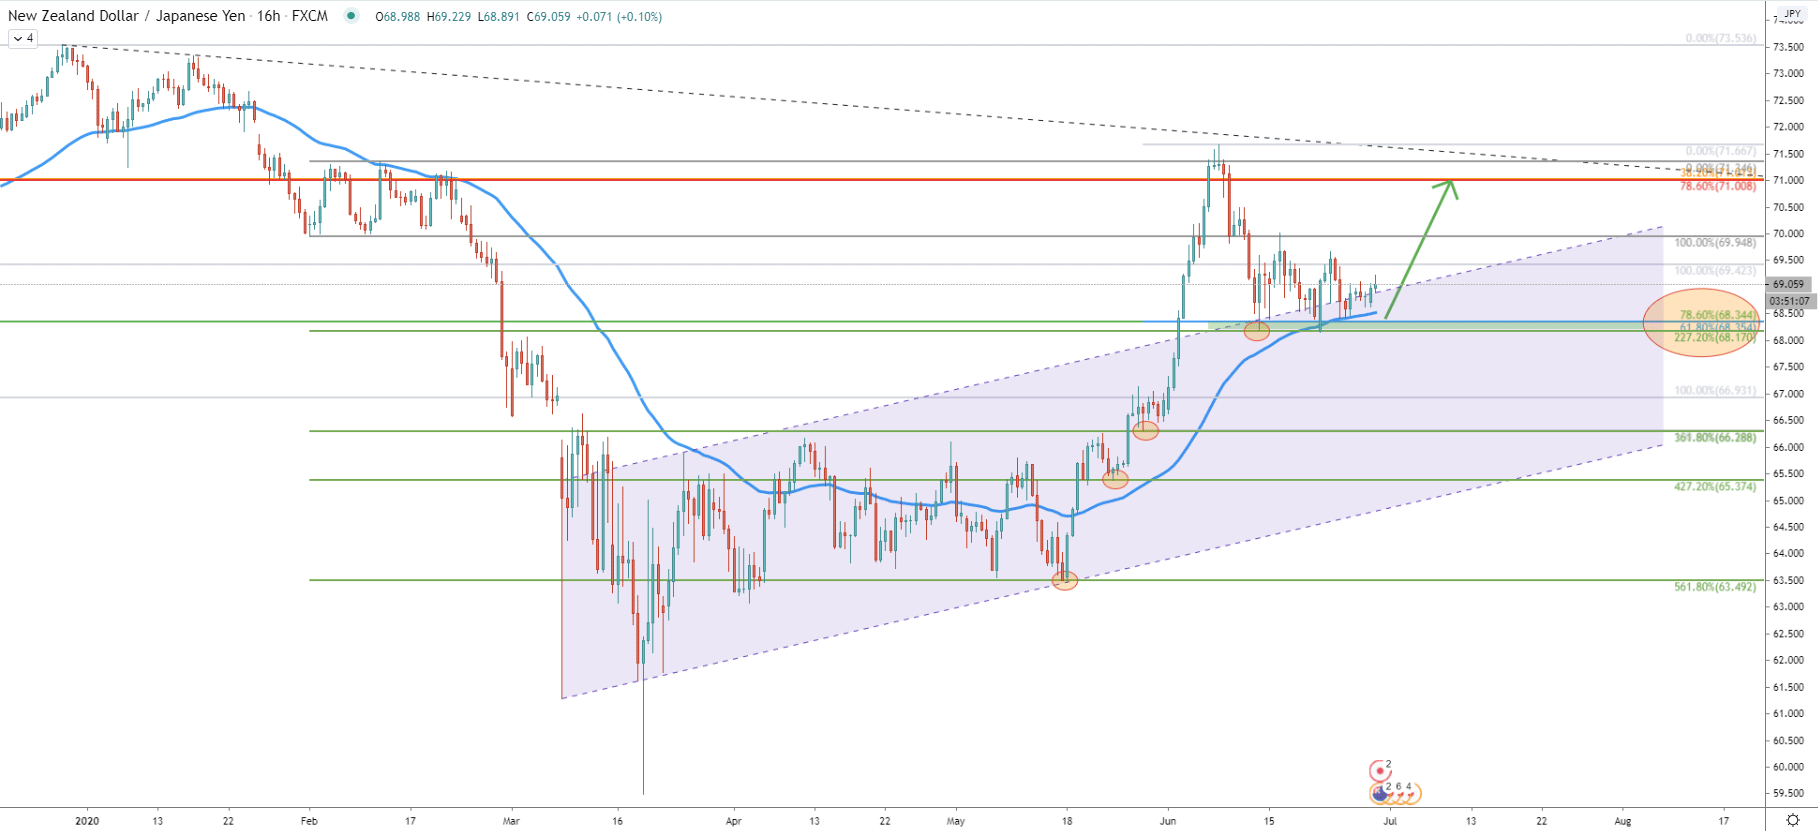
Moving on to the 16-hour chart, price broke above the descending channel, suggesting further growth potential. Fibonacci retracement indicator was applied to the first corrective wave up after breaking below the 50 Simple Moving Average. It gives very important support levels, such as 561.8% at 63.49, 427.2% at 65.37, 361.8% at 66.28 and 227.2% at 68.17.
The most important fact is the very consistent rejection of each of these support levels. One by one they all were cleanly rejected and price continued to move up. The most recent rejection of the 68.17 occurred on June 12, after which price started to consolidate. But then we can see a rejection of the 50 SMA almost exactly corresponding to the 68.17 support level. Overall, this makes it key support and as long as daily close remains above, NZD/JPY must be expected to move higher. And another important fact is the rejection of the upper trendline of the ascending channel, which is also acting as the support.
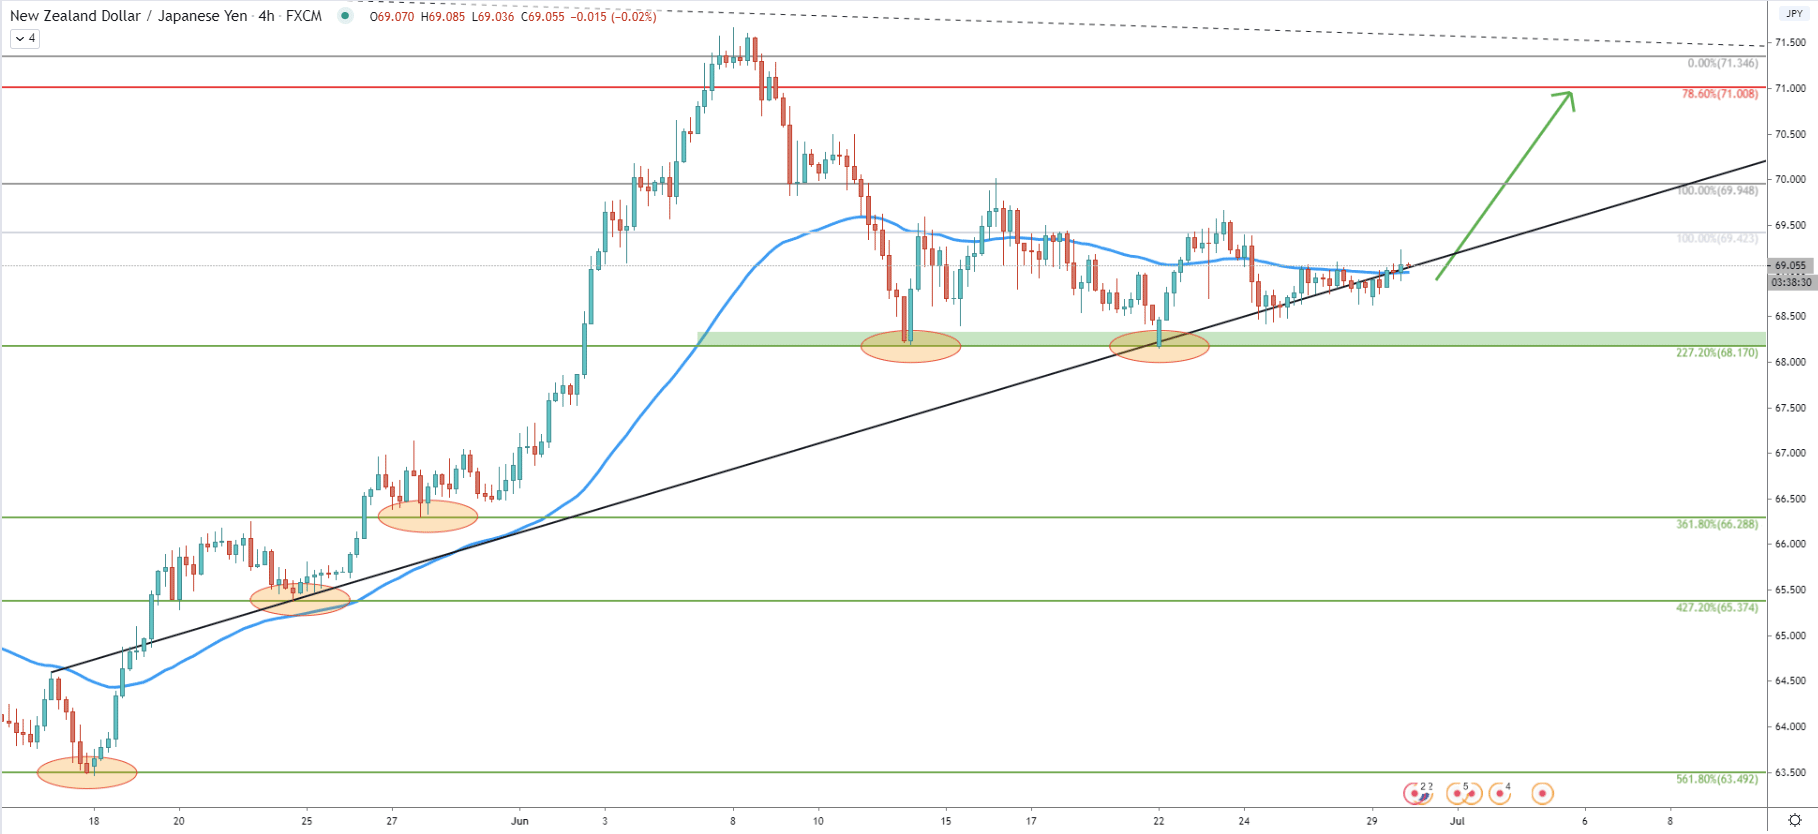
On the 4-hour chart, the support is visible very clearly, where NZD/JPY has produced a double bottom. The average-price uptrend trendline has been applied to this chart, which shows, that on June 22, when the double bottom was confirmed, the uptrend trendline has been rejected very cleanly. Today we can see the break above the 50 Simple Moving Average, which might have been the final confirmation of the upcoming wave to the upside.
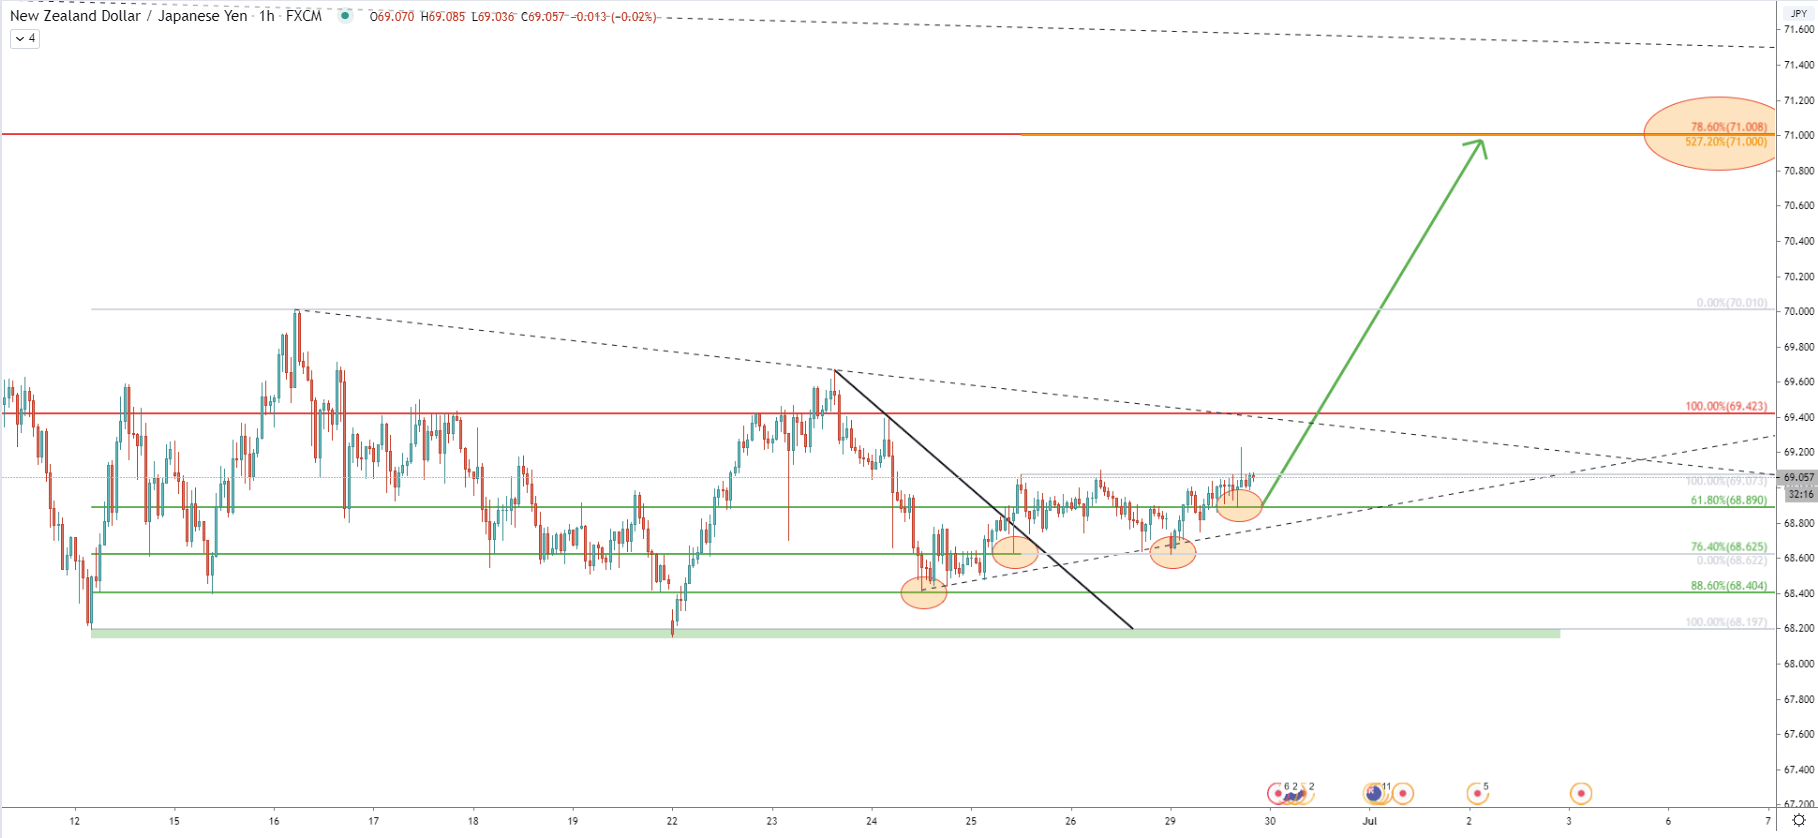
Now we are finally moving on to the 1-hour timeframe, which clearly shows the double bottom formation at 68.20 support area. Here we have applied the Fibonacci retracement indicator to the 12-16 June wave up. Based on this indicator we can spot multiple support levels rejected consistently. Frist being the 88.6% Fibs at 68.40, then 76.4% Fibs at 68.62 and finally, the last clean rejection of the 61.8% Fibs at 68.89.
This goes to show the potential preparation for either a strong upside really or at the very least a single wave to the upside. On this chart, the upside target and the resistance is also confirmed by 527.2% Fibs applied to the point where 76.4% Fibs were rejected after breaking above the downtrend trendline.
The long term trend still remains very bullish on the NZD/JPY currency pair, especially after the breakout of the downtrend trendline and 200 EMA on the daily chart. But while the uptrend remains valid, we might only see one wave to the upside before the major uptrend continuation. It will be important to see price action near 71.00 psychological resistance because only a clean break and close above on the Daily and Weekly chart could confirm the long term uptrend.
Based on 3 different Fibonacci retracement levels the upside target is located at 71.00, which is also a key psychological resistance. If broken, the uptrend continuation should be expected.
Key support is located at 68.20 area where the double bottom has been formed. Only the daily break and close below this level can invalidate bullish outlook and long term downtrend will most likely continue.
Support: 68.19, 68.40, 68.89
Resistance: 69.42, 71.00


