
Published: August 21st, 2020
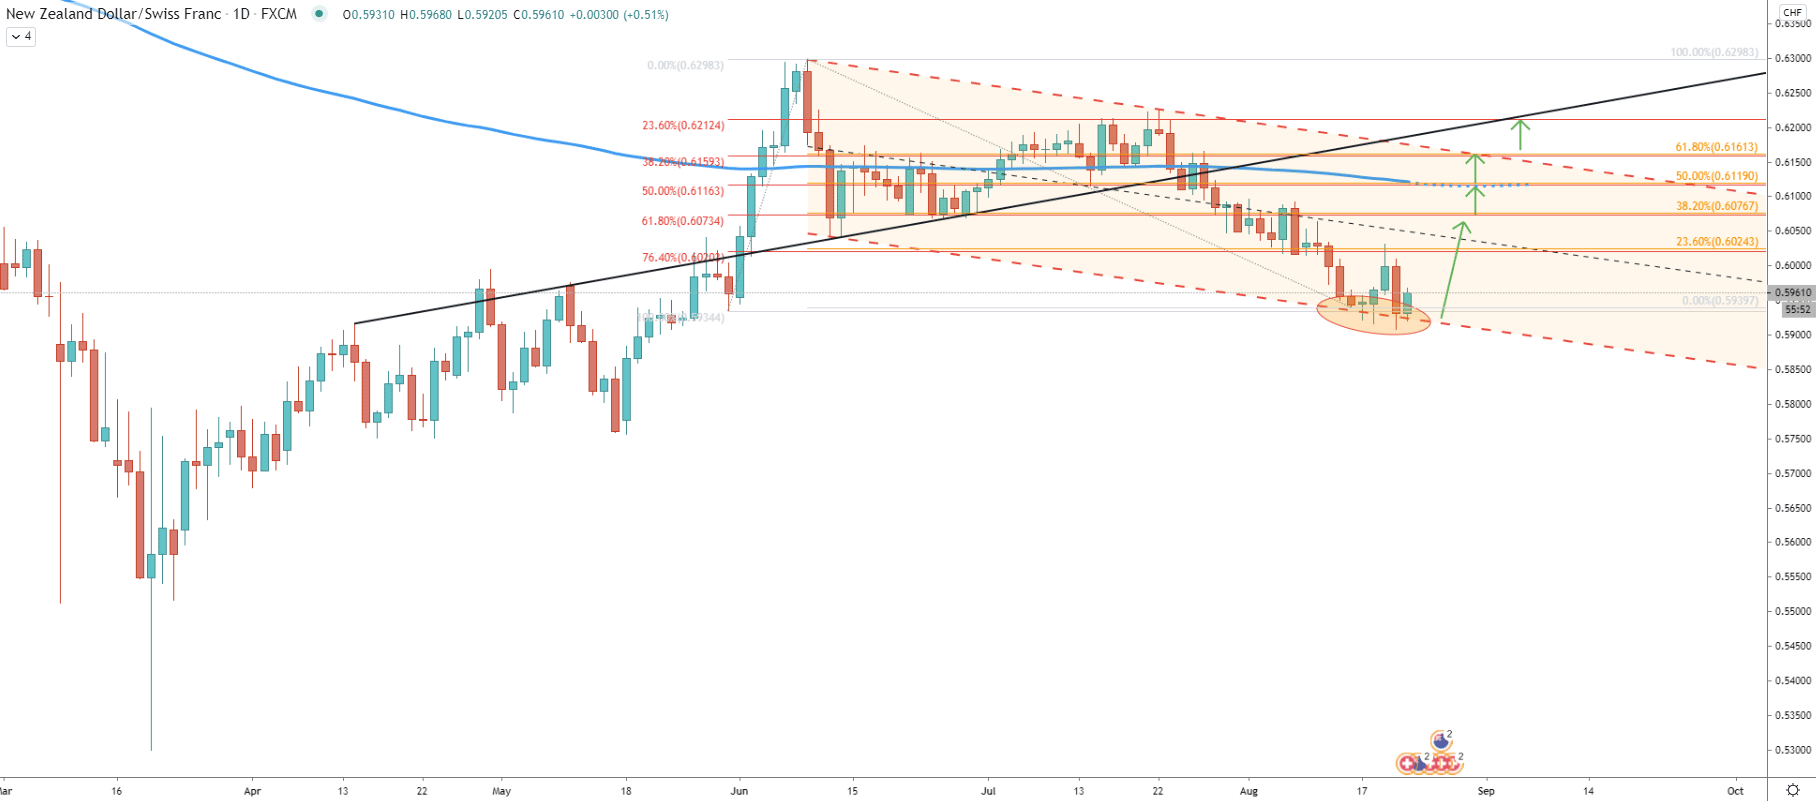
NZD/CHF has been trending down within the descending channel since June this year. The 3-months of a downtrend resulted in the price decline from 0.6293 high to 0.5908 low. Overall, the price has dropped by 389 pips which equals to 6.19%. This certainly looks like an ABC correction from the long-term perspective, which could have come to an end.
The bottom of the ascending channel has been rejected twice, and as long as daily close remains above the 0.5900 psychological support, NZD/CHF will be attempting to move higher. This could be either a strong wave to the upside or a continuation of the major uptrend.
We have multiple resistance levels on this chart, each of them corresponds to two Fibonacci retracement levels. First Fibs was applied to the May 29 - June 09 upside wave, while the second Fibs was applied to the overall move down since price topped on the June 09. There are 5 resistance levels in total and price might reach and then reject each one of them. But, considering the highest resistance being at 0.6212, daily break and close above could be the final confirmation of the major uptrend continuation.
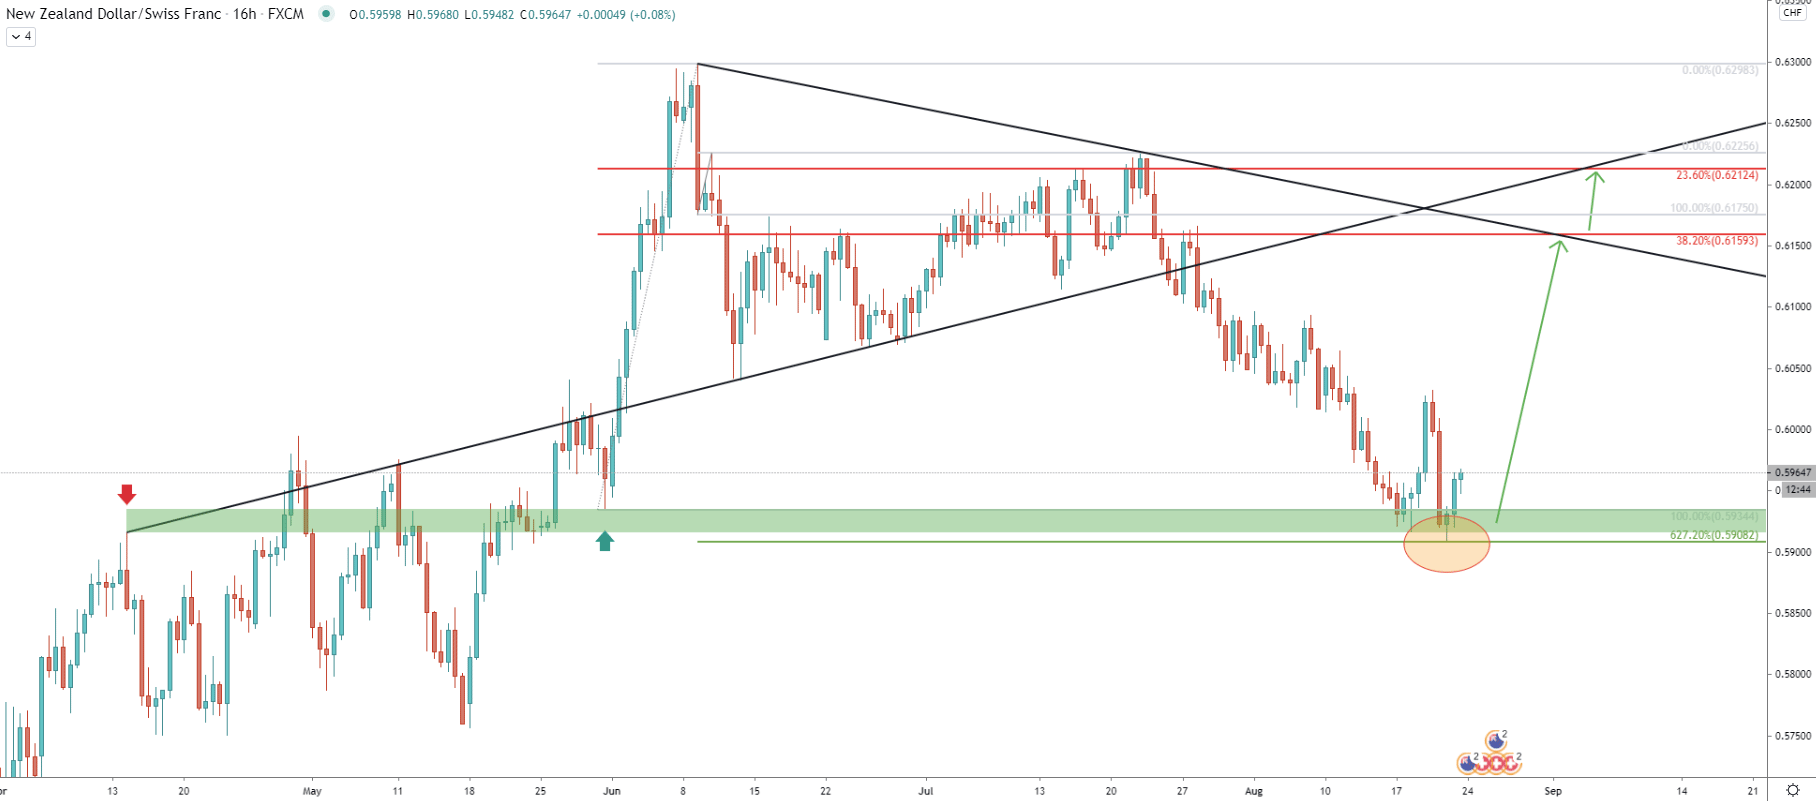
During the current trading week, the price has produced the double bottom near 0.5915, where it has rejected the previous level of resistance, which currently acting as the support. On this chart, two key resistance levels are highlighted; these are 38.2% Fibs at 0.6159 and 23.6% Fibs at 0.6212. First resistance corresponding to the downtrend trendline, and second to the average price uptrend trendline. This means that the upside potential is relatively large, and the price can be expected to rise by nearly 300 pips in the coming weeks.
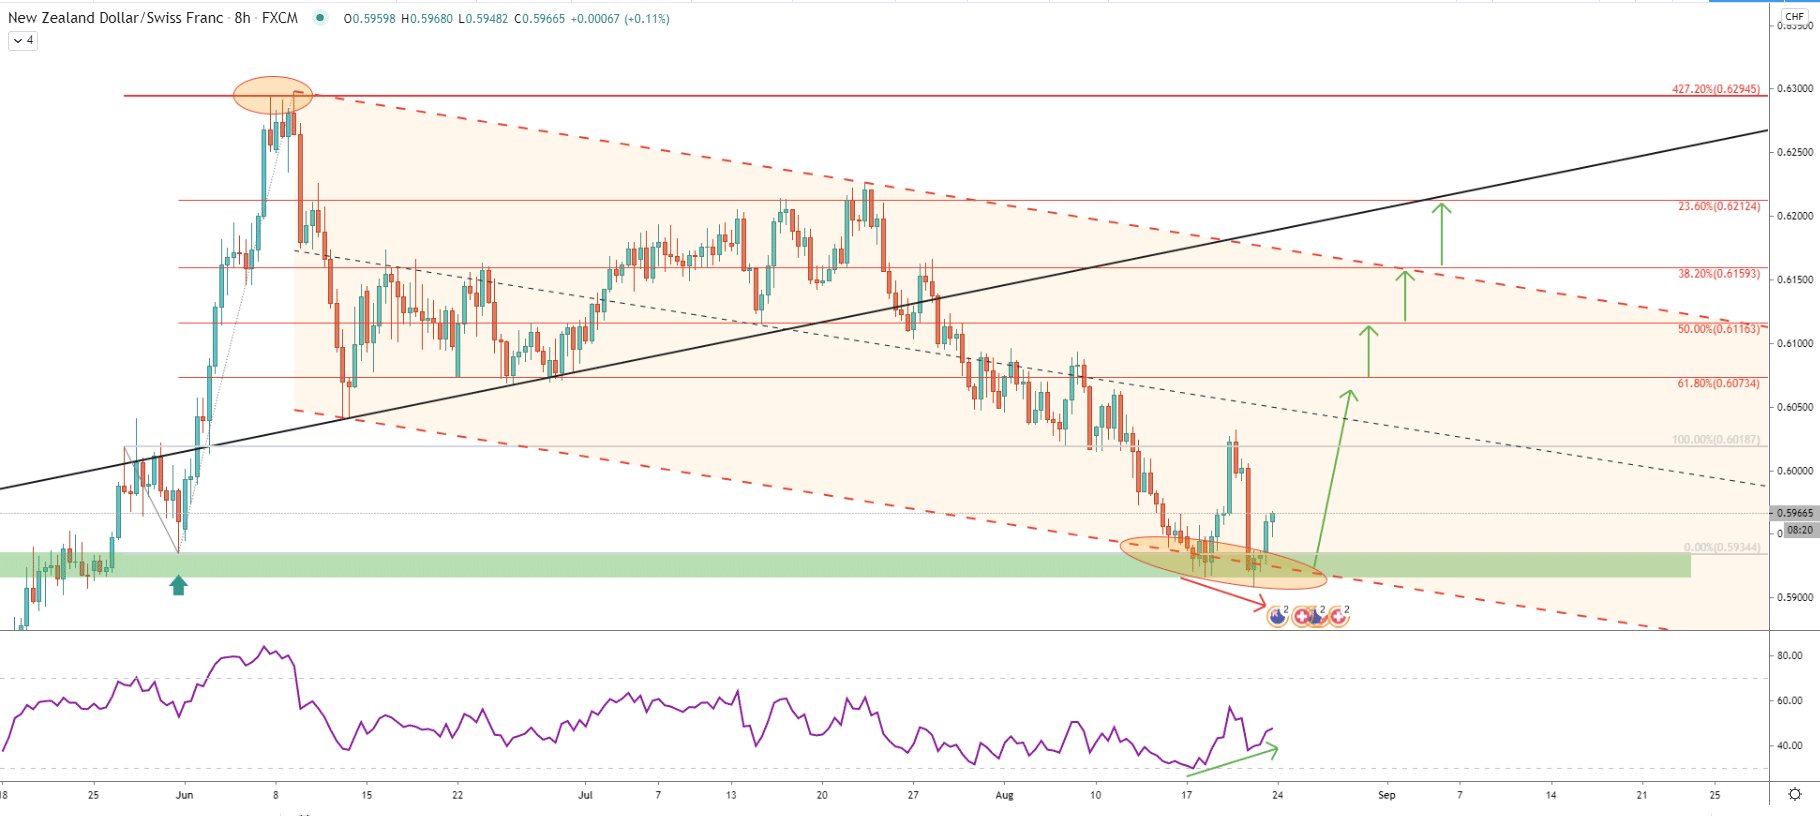
Fibs were applied to the corrective wave down, where price rejected the 0.5334 support back in May this year. It shows that 427.2% retracement level at 0.6294 has been rejected cleanly and could suggest that the long term trend remains bearish. Nonetheless, the price has reached the bottom of the descending channel, rejected it and RSI formed a bullish divergence. Such price action could be the signal that the bottom of the correction is formed and now it is time for the uptrend.
We can see that the nearest resistance at 61.8% Fibs, which is 0.6073, corresponding to the previous level of support and remains the first important level to watch if price will continue to rise. Upon the break above of each of the Fib resistances, price should continue to rise up until the final upside target at 0.6212.

Yet another bullish divergence, which this time was formed on the 4-hour timeframe. Prior to this formation, the price went up and broke above the downtrend trendline, suggesting strong buying pressure. If bulls will be able to defend 0.5900, the 0.6073 resistance could be reached at the beginning of the coming week. This resistance corresponds to two Fibs as well as the extended 200 Exponential Moving Average and the average-price downtrend trendline. Indeed this might be the first major obstacle for the NZD/CHF should the uptrend begin.
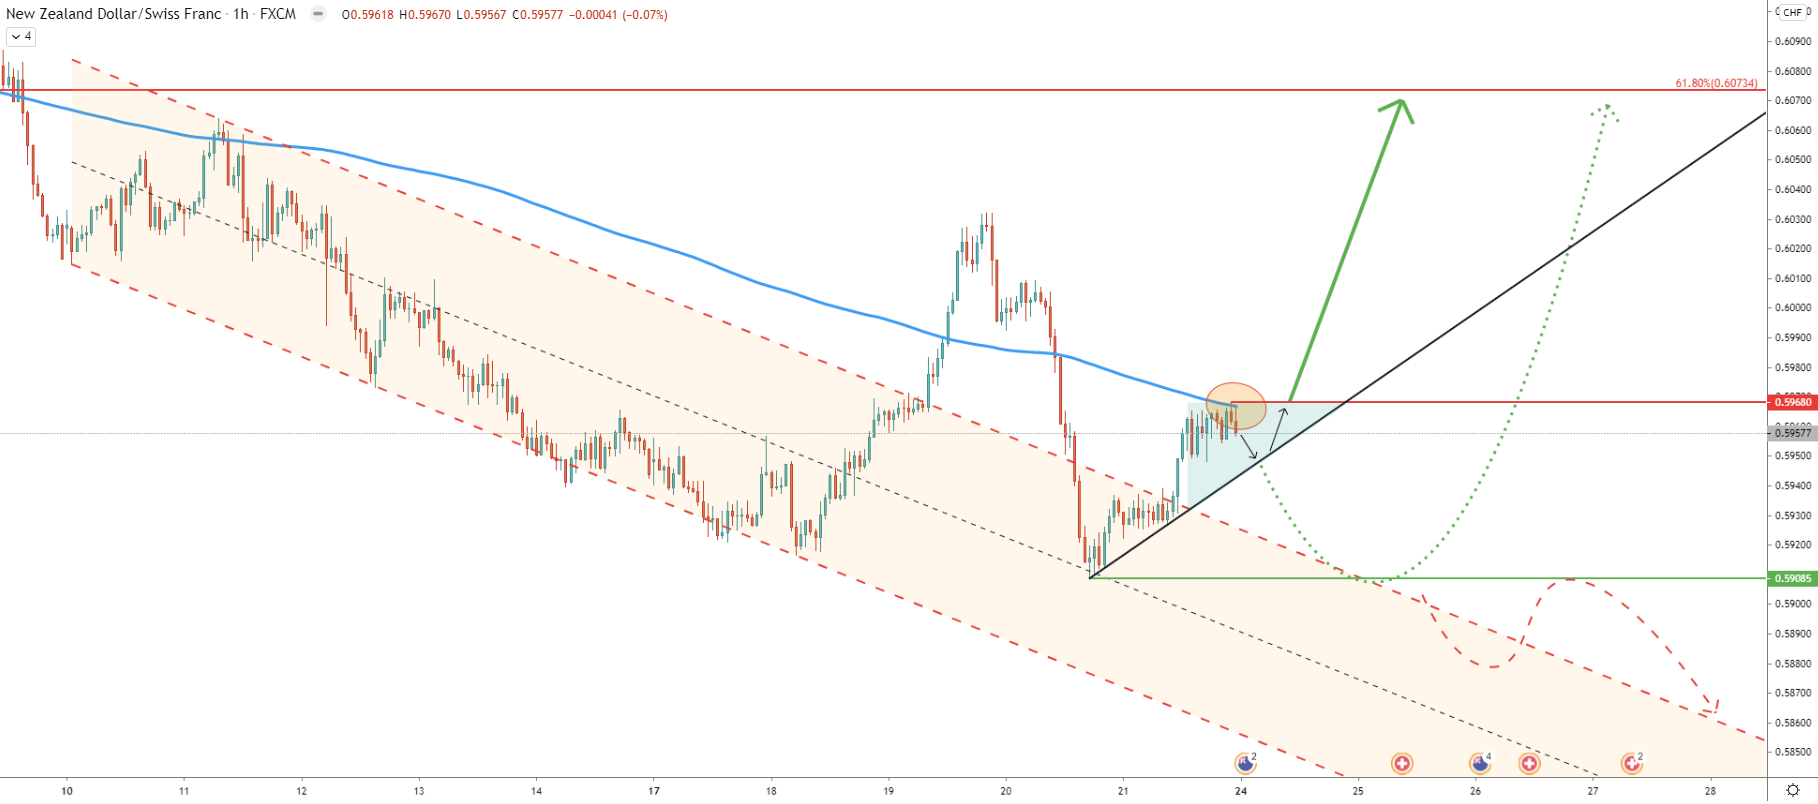
On the hourly chart, price broke above yet another descending channel and reached the 0.6032 high. Although strong pullback followed where NZD/CHF went down sharply and tested the 0.5908 low. On the correction, the price has rejected the middle trendline of the channel and then started to rise slowly. Currently, the price could be starting to form a triangle pattern and it will be important to watch the direction of the breakout.
Break below the uptrend trendline can result in the price moving down yet again, potentially testing the 0.5900 psychological support. Break and close below this support could result in the downtrend continuation, most probably it will be a sluggish price decline towards the upper trendline fo the descending channel.
On the other hand, if price breaks above the triangle and the 200 EMA which is currently is a resistance, NZD/CHF will most likely continue trending upwards towards at least the nearest resistance at 0.6073.
NZD/CHF has formed a double bottom near 0.5900 psychological level and formed a bullish divergence on two different timeframes. This is likely to result in the trend reversal, where NZDCHF can be expected to reach at least 0.6073 resistance level.
As per the Daily chart, there 5 resistance levels confirmed by multiple Fibonacci retracement levels. These are 0.6024, 0.6073, 0.6119, 0.6161, 0.6212.
Only daily break and close below 0.5900 support area can result in the continuation of the downtrend.
Support: 0.5950, 0.5920
Resistance: 0.5968, 0.6032


