
Published: June 19th, 2020
It is a well-known fact about the Gold positive correlation to the Swiss Franc. The price of gold has a correlation with the CHF because 25% of Switzerland’s money is backed by gold reserves. This means that when gold goes up, Swiss Franc also goes up, and visa versa.
Gold daily chart:
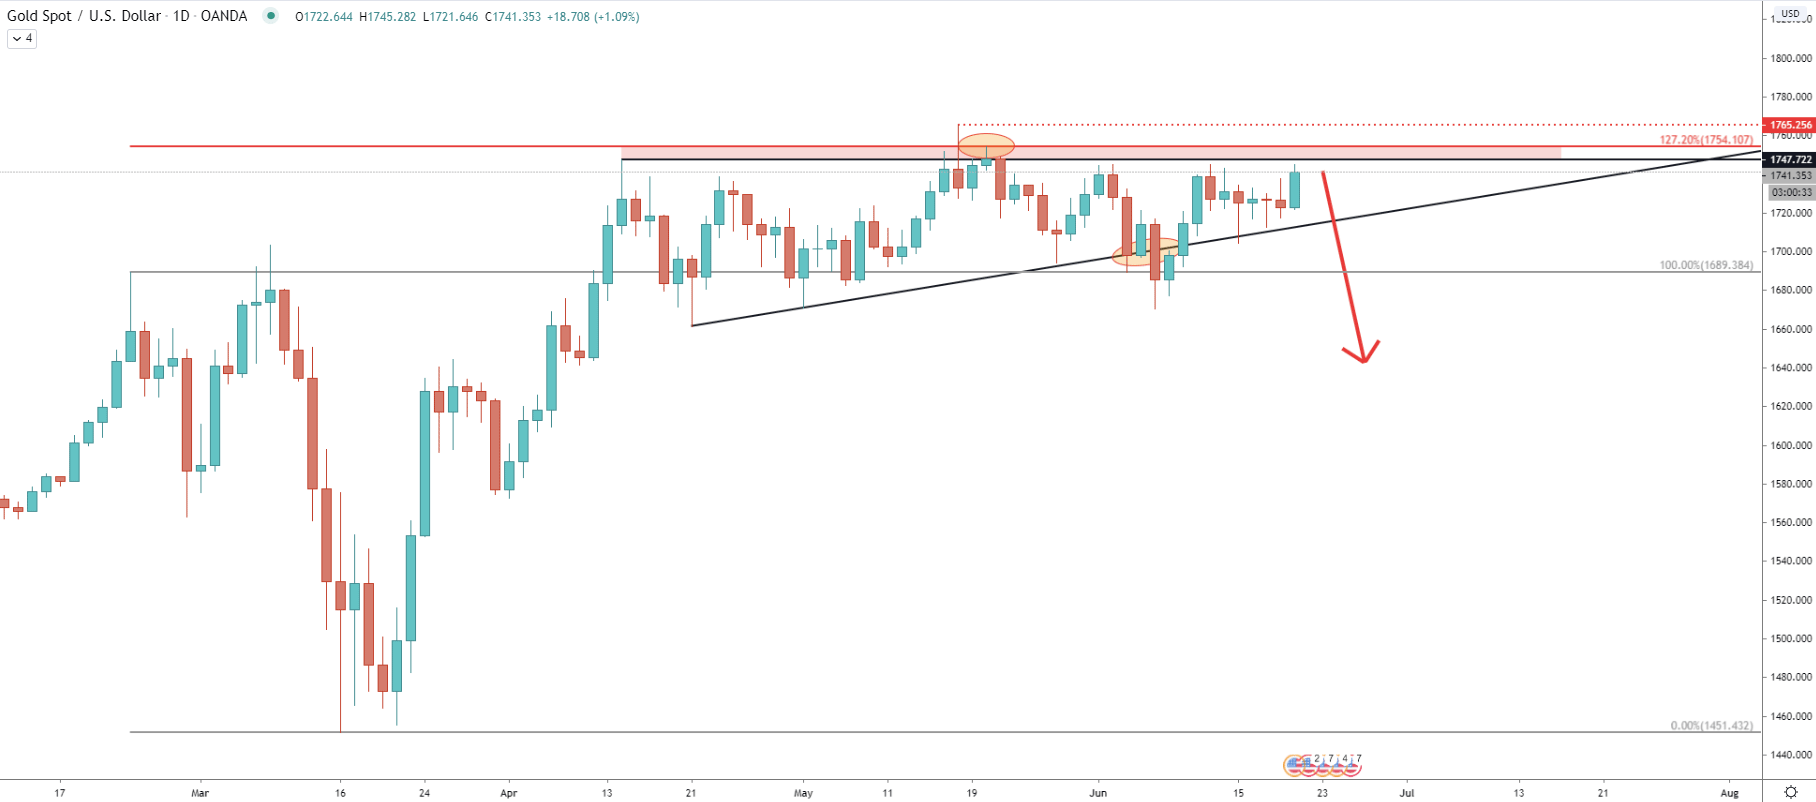
Looking at the gold price we can see a strong resistance formed near the 1750 area. At the same time, we can see a clear rejection of the 127.2% Fibonacci retracement level, right at the 1754 level. But the most important factor is the break below the uptrend trendline, which seems to confirm the bearish potential.
This is the reason for the Swiss Franc price upside potential, which means that XXX/CHF pairs might also move up. For this reason, we are bringing the NZD/CHF currency pair for your attention and the potential of the upcoming uptrend.
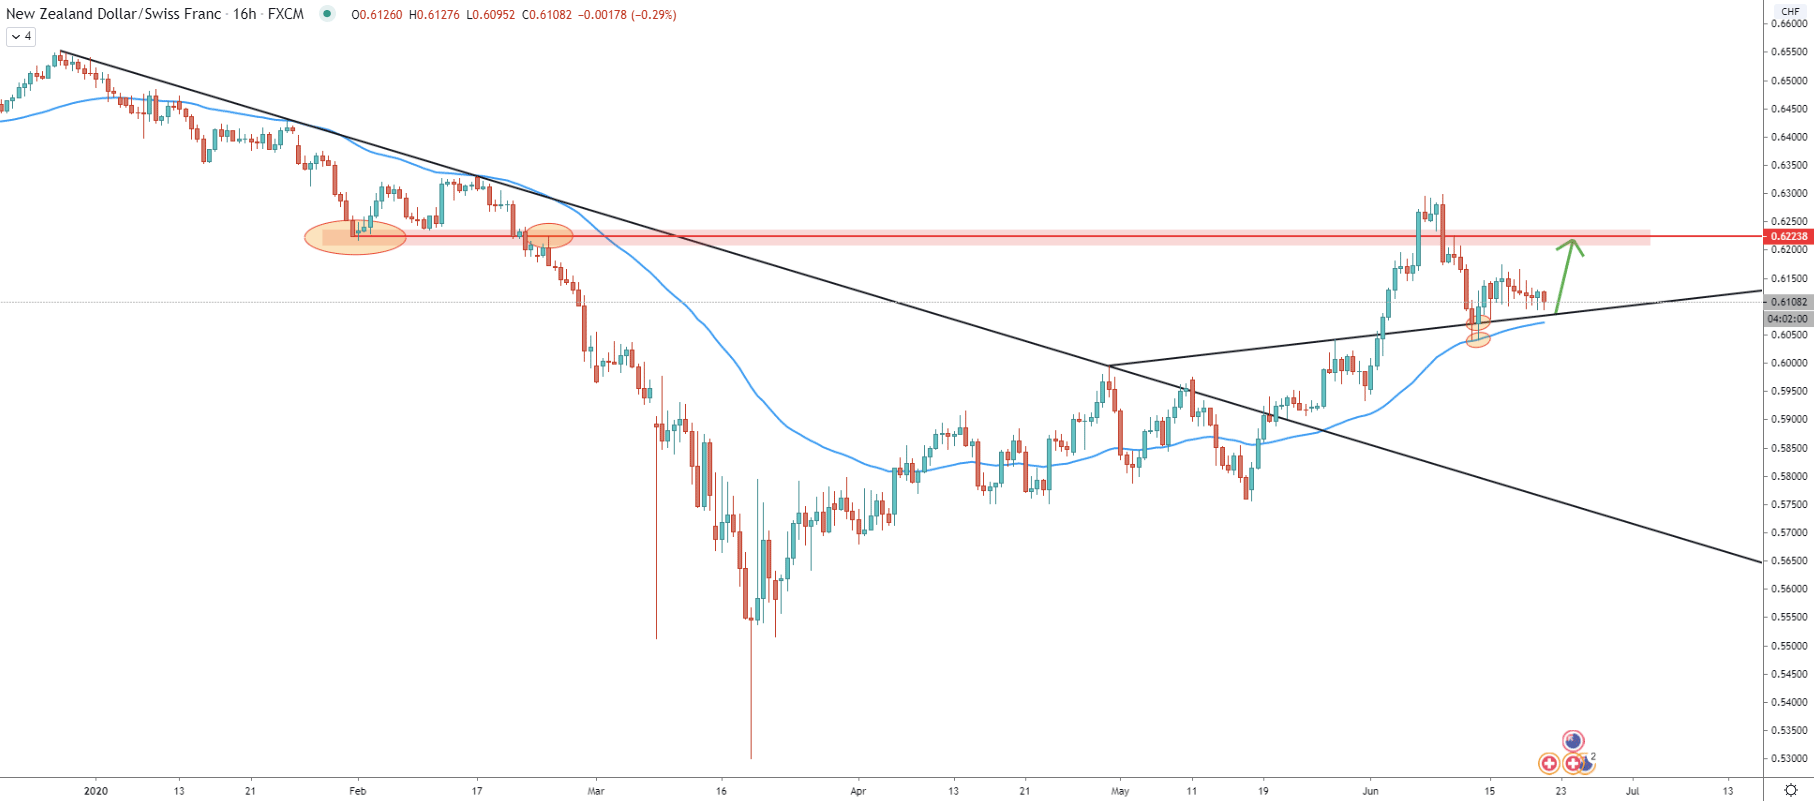
On the 16-hour chart, the previously formed resistance at 0.6223 has been broken, along with the downtrend trendline. Price remains above the 200 Simple Moving Average and in fact, there was a clean bounce off the SMA on June 11. In addition, the support trendline was rejected and all these facts suggest a potential for the further price increase. But to confirm the long term uptrend, the price must break above the 0.6222 level once again, and currently, it still remains the key resistance and the nearest upside target.
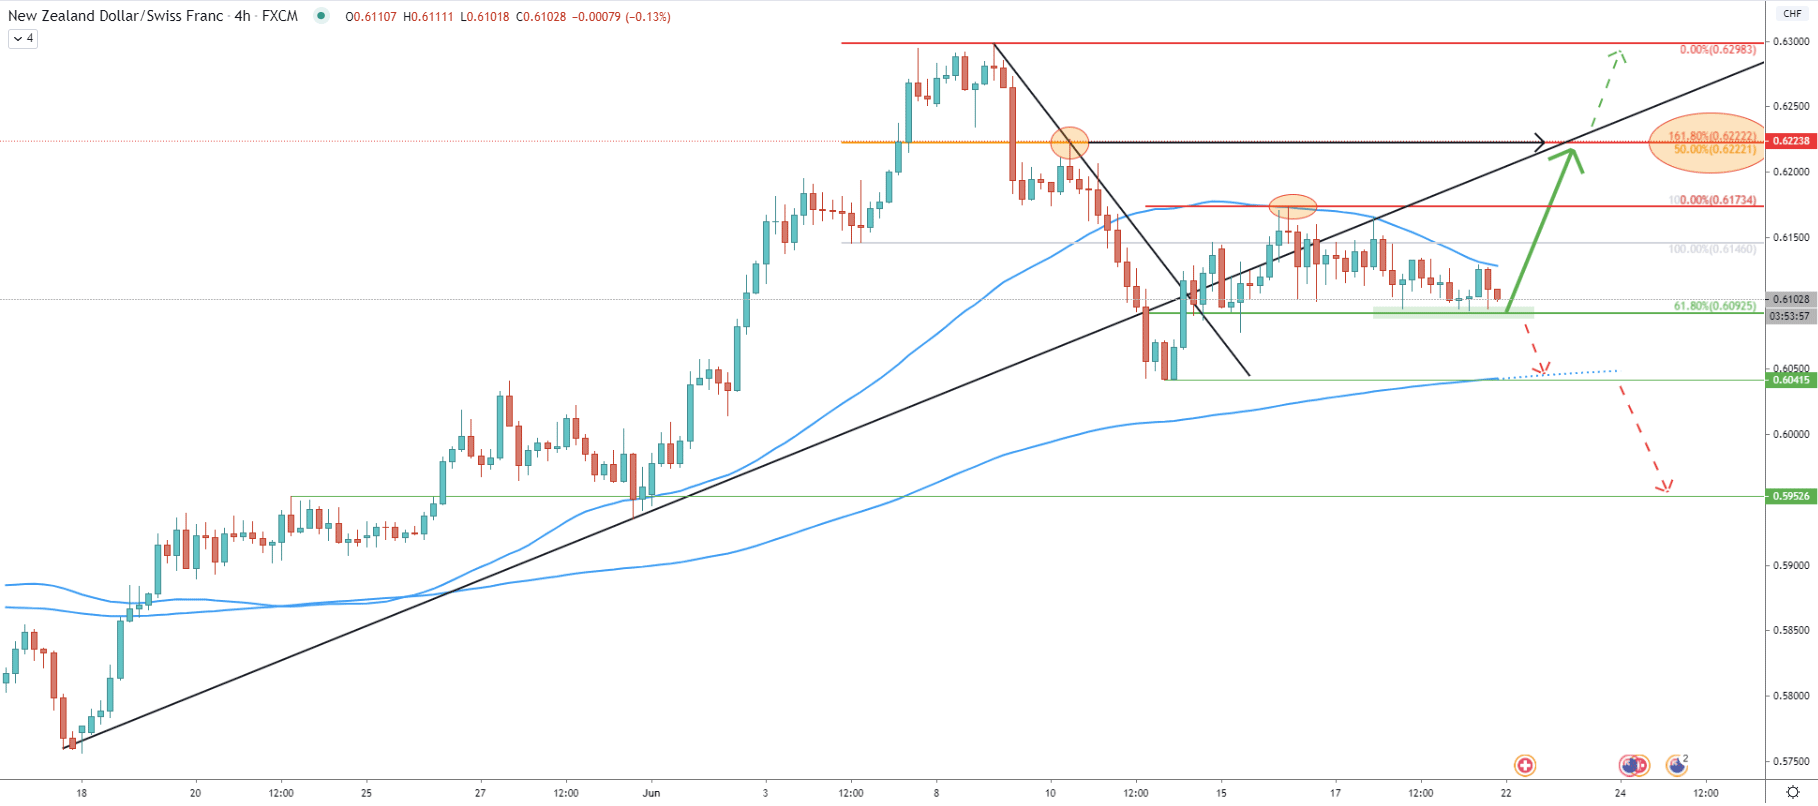
On the 4-hour chart, price broke below the uptrend trendline, suggesting the price decline in the long run. Although the shorter-term downtrend trendline was also broken, which could mean that price is about to initiate a consolidation mode. While the price is consolidating, bottoms are good for buyers and tops are good for sellers. Right now, the NZD/CHF price remains at the bottom, because it rejected the 61.8% Fibonacci retracement level at 0.6093.
On the other hand, we can see the clean bounce off the 50 SMA, and this yet again confirmes that the price is consolidating. As long as the 61.8% Fibonacci support holds, NZD/CHF should be expected to move up. There is only one very strong resistance price, which is based on 2 Fibonacci retracement levels and is located at 0.6222. It is confirmed by 50% Fibs applied to the last wave up, along with the 161.8% Fibs applied to the current correction down.
If 0.6092 support will be broken, there is a high possibility that NZD/CHF will move down to re-test the 0.6041 support as well as the 200 Exponential Moving Averages. But as long as price remains above the support, pair should be expected to move north.
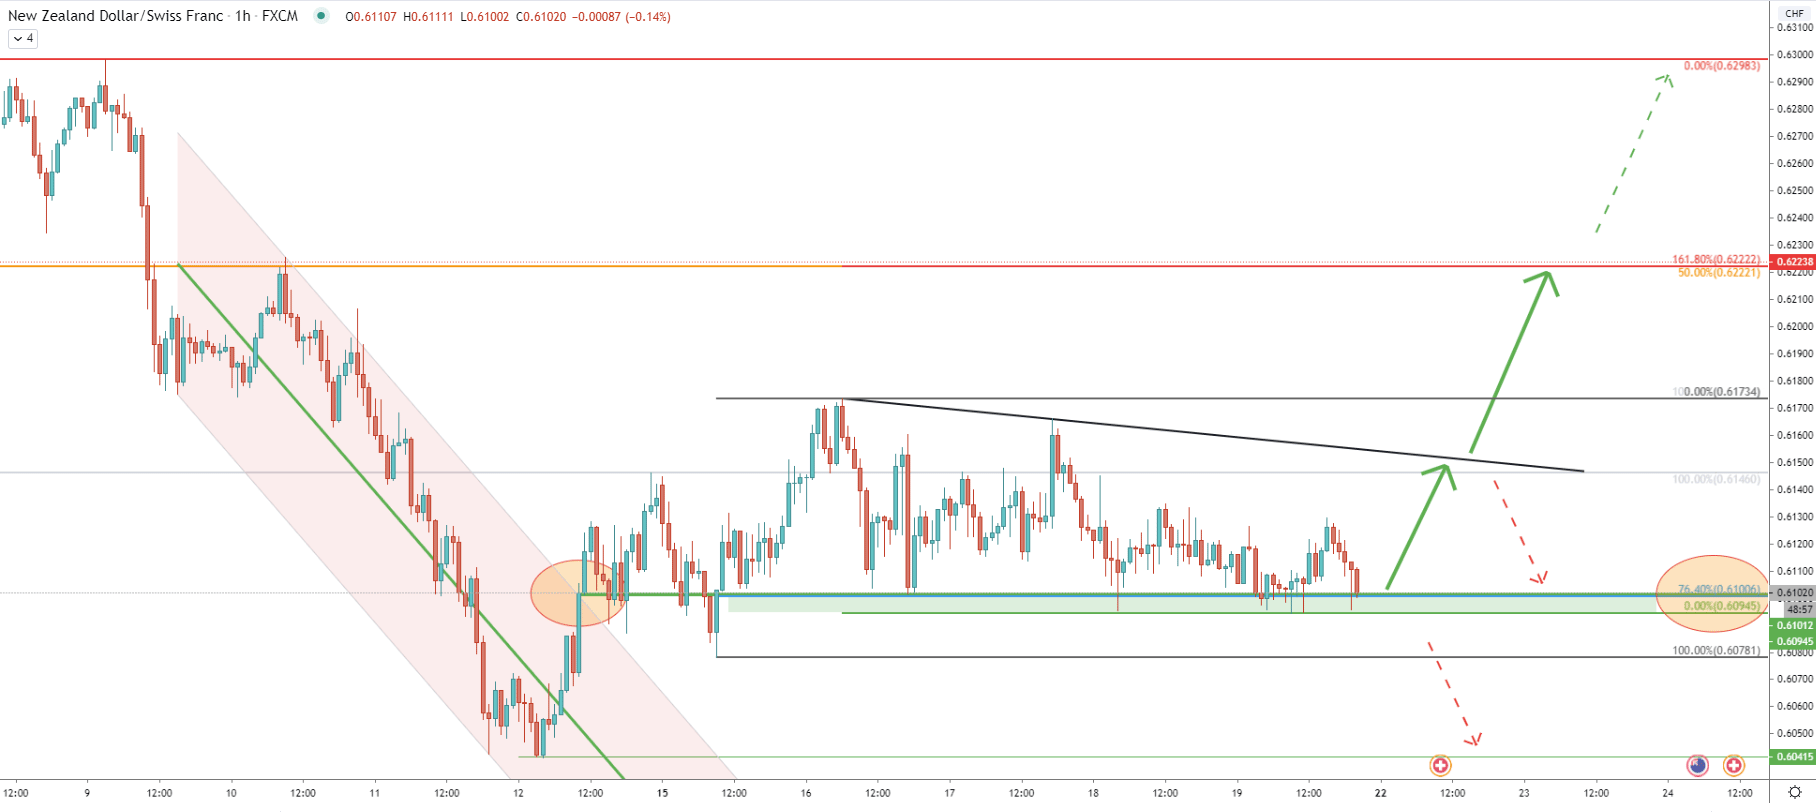
On the 1-hour chart we can clearly observe the support area formed between 0.6100 psychological level, and 0.6094 low, formed below. As long as price remains above the 0.6094, NZD/CHF will move up, to test the downtrend trendline. If the trendline will be penetrated, more upside potential should become available for buyers.
It is worth noting that currently, price stands at 76.4% Fibonacci retracement level which cleanly corresponds to the breakout point of the descending channel. It makes the current support area extremely important in the short and long term.
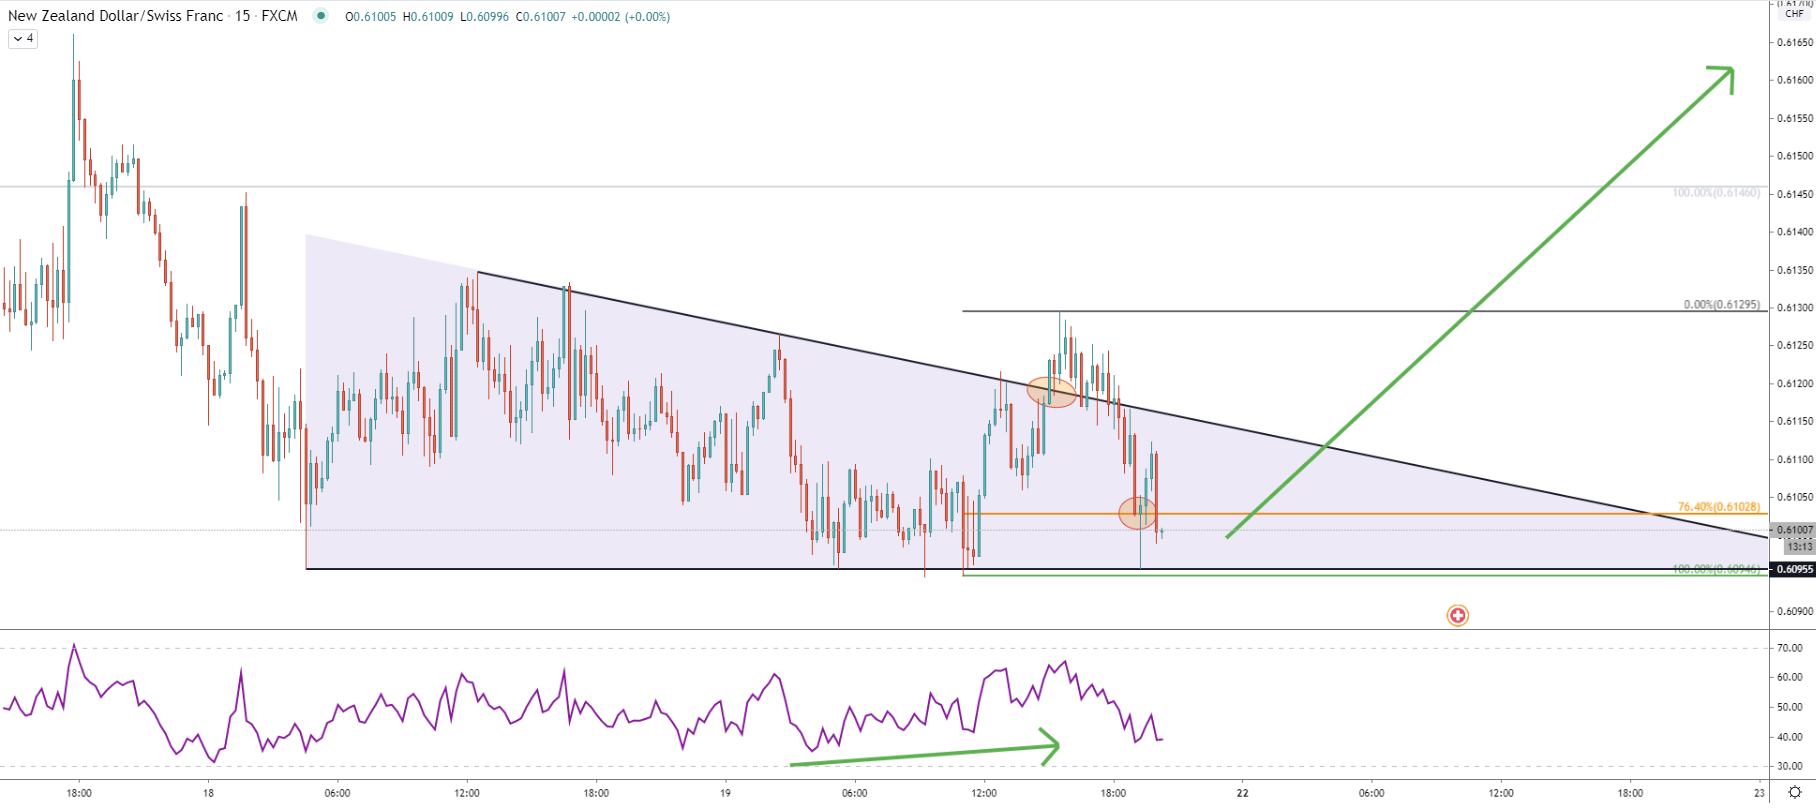
On the 15-minute chart, price broke above the triangle pattern, confirming bullish dominance. After the breakout price corrected down strongly, although rejected the 76.4% Fibonacci retracement level at 0.6103. There was produced a spike below, reaching 0.6095 low, although there was no closing price below the spike. Considering the formation of the bullish divergence on the RSI oscillator, at least in the short term, the uptrend remains valid.
NZD/CHF is currently trading at a very important support area. If this support holds, price is likely to continue the long term uptrend and right now NZD/CHF might be very attractive for buyers.
As per the 16h and 4h charts, the key resistance is seen at 0.6222, which is a potential 220 pip move to the upside. The uptrend might start early next week and can last for up to two weeks. If the price manages to break and close above 0.6222 on a daily chart, NZD/CHF should be expected to rise further, at least towards previous resistance at 0.6300 area.
Based on the 4h chart, the price rejected the 50 Simple Moving Average. This shows that the risk of further decline can not be ignored. If there will be daily close below 0.6092 support, NZD/CHF price is likely to drop towards the 0.6040 area, and if broken, towards the 0.5952 previously formed support.
Support: 0.6092, 0.6042
Resistance: 0.6173, 0.6222, 0.6298


