
Published: February 18th, 2020
Today NZD/CHF finally got our of the range. Consolidation has ended after price broke below the support. Seems like the downtrend is on, which could only accelerate even more. We will look at the 4H, 1H and 15M charts to see what can be expected from the price today and throughout this week.
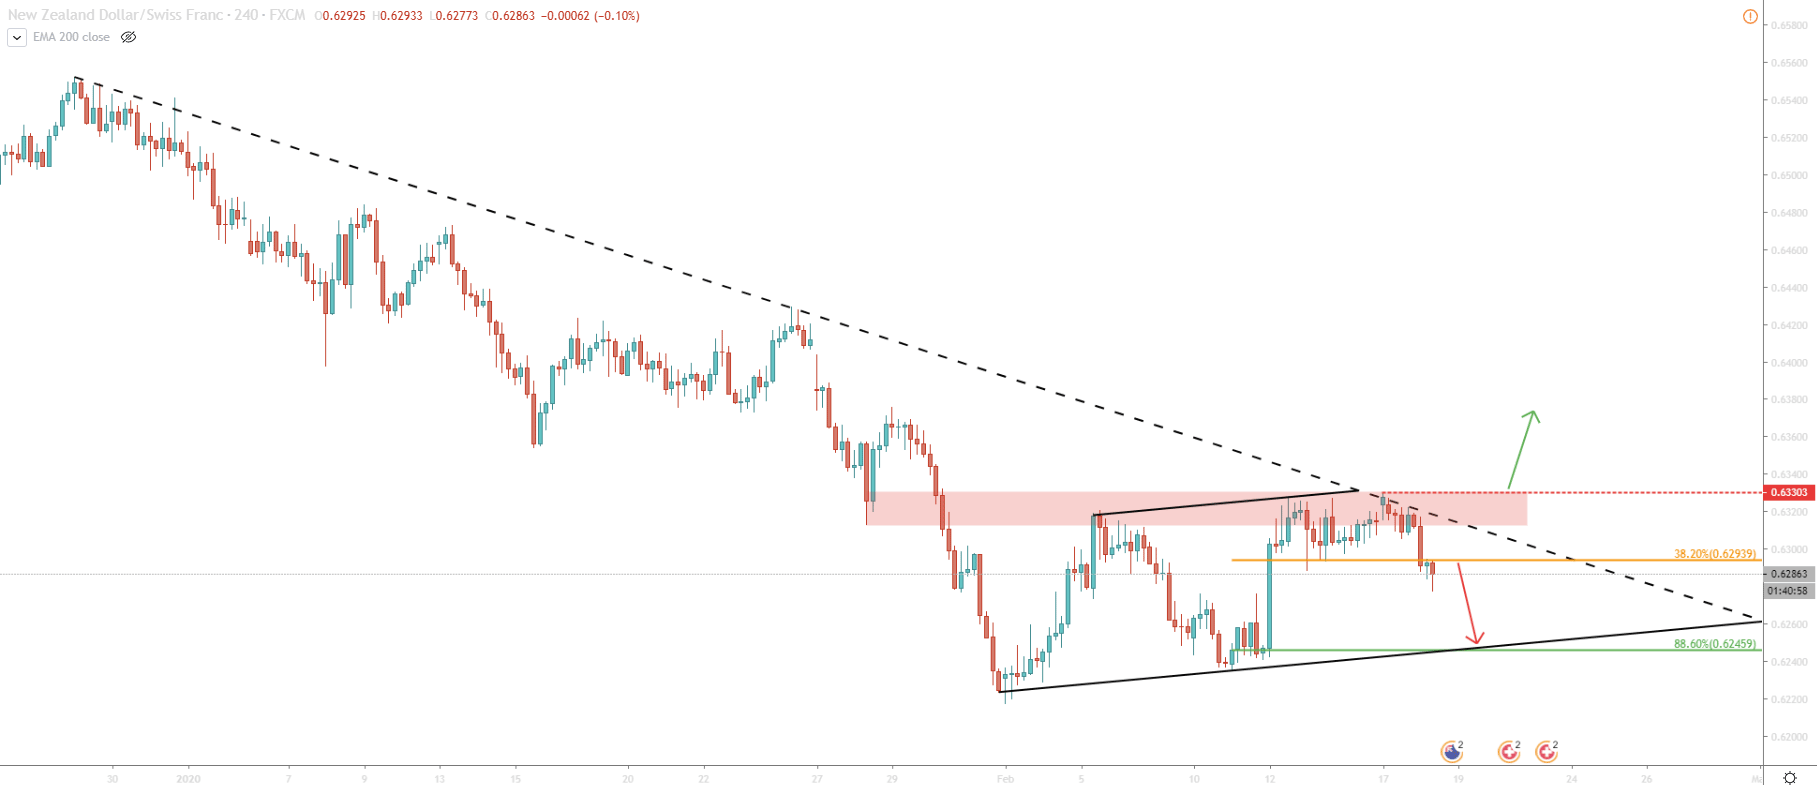
Overall, on 4H there is a clear downtrend. On February 17 pair has reached 0.6330 high and rejected the downtrend trendline. This was the area of the previous support which has now became the resistance. Clearly, the price was respected by the market, suggesting the validity of the downtrend.
It can be seen that NZD/CHF continues to trade within the ascending channel. After bouncing off the upper trendline of the channel, price is expected to move towards the bottom of the channel. That bottom is at 0.6242 and corresponds to 88.6% Fibonacci retracement applied to the corrective wave up occurred throughout February 11-17.
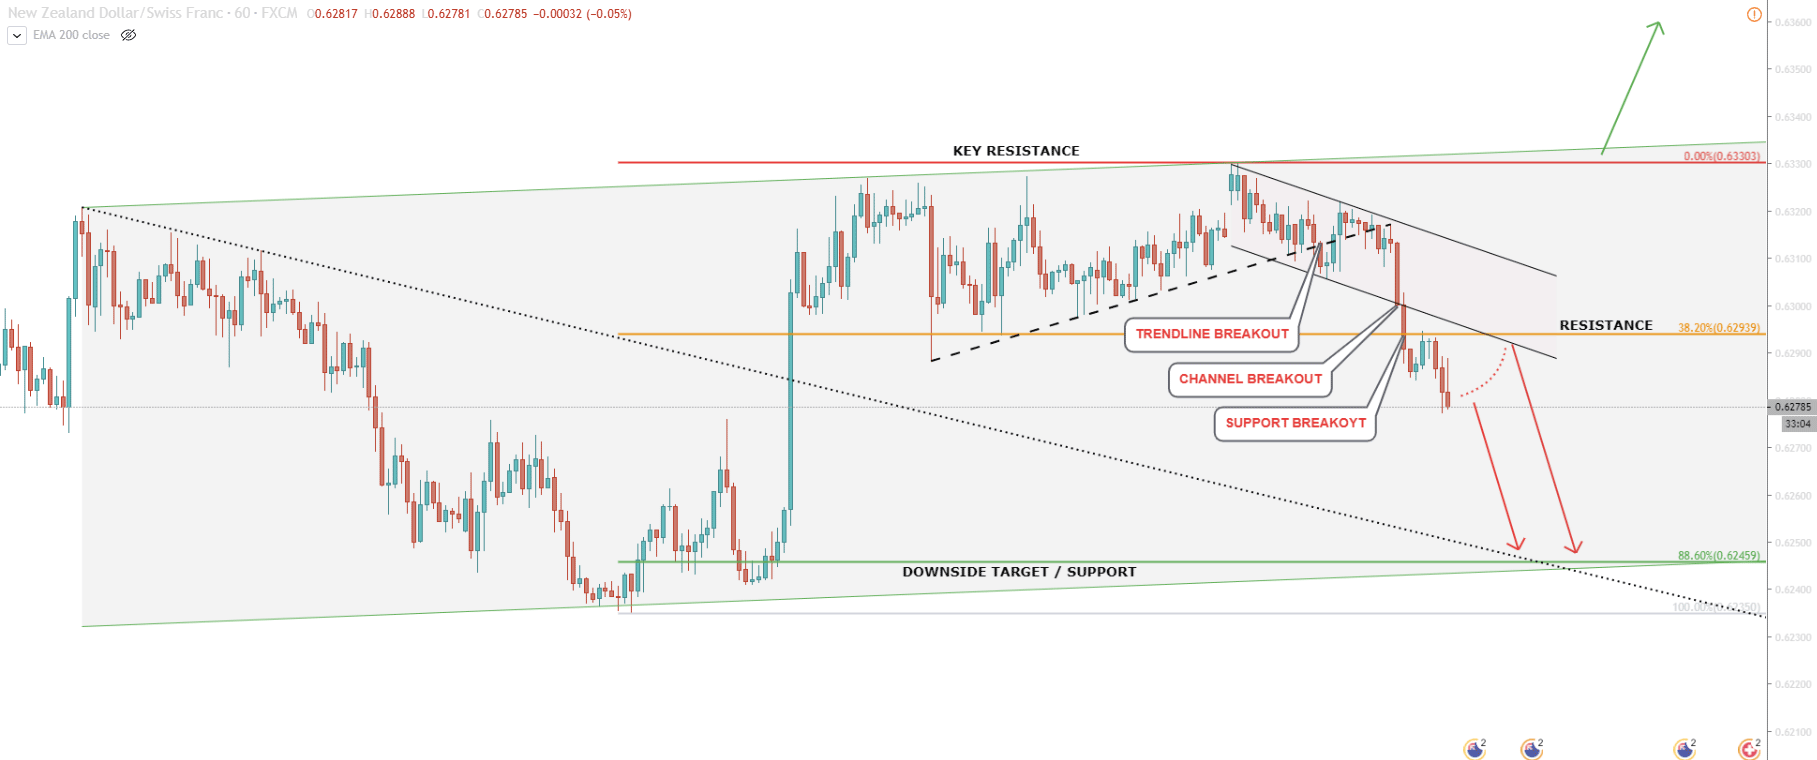
The 1H chart is giving us more information on the current state of the market. Here we can see that the uptrend trendline has been taken out. After the breakout, the price stayed within the descending channel. However, today, under the strong selling pressure, the price also broke below the channel. This could be the confirmation of a strong downtrend that has just begun.
Sellers are likely to take advantage of this rally and good entry point might be located at the 38.2% Fibonacci. This is 0.6293, the level rejected by the market today. Actually this is also an area of the previous support. On the 1H chart, the downside target also corresponds with the downtrend trendline.
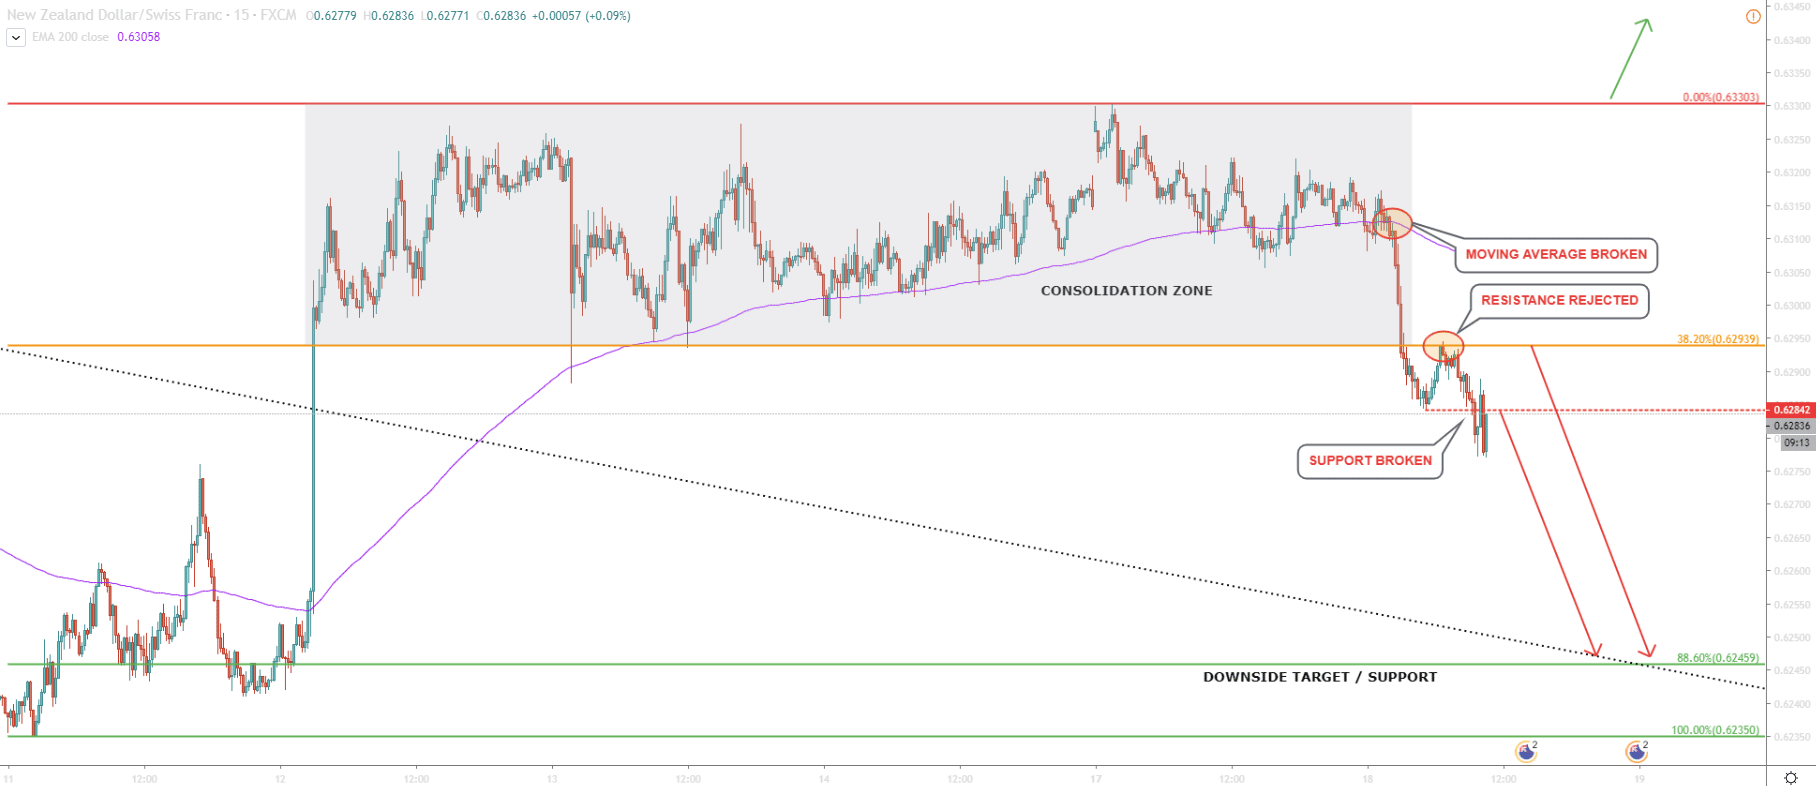
On the 15M chart, we can see the consolidation zone more clearly. Prior to breaking below the consolidation area, NZD/CHF broke the 200 Moving Average, which actually initiated and accelerated the downtrend. After breaking below the 0.6293 support, the price returned back and made that support a resistance while bouncing off of it. In the next wave down, price printed a new lower low, yet again showing strong bearish sentiment.
NZD/CHF broke out of the consolidation zone in an already established strong downtrend. Resistance was rejected followed by a new lower low. The downtrend validity is confirmed and the price is expected to drop even further. Any correction up is likely to be considered as a selling opportunity, especially 0.6284 and 0.6293 levels.
On the 4H and 1H charts, the 88.6% Fibonacci retracement level corresponds to the downtrend trendline and lower trendline of the ascending channel. This emphasizes the importance of this 0.6246 level and makes it a primary downside target. 1H break and close below that price can result in a much harder price drop.
The key resistance is at 0.6330, but only 4H break and close above this price will completely invalidate the downtrend and can result in an immediate change of direction. The first warning of the change in trend could be the NZD/CHF growth beyond 0.6300 psychological resistance.
Support: 0.6246, 0.6235
Resistance: 0.6284, 0.6294, 0.6330