
Published: May 22nd, 2020
In our recent analyses we have already mentioned that the New Zeland Dollar could be taking over many major fiat currencies. We have also made multiple analyses suggesting a weak Canadian Dollar because it is highly dependent on the oil prices, which have dropped substantially in the past months. The Canadian Dollar usually reacts to the Oil prices with some lag, and perhaps we’ll see very sharp rise on the NZD/CAD in the coming weeks..
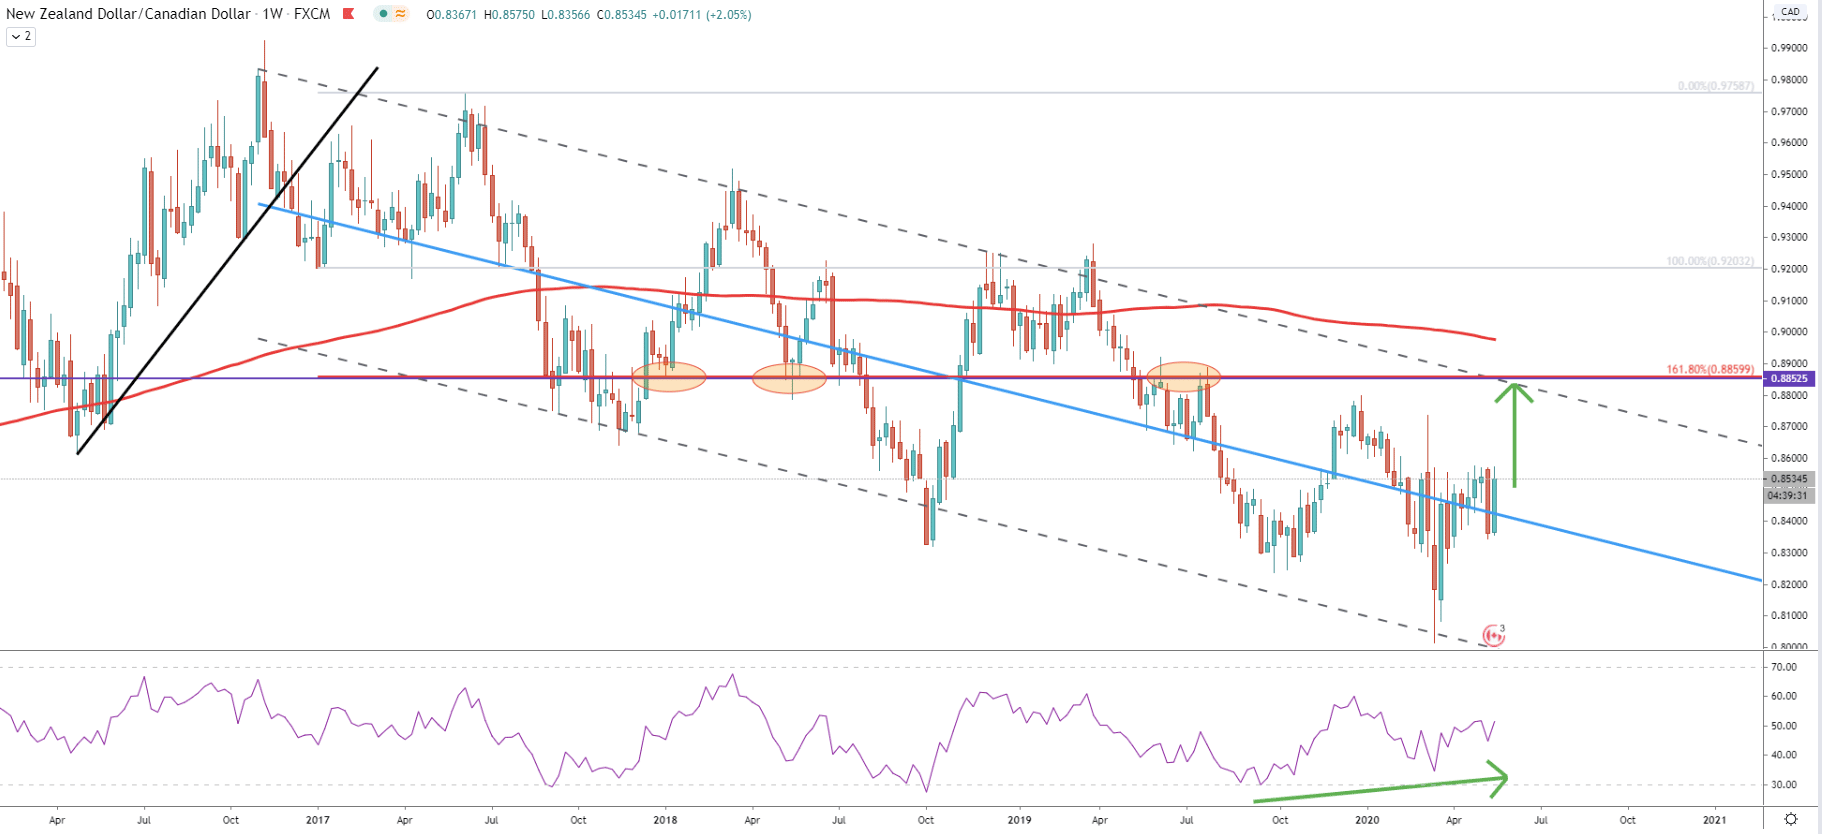
A large timeframe always gives a good price perspective and the weekly chart shows that NZD/CAD is trading within a long term descending channel. Back on the March 19, pair has tested the low, while hitting 0.8015 mark. Price has reached the bottom of the descending channel and rejected it. At the same time, the RSI oscillator has formed a bullish divergence, after which price has corrected up sharply. This looks like NZD/CAD is open for much more upside potential, especially after breaking the middle trendline of the channel and not reaching the 200 Moving Average.
The upside target is seen near 0.8860, which is confirmed by a 161.8% Fibonacci retracement level. The Fibonacci indicator was applied to the corrective wave up after breaking the uptrend trendline. The upside target at 0.8860 also corresponds to the previous levels of support as well as resistance and clearly plays a key role in the long term price development. This level should once again act as a magnet for the price in the medium to long term.
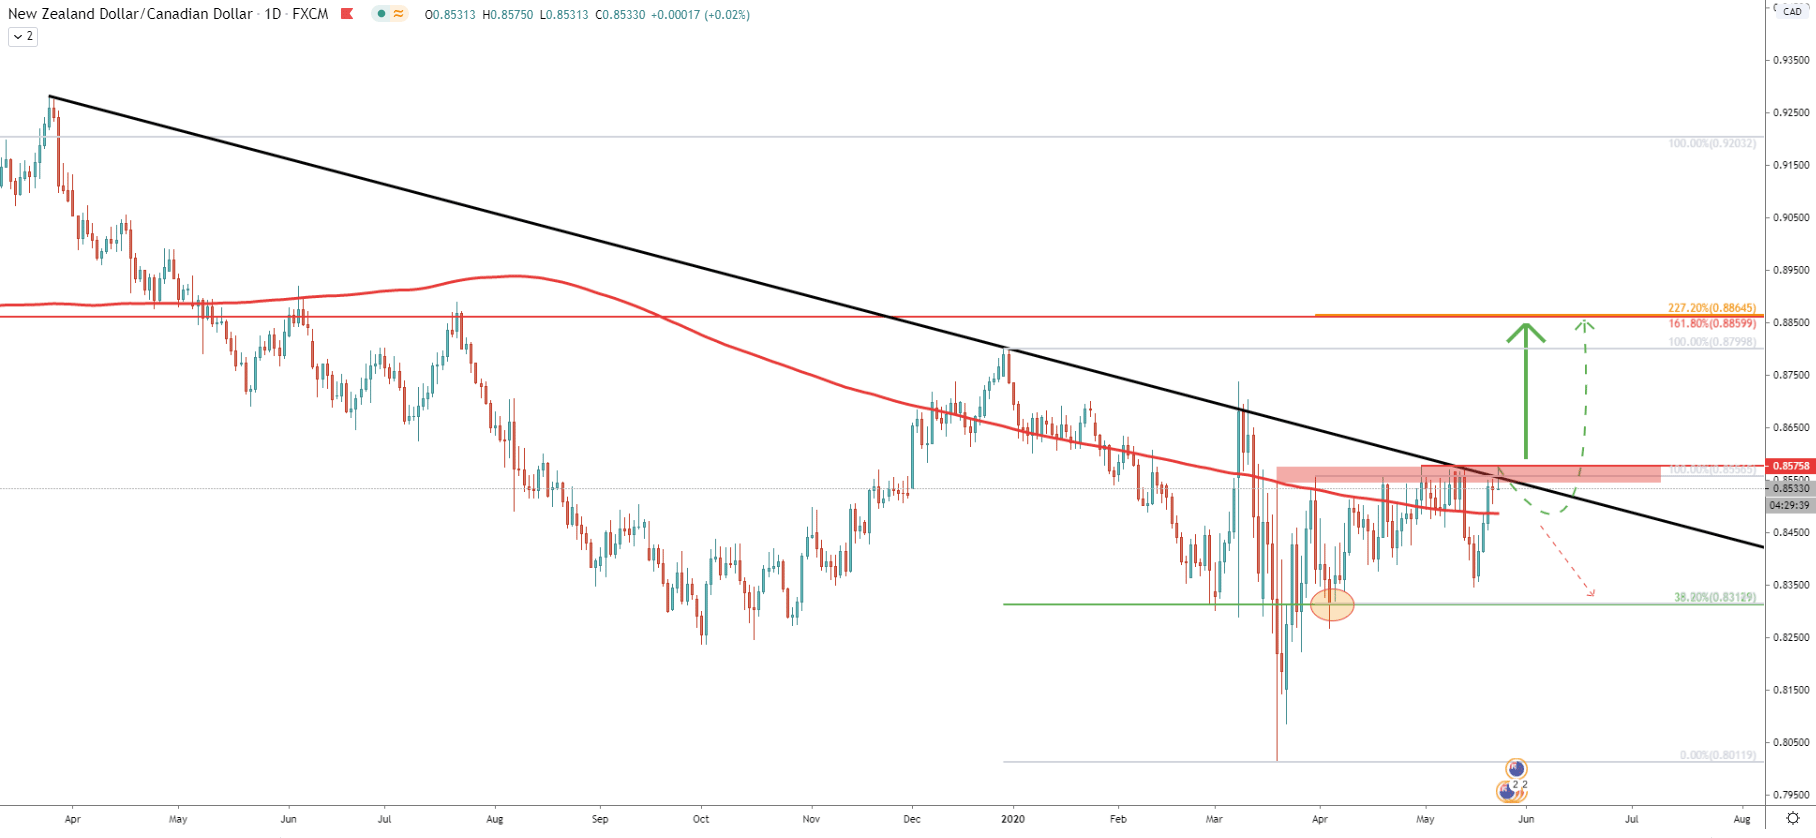
On the Daily chart there is a more bearish outlook, although only for the time being. This is because the downtrend trendline is being rejected and the price remains below 0.8576 level. It is an extremely strong level of resistance formed throughout the past few months. In fact, the past few month’s pair has been consolidating between 0.8313 support and 0.8576 resistance, which is quite an extended period of time. It seems like NZD/CAD has approached the decision-making point and it will either break to the upside or continue the long term downtrend. However, considering the bullish divergence on the Weekly chart, the probability is in favour of the upside breakout.
Perhaps the best approach would be to wait until the daily break and close above the resistance and only then take action. In this scenario, the upside target would also be confirmed by 161.8% Fibs applied to the corrective ave down where 38.2% Fibs was rejected.
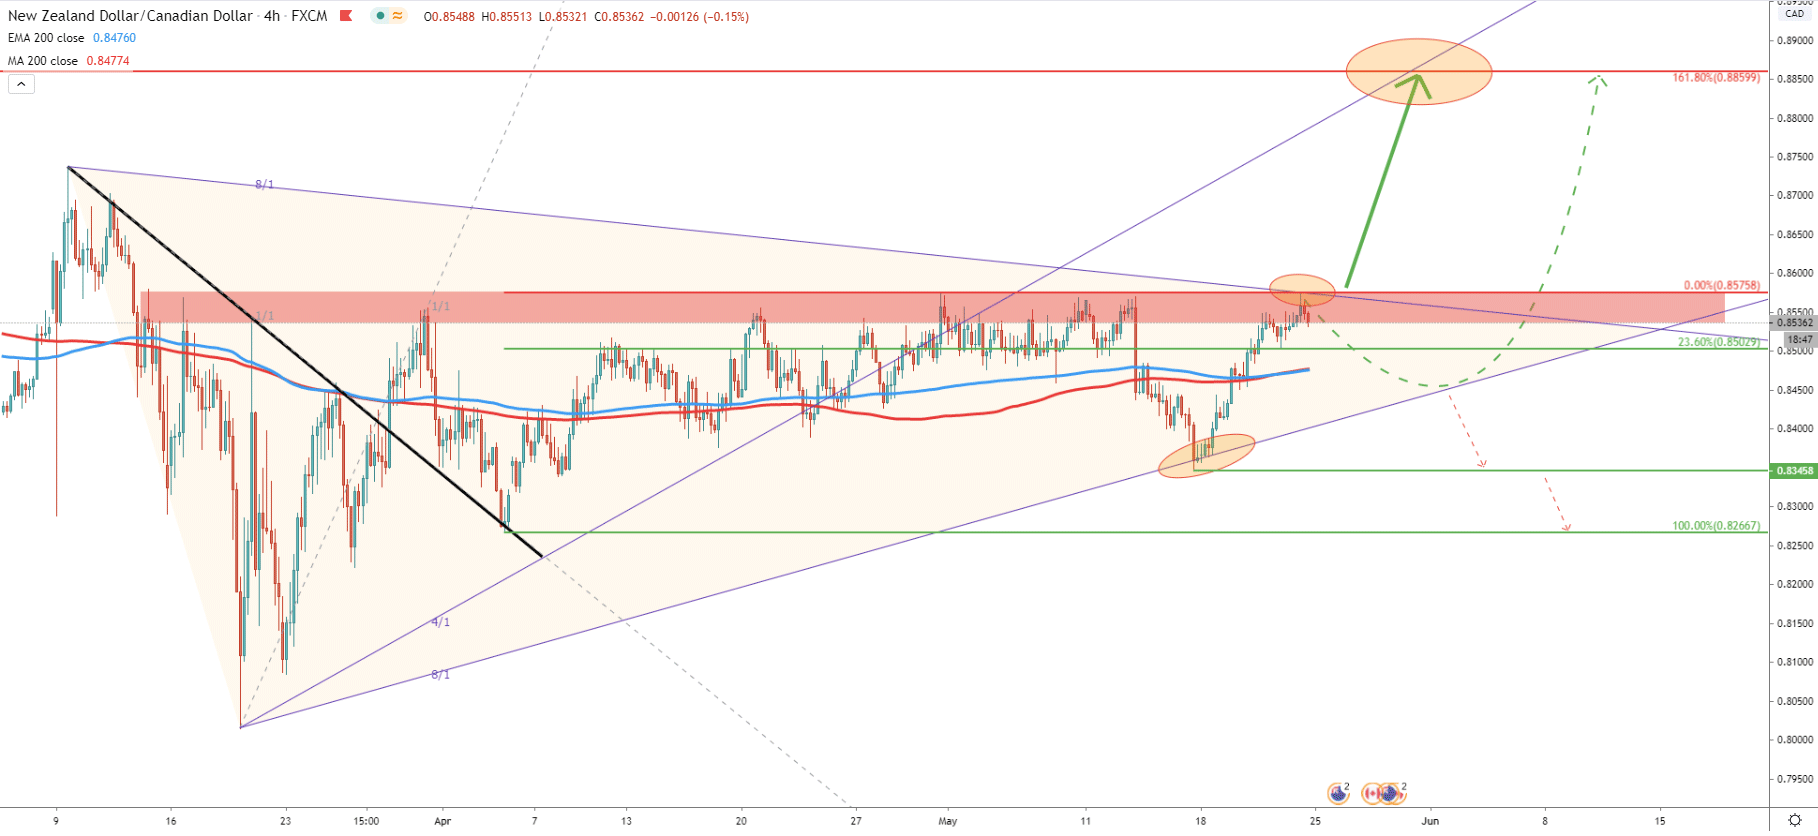
Moving on to the 4H chart, here you can see two Gann Fan indicators applied to the uptrend as well as the downtrend. These indicators produce a triangle pattern, where price currently remains. Perhaps we can say that price has stuck within this pattern and the breakout in the coming week is almost inevitable. The most recent price action shows that NZD/CAD has rejected the 23.6% Fibonacci retracement level at 0.8500. This is also a physiological price and the fact that it has been rejected plays heavily in favour of the buyers.
As long as daily closing price remains above 0.8500, NZD/CAD should be expected to break to the upside. At the same time, price could move lower, to re-test 8/1 Gann Fan trendline before going up. But this scenario would only extend the consolidation and could even result in much stronger correction to the downside.
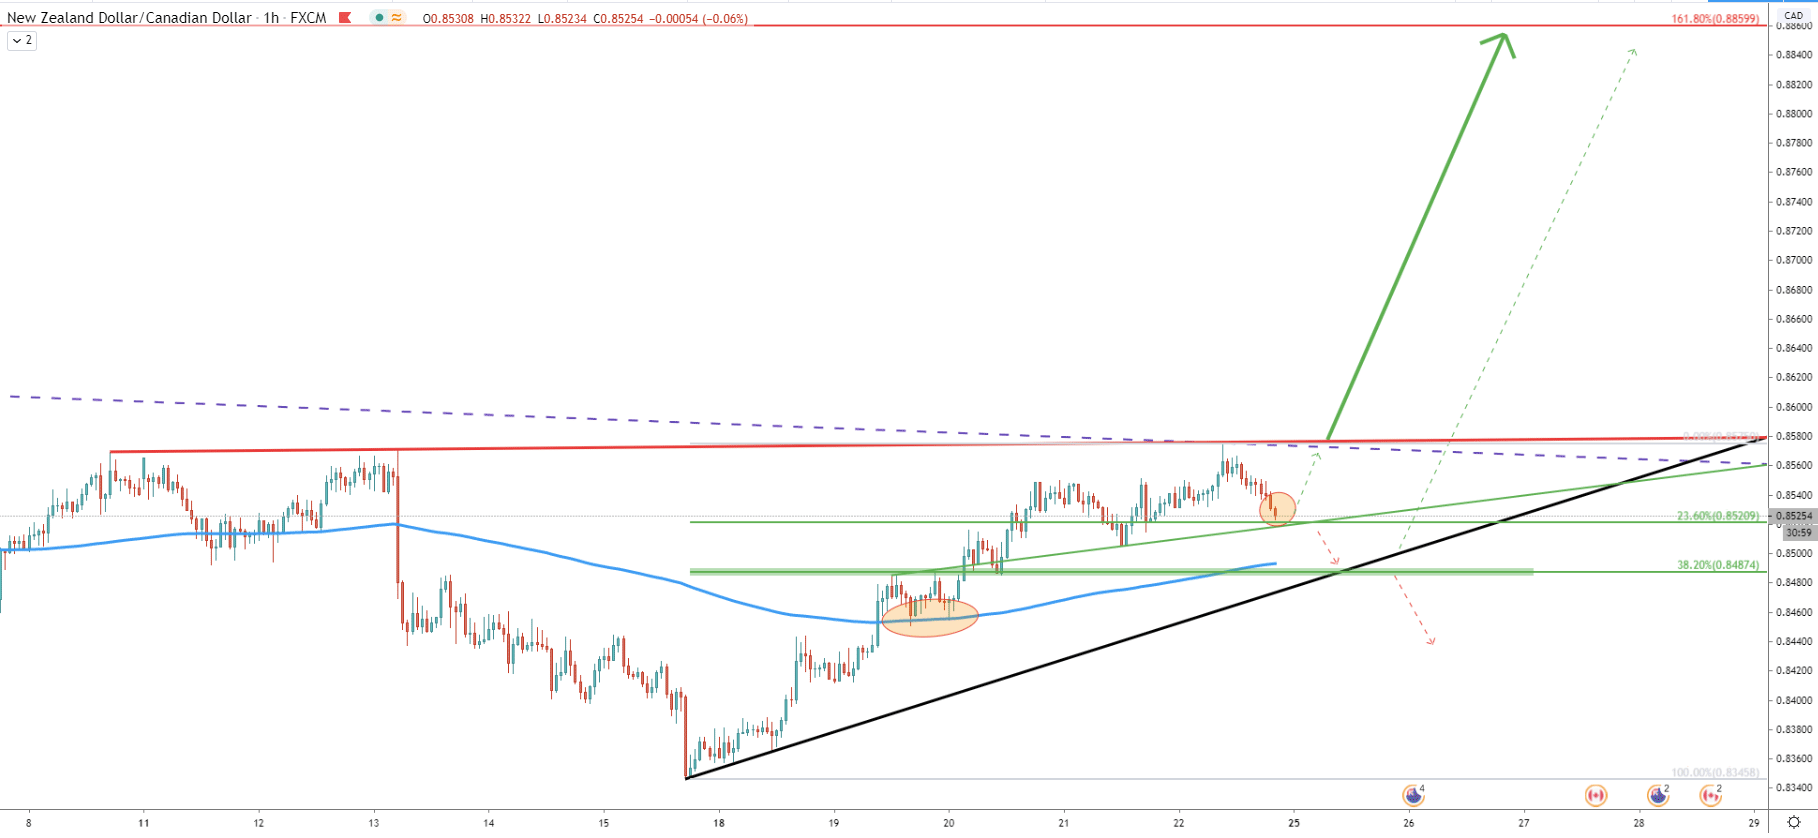
On the 1H chart, price continues to produce higher highs and higher lows confirming the validity of a short term uptrend. We can also see the break above the 200 Exponential Moving Average, after which price corrected down and rejected the EMA twice. Moreover, NZD/CAD remains above the trendline and currently has approached the average price trendline along with the 23.6% Fibs at 0.8520. This could be the point where buyers will step in, making it a very attracting buying opportunity. However, we can still expect spikes on the daily chart, down to 0.8487, before/if the price will start rising strongly. But it is important to watch that the daily closing price will remain above the 0.8500 psychological support.
NZD/CAD is still in the consolidation phase, which is coming to an end at any point. The confirmation of the uptrend would be a break above the most recent high at 0.8575, and this is when big traders are likely to take action. While price remains below this resistance, more range-trading is likely to be seen.
As per the Weekly, Daily and 4H chart, the key resistance could be as high as 0.8560. This is a potential 330 pips growth, equivalent to nearly 4%.
The key support on the low timeframe is seen at 0.8500, which is a technical as well as a psychological support level. Daily break and close below this price should result in the sellers winning the battle, at least in the short term. This scenario will invalidate bullish outlook and NZD/CAD consolidation should be extended further.
Support: 0.8500, 0.8487
Resistance: 0.8575, 0.8860


