Published: August 26th, 2025
Nvidia reported $44.06 billion in sales last quarter, growing 69.2% year over year and 1.8% above analysts' revenue projections. The company's inventory levels significantly improved throughout the quarter, and its earnings per share (EPS) topped analysts' forecasts.
Analysts predict that Nvidia's revenue would increase 54.6% year over year to $46.45 billion this quarter, which would be a slowdown from the 122% gain it saw in the same period last year. It is anticipated that adjusted earnings will be $1.01 per share.
Over the past 30 days, most analysts who follow the company have reaffirmed their projections, indicating that they expect the company to continue on its current trajectory as it reports its results.
Some of Nvidia's competitors in the graphics and processor chip market have already released their Q2 results, which gives us an idea of what to anticipate. Lattice Semiconductor announced flat sales, which were in accordance with consensus projections. Moreover, Qorvo's revenues dropped 7.7% year over year, exceeding analysts' projections by 5.3%.
As share prices have increased by an average of 1.8% over the past month, shareholders in the graphics and processor chips industry have been optimistic about profits. At the same time, Nvidia is up 2%, and the company is expected to reach profits with a typical analyst price estimate of $192.59.
Let's see the complete price outlook from the NVDA technical analysis:
On the daily chart, NVIDIA's stock is trading within an established bullish trend; however, the most recent price has reached an extreme overbought situation. In this context, the expansion of artificial intelligence, versus the nature of the current price movement, is a key dynamic for investors to monitor. Although the fundamental structure is strong, the recent price is moving sideways at an all-time high, suggesting a minor downside correction is pending.
Before taking action, it is important to observe the price action on higher timeframes. On the monthly chart, a bullish Gravestone Doji breakout in April 2025 initiated the bull run, which has continued for five consecutive months. As the current price hovers above the July 2025 high but struggles to overcome the 183.09 monthly high, a considerable downside correction is possible.
The weekly timeframe shows a similar story. A V-shaped recovery swept liquidity from the 100.00 psychological level and moved beyond the 170.00 area. With the price now trading sideways for five consecutive weeks, investors should monitor how it reacts from this premium zone.
According to volume structure, a considerable downside correction is pending. The most active price level since January 2025 is at the 117.18 level, which is nearly 35% below the current price.
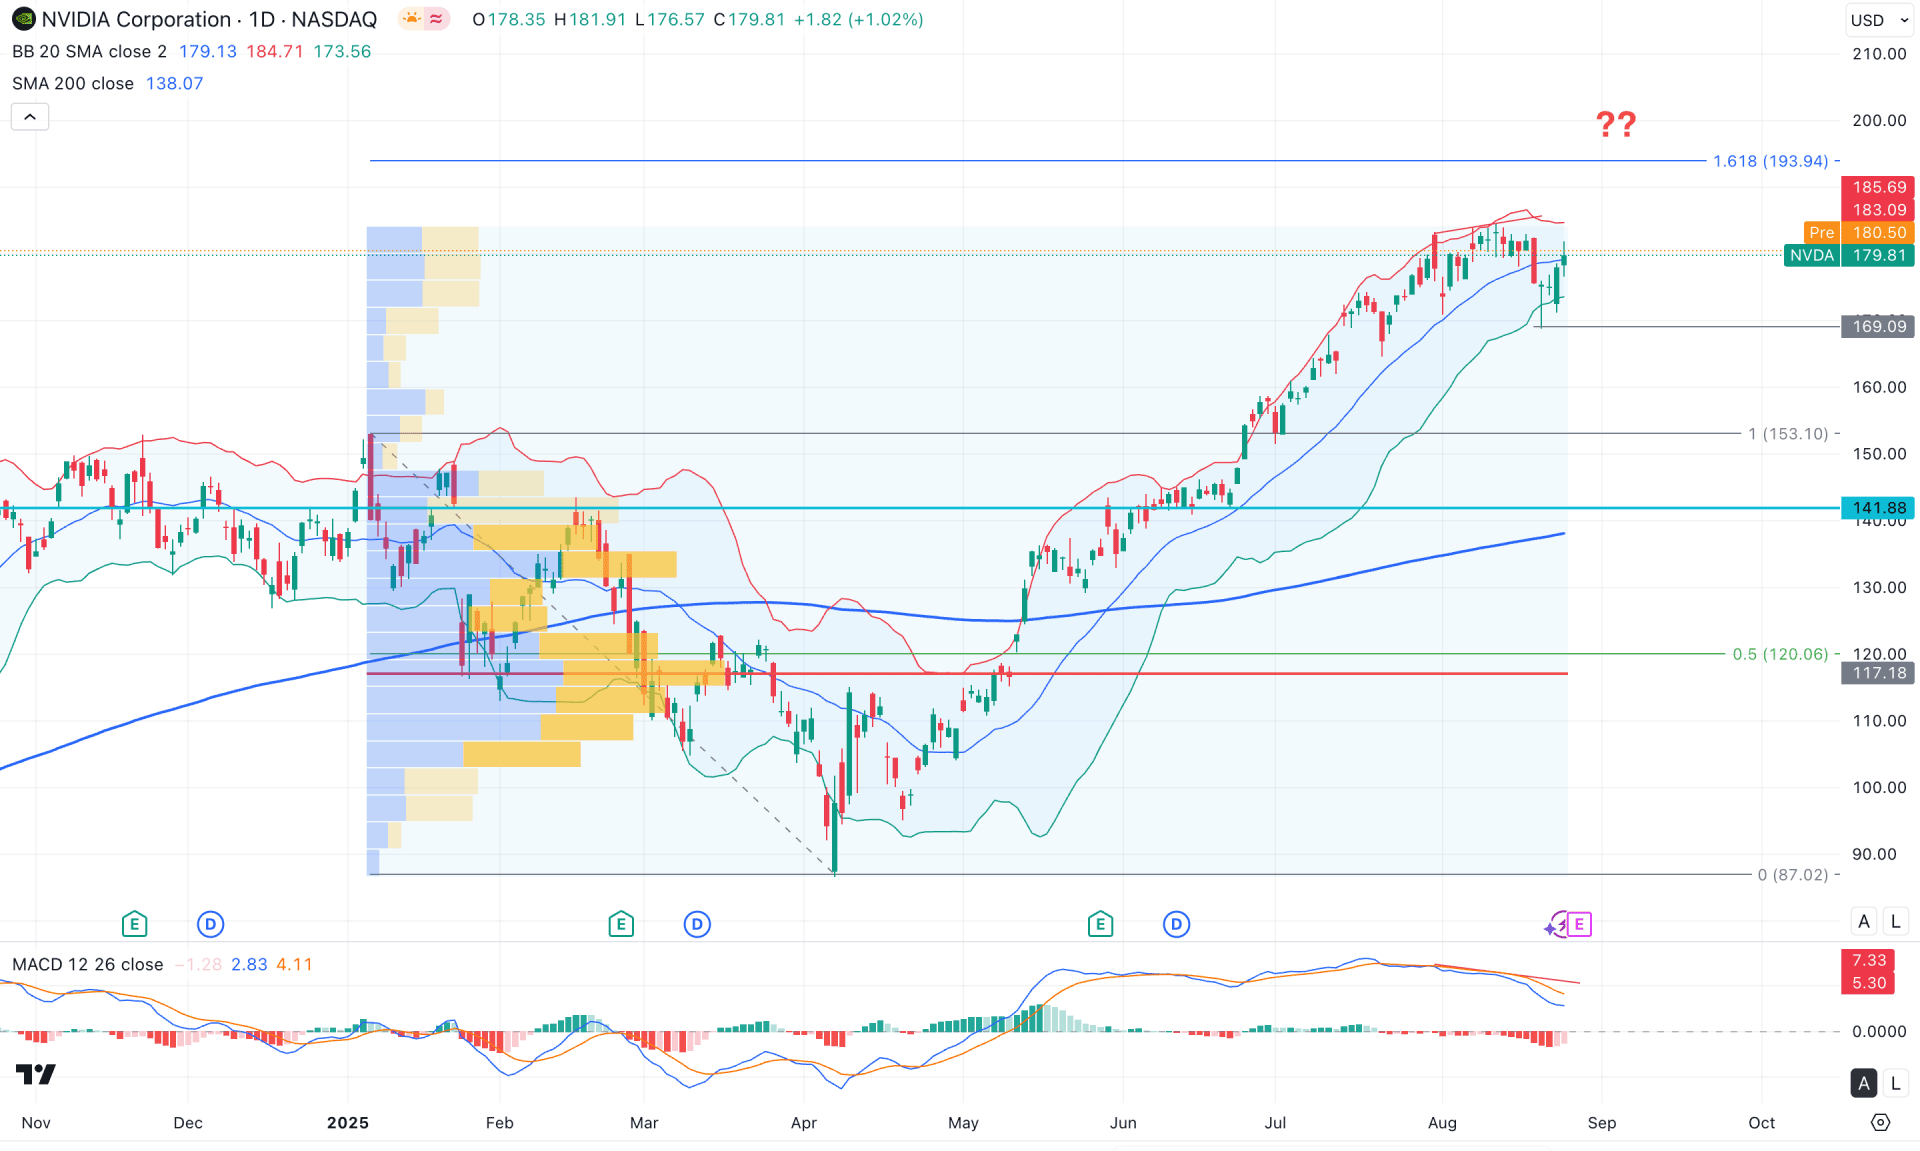
On the daily chart, the most recent price has found support at the lower Bollinger Band and established a base at the crucial 169.09 level. Although the price is testing a trendline resistance, a bullish daily close above the middle Bollinger Band level suggests a bullish continuation opportunity.
However, the MACD signal line has formed a divergence, as it failed to maintain the upward momentum shown on the price chart. This is a sign of a potential top formation, though more confirmation from price action is needed.
In the broader outlook, the 200-day SMA remains below the current price with a bullish slope. However, the wide gap between the price and the 200-day SMA signals an overextended bull run.
Based on this outlook, the primary aim is to anticipate long signals as long as the 169.09 level holds. A consolidation at the middle Bollinger Band could lead to another rally above the 183.09 level to take out upside liquidity. The ultimate bullish target would be the 193.94 level, a crucial extension point before a move above the 200.00 psychological line.
Conversely, a break below the middle Bollinger Band in this sideways market could signal a potential trend reversal. Stronger confirmation would come from a move below the 169.09 level. In that case, primary support is located at the 153.10 level before a test of the 200-day SMA line.
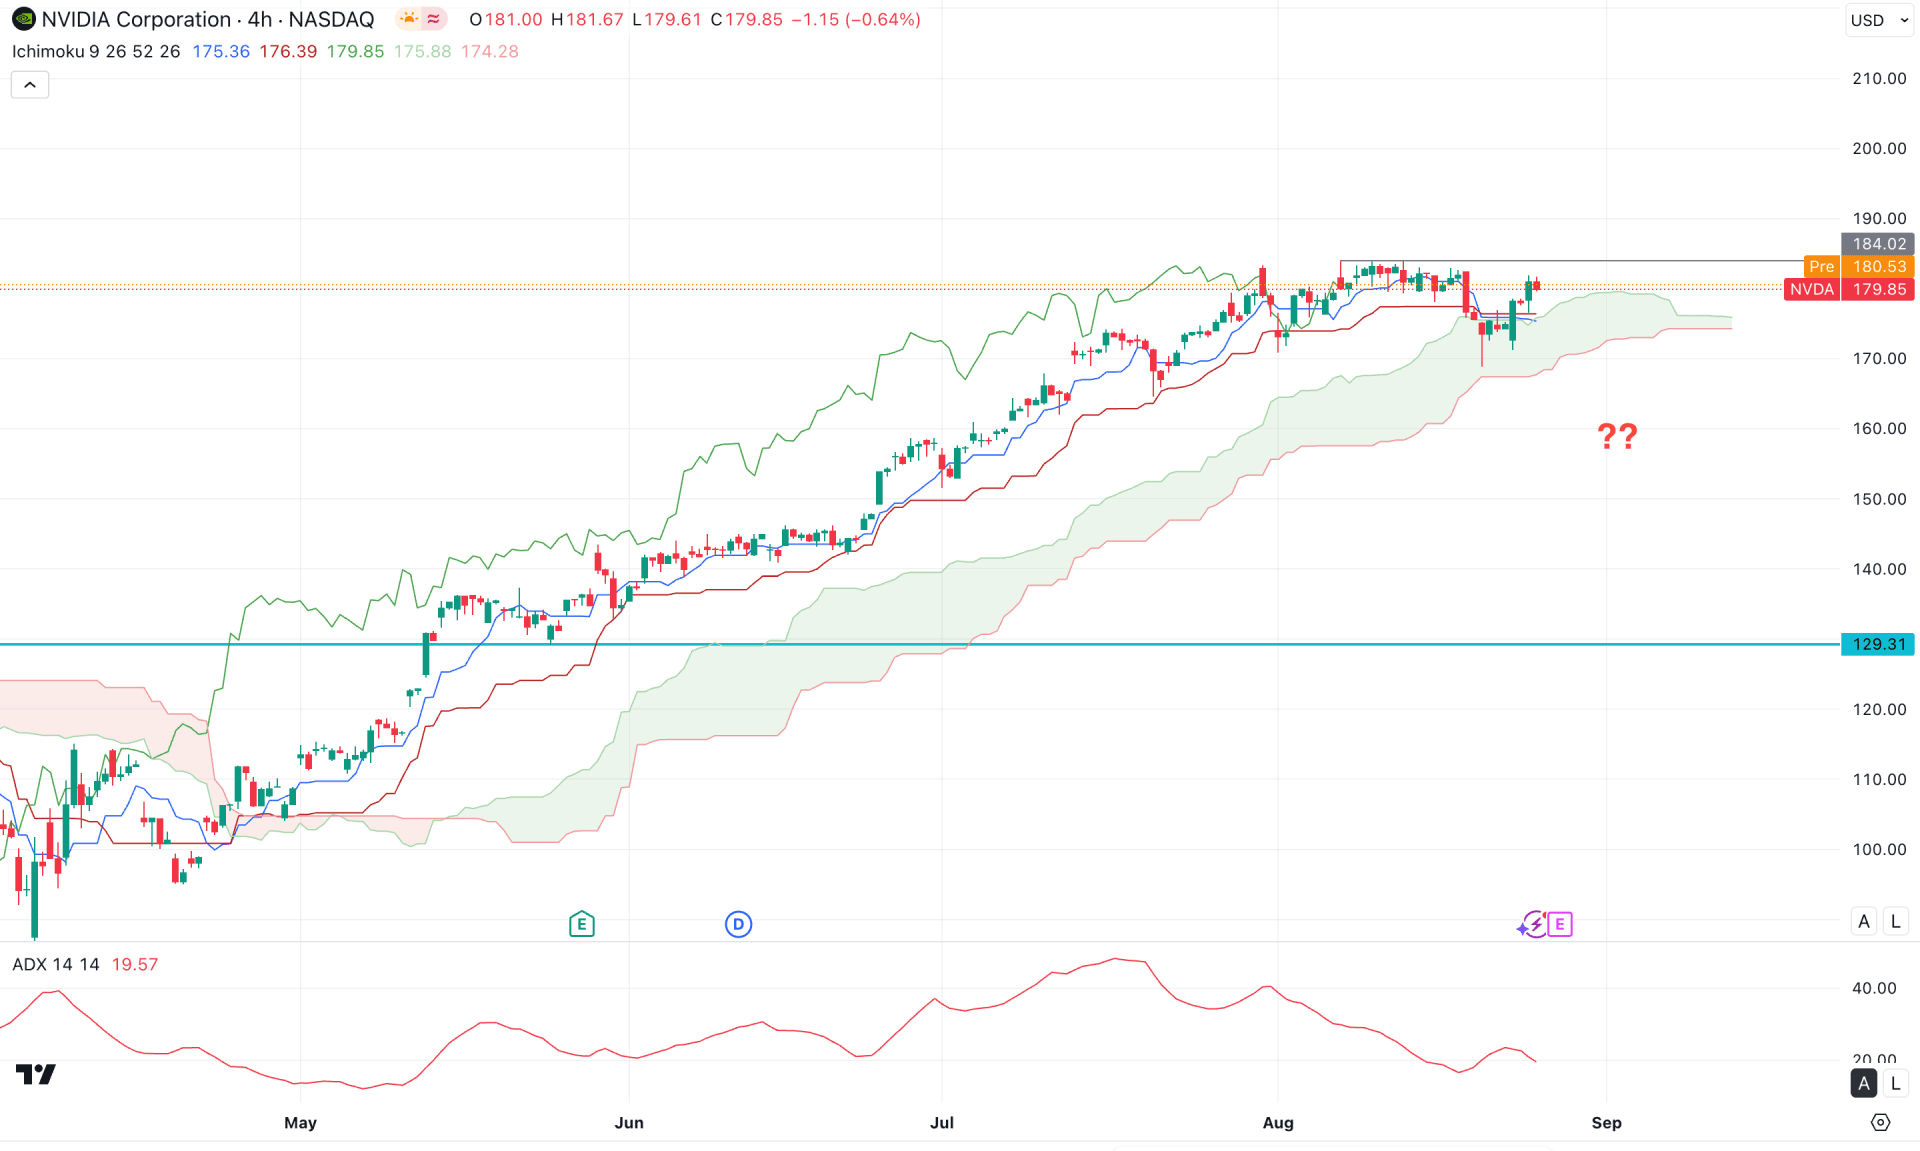
On the four-hour timeframe, a prolonged bullish continuation from April is clear, with the recent price maintaining its bullish momentum from the Kumo Cloud support. However, after the bullish breakout in May 2025, this is the first time the price has returned to the Kumo Cloud area, forming a bullish reversal above the Kijun-sen level. This is primarily a sign of a strong bullish continuation, as a break above the existing resistance of 184.02 would validate the bull run.
In the secondary indicator window, the Average Directional Index (ADX) has lost its momentum and moved below the 20.00 threshold. This is a sign of weakening trend momentum, suggesting a potential shift to a sideways market. A renewed bullish flip in the ADX is needed before anticipating a strong trend.
Based on this outlook, the classical trading approach would be to wait for a four-hour close above the 184.00 level before anticipating a price move toward 200.00. A broader consolidation is possible, but the bullish outlook will remain intact as long as the price trades above 170.00.
The alternative approach is to watch for a bearish swing low below the 168.96 level. From there, any minor bullish correction could present a short opportunity targeting the 150.00 area. However, a bearish Kumo Cloud breakout, consolidated by a close below the cloud, could invalidate the bullish structure and take the price toward the 129.31 level.

On the hourly timeframe, NVIDIA stock is trading within a rectangle pattern, with the most recent price action occurring just below the resistance level of 183.93. A high-volume node exists above the current price, and active selling pressure from institutions is evident today.
On the other hand, the major market trend remains bullish. The moving average wave is acting as a major support band. However, indicator readings show weakness for the bulls, as the volume histogram has started to lose momentum and has reached near a neutral point.
Based on this outlook, a bullish break toward the trend with a four-hour close above the 183.93 level could present a potential long opportunity, aiming for the 200.00 level.
However, the price is at a peak. A bearish liquidity sweep from the resistance area, followed by a rejection and a break below the 172.13 level, would invalidate the bullish structure and initiate a protracted correction.
Based on the major market structure, NVIDIA stock is trading within an established bullish trend, but the recent price has reached a peak where a possible top formation could initiate an extended downside correction. Investors should closely monitor the upcoming earnings report. A failure to provide better-than-expected results could be the earliest sign of a trend reversal. However, given that AI adoption is at its peak and the major market trend is bullish, a continuation is possible if a bullish breakout appears.


