Published: May 20th, 2026
Nvidia (NVDA) will release its earnings report this week, and it is going to be the most-awaited event for the session.
In the AI processor market, Nvidia is facing increasing competition, particularly from Cerebras (CBRS), which went public last Thursday.
While Google (GOOG, GOOGL) and Amazon (AMZN) are still growing their own companies, rival AMD (AMD) is getting ready to introduce its rack-based server solution later this year.
According to Amazon's most recent earnings report, its semiconductor division currently generates over $20 billion in sales annually and is expanding at triple-digit yearly rates.
Similar to Amazon, Google has agreed to supply Anthropic with its TPU processors through a multigeneration, multigigawatt contract, according to The Information.
Following President Trump and CEO Jensen Huang's trip to China for an event with Chinese President Xi Jinping, Nvidia released its results. Trump said on Friday that China is concentrating on creating its own AI processors, despite investors' hopes that Xi will consent to import the company's chips into the nation.
According to analysts' consensus forecasts, Nvidia is anticipated to announce earnings per share (EPS) of $1.76 on sales of $78.75 billion for the first quarter. Compared to the $0.96 and $44.06 billion the corporation saw in the first quarter of the previous year, that is an increase.
With a total $72.85 billion in revenue, Nvidia's data center division is expected to account for the majority of its earnings. In the same time frame last year, the company's data center sales totalled $39.11 billion.
$60.53 billion of the total $72.85 billion is anticipated to follow from computing, with Nvidia's networking division accounting for the remaining $12.45 billion. Also, the company's gaming division will bring in $3.64 billion, a 3.26% decrease.
Let's see the complete outlook of this stock from the NVDA technical analysis:
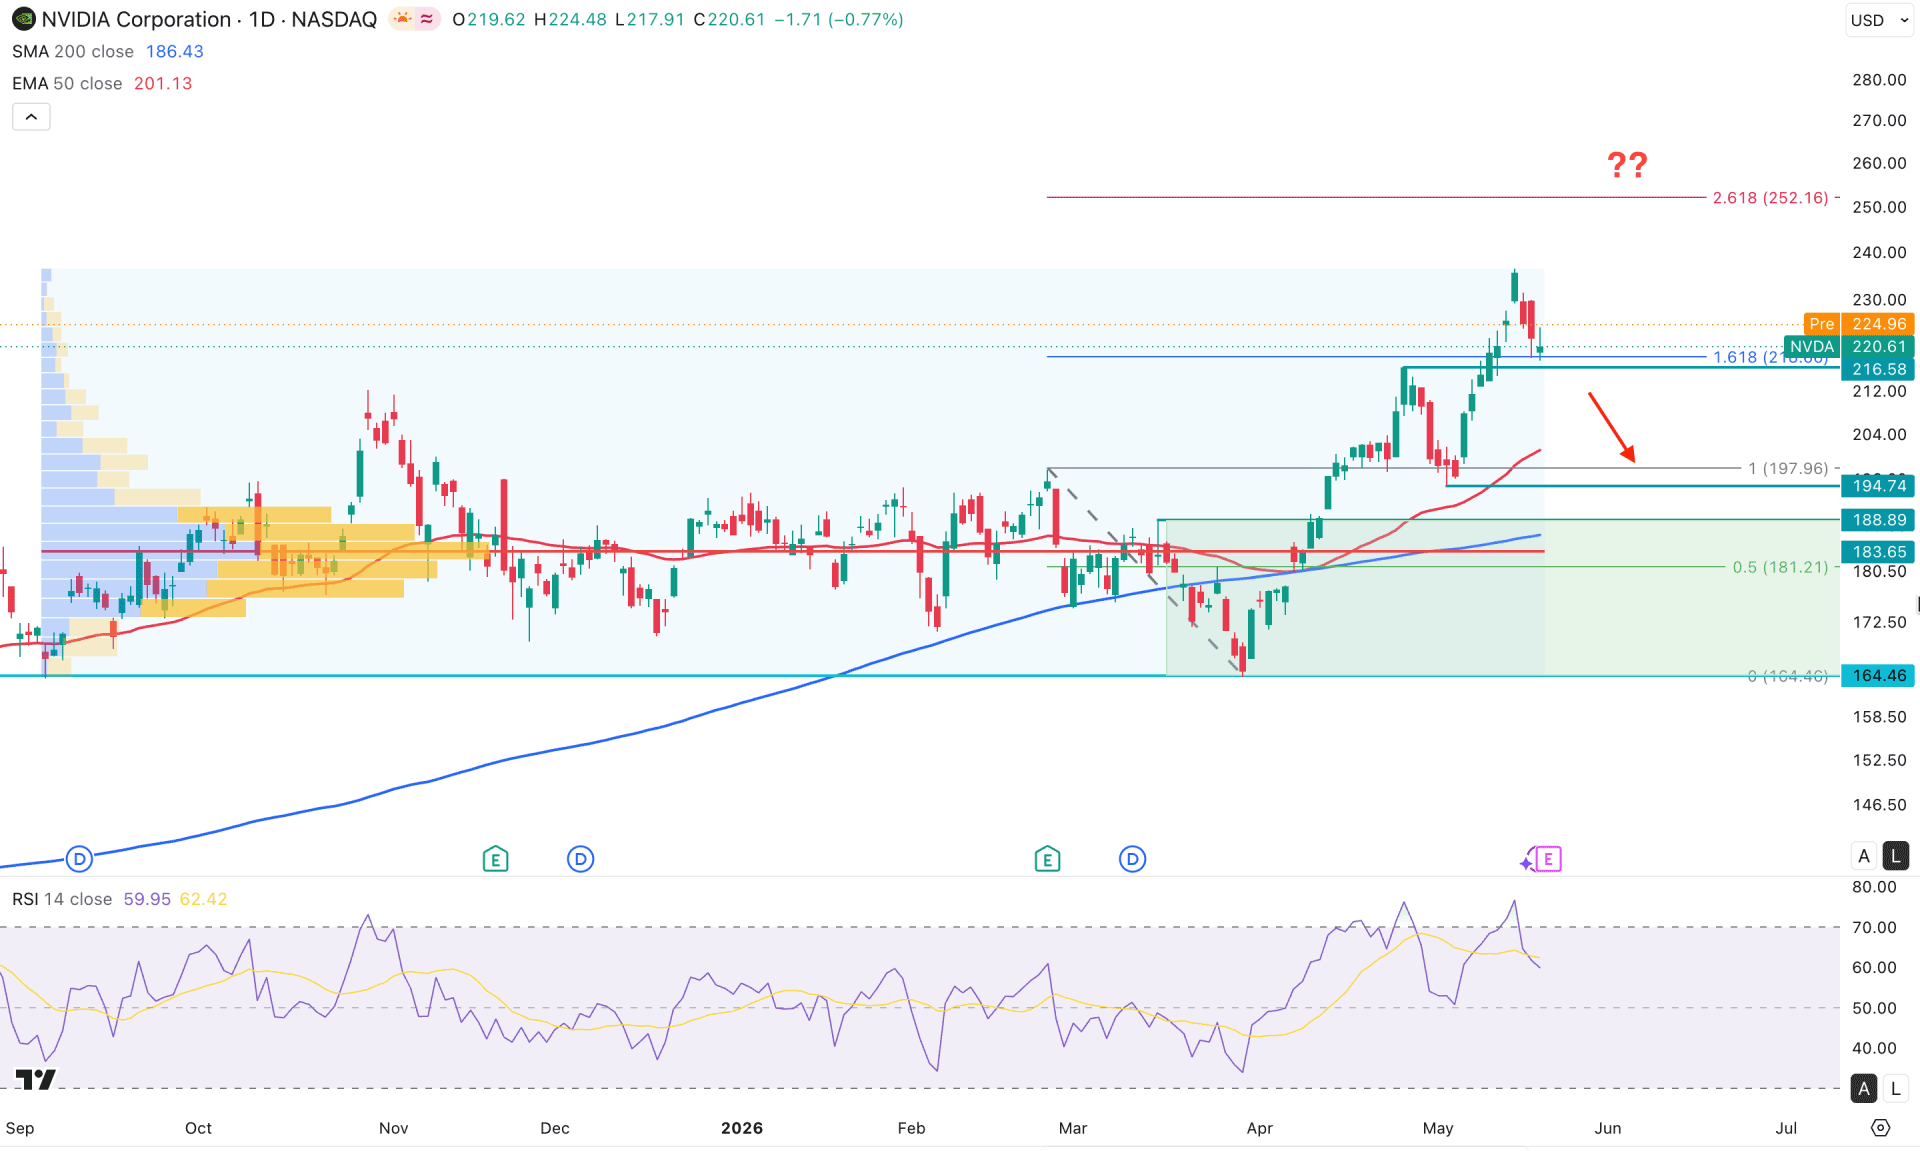
In the daily chart of NVDA, the ongoing demand in artificial intelligence keeps the momentum bullish for a considerable time. As the existing market pressure is extremely bullish, investors should remain cautious before taking any short position. Moreover, taking long positions from a historic high level often creates fear of having a floating loss for a certain period. In that case, investors should remain sceptical before opening any trading position in NVDA stock.
Before getting deeper into the daily price action, we will see the broader context on the monthly timeframe. Strong consolidation is visible since September 2025, as the price remained sideways before creating a new high with a valid monthly close in April 2026. It is a sign of a long-term bullish continuation opportunity following the major market momentum. The weekly timeframe shows a similar story where rally-base-rally is clear, and the current price is running within a strong bullish trend.
In terms of volume, the buying pressure is also valid, as the largest activity level in September 2025 is within the consolidation and below the current price. As long as the price remains above the 183.655 level, we aim to look for long trades only.
Looking at the price action, the existing market momentum is solid for buyers, but the recent break above the 216.58 level came with an immediate reversal. The price is now testing this line as support, and investors should closely monitor how the price reacts from this level. Primarily, a failure to hold above this line would signal a buy-side liquidity grab, which can take the price below the 194.74 support area.
The 200 SMA and 50-day EMA lines are below the current price and have a bullish slope, suggesting confluence buying pressure. However, the extreme bullish condition above the existing swing high creates a possibility of retesting these dynamic levels before offering another long wave.
The Relative Strength Index follows the same structure, as multiple attempts have been seen above the 70.00 overbought level with a failure to hold momentum. It is a sign of a possible correction, even if there is no clear divergence.
Based on the current market structure, the immediate support to look at is the 194.74 level for a bullish opportunity. However, a deeper correction is also possible, which can take the price to the 188.89 area or even the 164.46 area. On the bullish side, the ultimate target would be the 252.16 Fibonacci extension level before heading above the 300.00 psychological mark.
On the other hand, short-term short opportunities could come after a rejection from the 216.58 level, but an impulsive bearish pressure with a daily close below the 200 SMA could initiate an extended correction towards the 164.46 area.
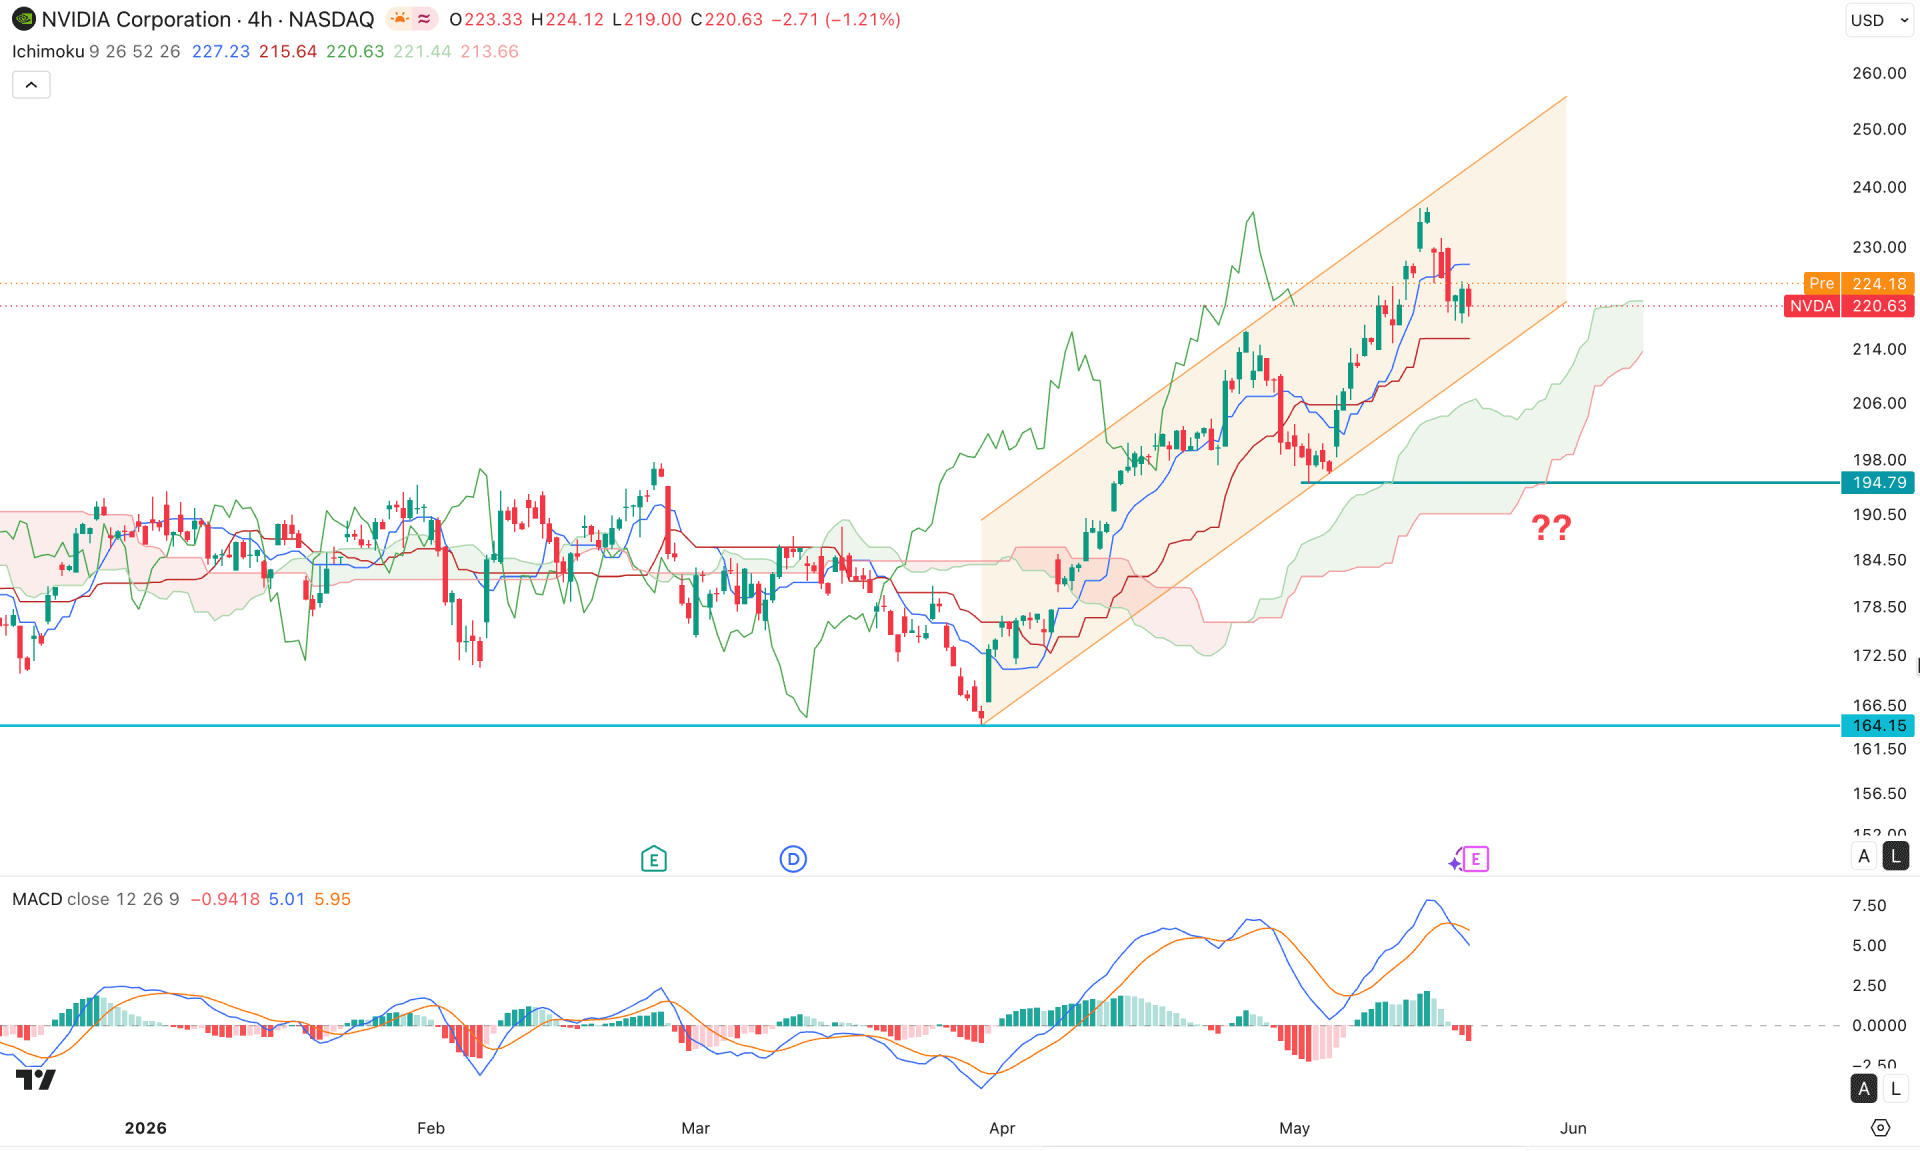
In the H4 timeframe, the price is trading within an ascending channel, as the recent price has more room to grow to the upside without validating the channel support. The existing price section is above the Kumo cloud, where higher future clouds are supportive of buyers.
Corrective market momentum is seen as a bearish candle that was closed below the Tenkan-sen line. In that case, investors should monitor how the price reacts after testing the channel support, as a possible rebound with a liquidity sweep from the support area is possible.
The indicator window suggests a correction possibility, as the signal line has made a bearish crossover at the bullish peak. Moreover, the histogram remains below the neutral line by forming multiple red particle lines, which signal selling pressure in the market.
Based on this outlook, a downside correction is possible towards the channel support, but it can extend up to the 194.79 cloud support area. Below this line, the next support level is at the 164.15 level, from where a deeper correction can happen.
On the bullish side, a rebound from the near-term support area with a valid bullish candlestick above the Kijun-Sen level could open a long opportunity targeting the 250.00 area.
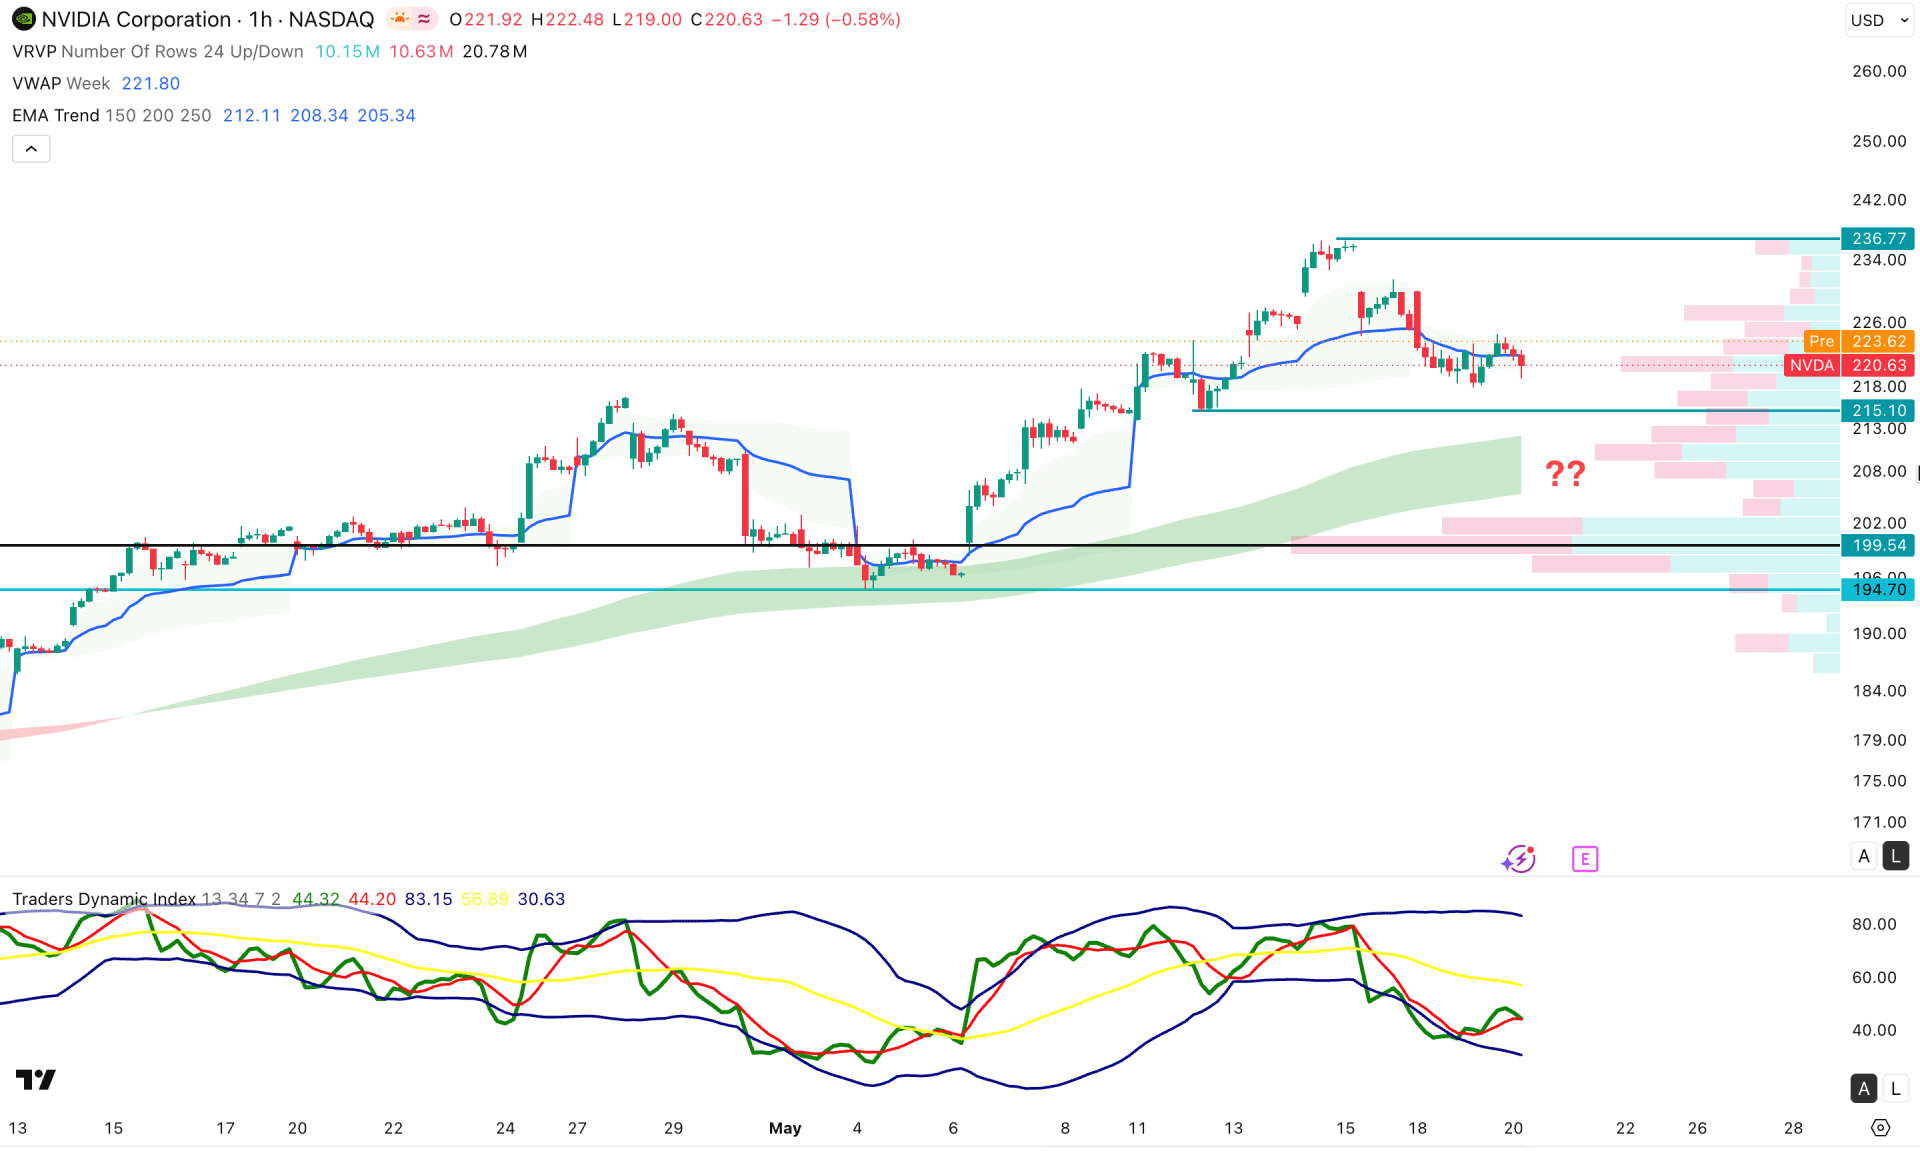
In the hourly timeframe, the recent price is trading sideways with a bullish EMA wave, where the EMA is the immediate support to look at. The weekly VWAP level is close to the current price, signalling corrective market momentum.
On the other hand, the high-volume line is below the entire structure and hovering just below the 200.00 psychological level. The Traders Dynamic Index is also covering the bearish zone, as the current line is seen below the 50.00 neutral point.
Based on this outlook, an extended consolidation condition is possible, where the immediate support is at the 215.10 level. Below this line, the EMA wave would be tested before continuing the bullish wave.
Based on this structure, overcoming the 236.77 resistance level could be a remarkable achievement, as it could open room for moving towards the 350.00 area.
Based on the overall market structure, the stock is still in an overbought condition, and no clear top is found. Moreover, the recent consolidation in the monthly timeframe signals strong buyer interest, even if the price is in a premium zone.
In that case, long-term bullish continuation is highly possible, and any rebound from the near-term support area with a valid liquidity grab could be a trend-following opportunity.


