

Published: August 26th, 2026
Nvidia stock (NVDA) has dropped in reaction to profits in six of the previous eight quarterly periods, including the most recent four. Nvidia (NVDA) will face this frustrating truth on Wednesday night when it releases its must-read earnings.
In actuality, the market is set up for CEO Jensen Huang to appear really optimistic during the earnings call and for the business to post something fantastic.
Nvidia launched a significant project earlier this month that would help increase funding for AI infrastructure, such as data centers and processor acquisitions. The semiconductor titan declared a week later that it will support a sizable data center complex in southern Ohio. With these transactions, investors are beginning to become concerned that Nvidia is going too far.
Nvidia revealed at a chip industry conference this week that its new Vera Rubin servers are expected to begin shipping in the 3rd or 4th quarter of this calendar year. It will be positive for the business if that timing remains true.
Nvidia has been downplaying the possibility of allowing sales of its top chips in China and the United States for more than a year. However, rumors that Chinese authorities are becoming more receptive to Nvidia's H200 processor sales in the country have recently surfaced. Nvidia's sales could be significantly impacted if the world's second-largest AI market appears to be thawing.
Nvidia continues to have among the greatest gross margins in the IT industry, at about 75%. Customers now have more options due to higher memory prices and growing competition from customized chips and innovative processor types, and Nvidia may face more resistance when trying to pass on higher costs.
Let's see the full outlook of this stock from the NVDA technical analysis:
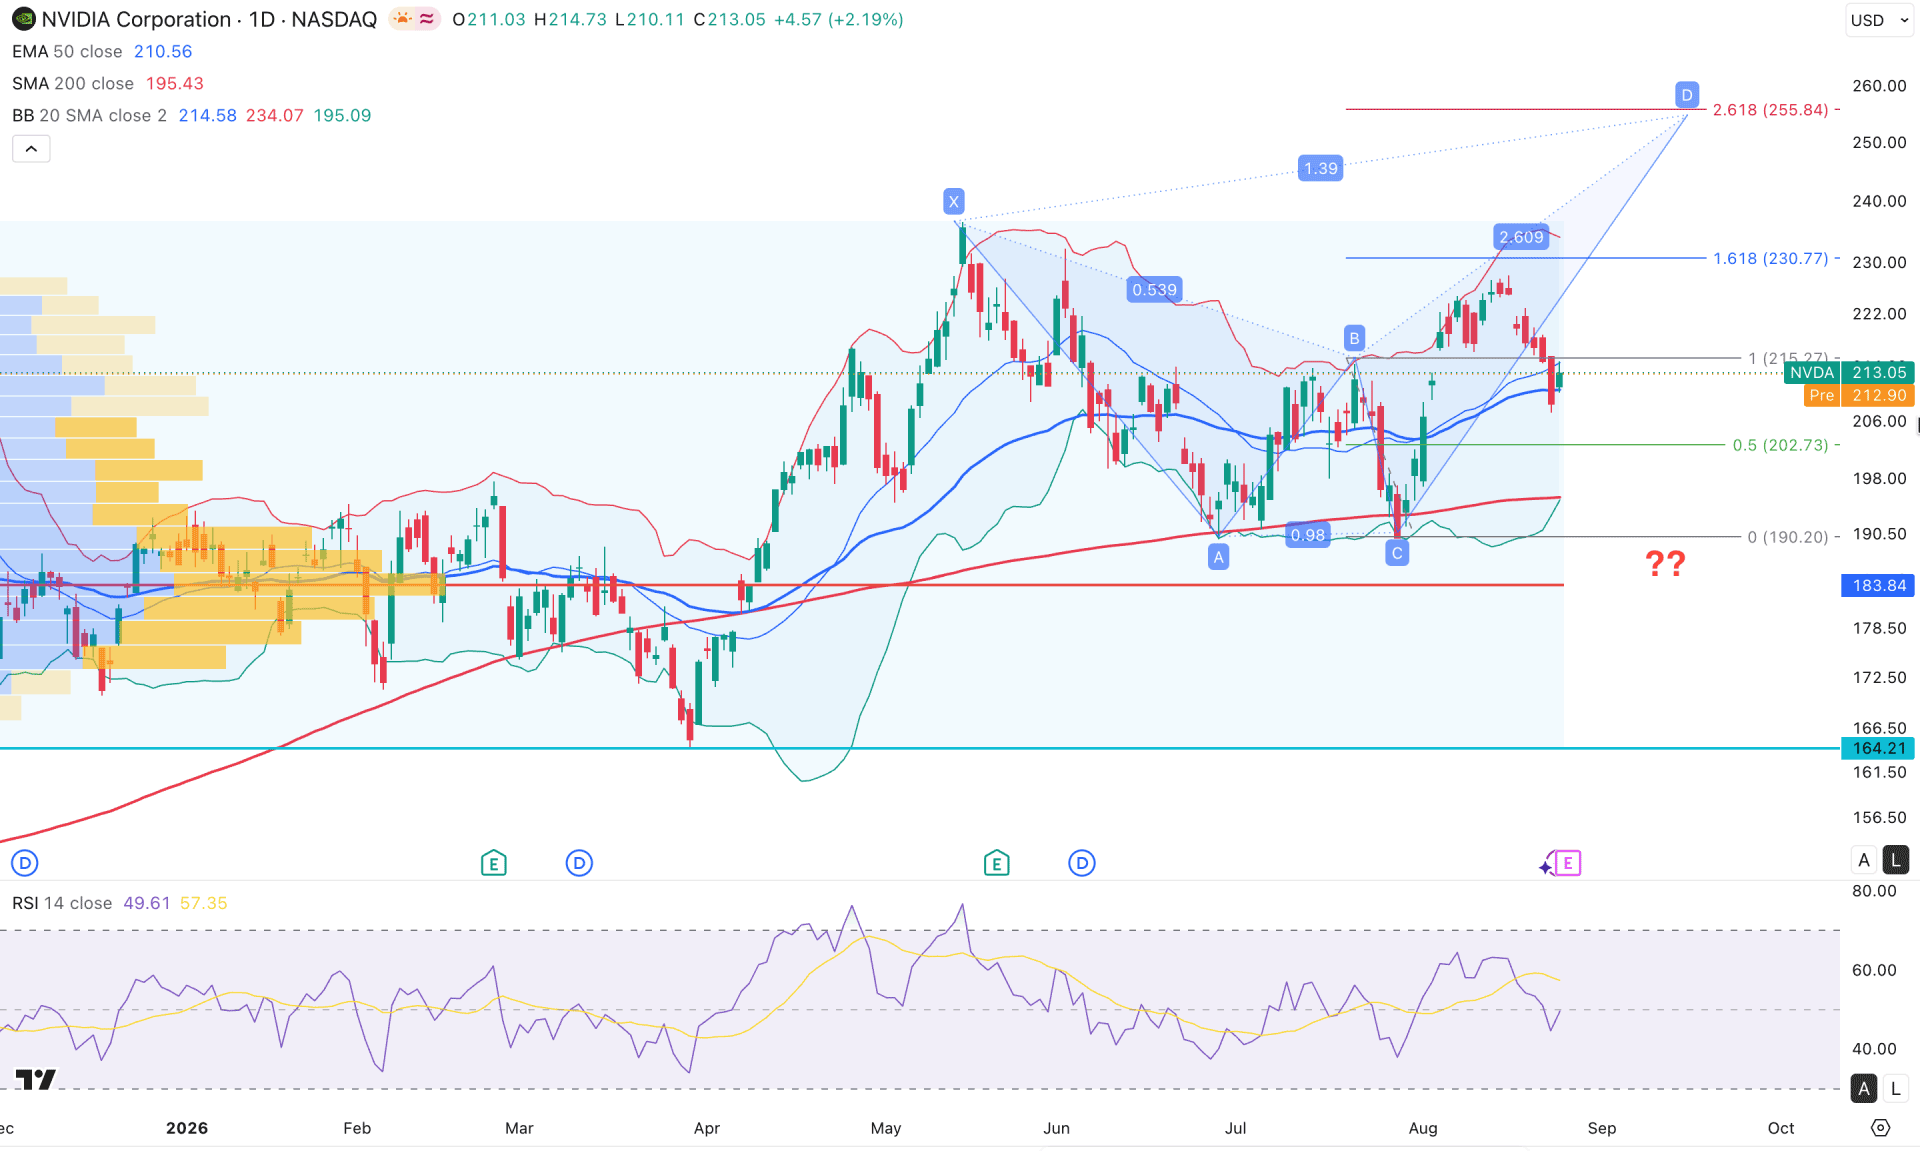
On the daily chart of Nvidia stock, recent price action shows corrective momentum, while the overall market structure remains bullish. Price is trading in the extreme bullish zone, from where a bearish rebound can form at any time.
Looking at the higher timeframe, the monthly candle suggests ongoing buying pressure, while the recent structure is corrective. The weekly timeframe is signalling a premium zone, as the recent price is trading higher with a range breakout. However, a decent downside correction is pending.
In terms of volume, buyers are still favourable, as the largest activity level since December 2025 is at the 183.84 level, which is below the current price.
In the main price chart, a sideways market is visible above the 50-day EMA level. However, the gap between the upper Bollinger Band and the lower Bollinger Band is expanding, creating room for a downside correction.
In the secondary indicator window, the Relative Strength Index (RSI) is in the extreme neutral zone, while the current line has remained around the 50.00 area for a considerable time.
Based on the overall market structure, the recent price is facing selling pressure after forming a bullish break above the 215.47 resistance level. In that case, a failure to hold momentum above the mid-Bollinger Band line could increase the possibility of forming a bearish correction towards the 200 SMA area. A failure to hold momentum at the 190.20 level could invalidate the bullish possibility and initiate an extended correction towards the 164.21 level.
On the other hand, a bearish butterfly pattern is emerging, where the final leg is yet to form above the existing all-time high level. In that case, an immediate bullish rebound from the 50-day EMA could increase the possibility of taking the price even higher and testing the 255.84 Fibonacci Extension level before validating the butterfly pattern.
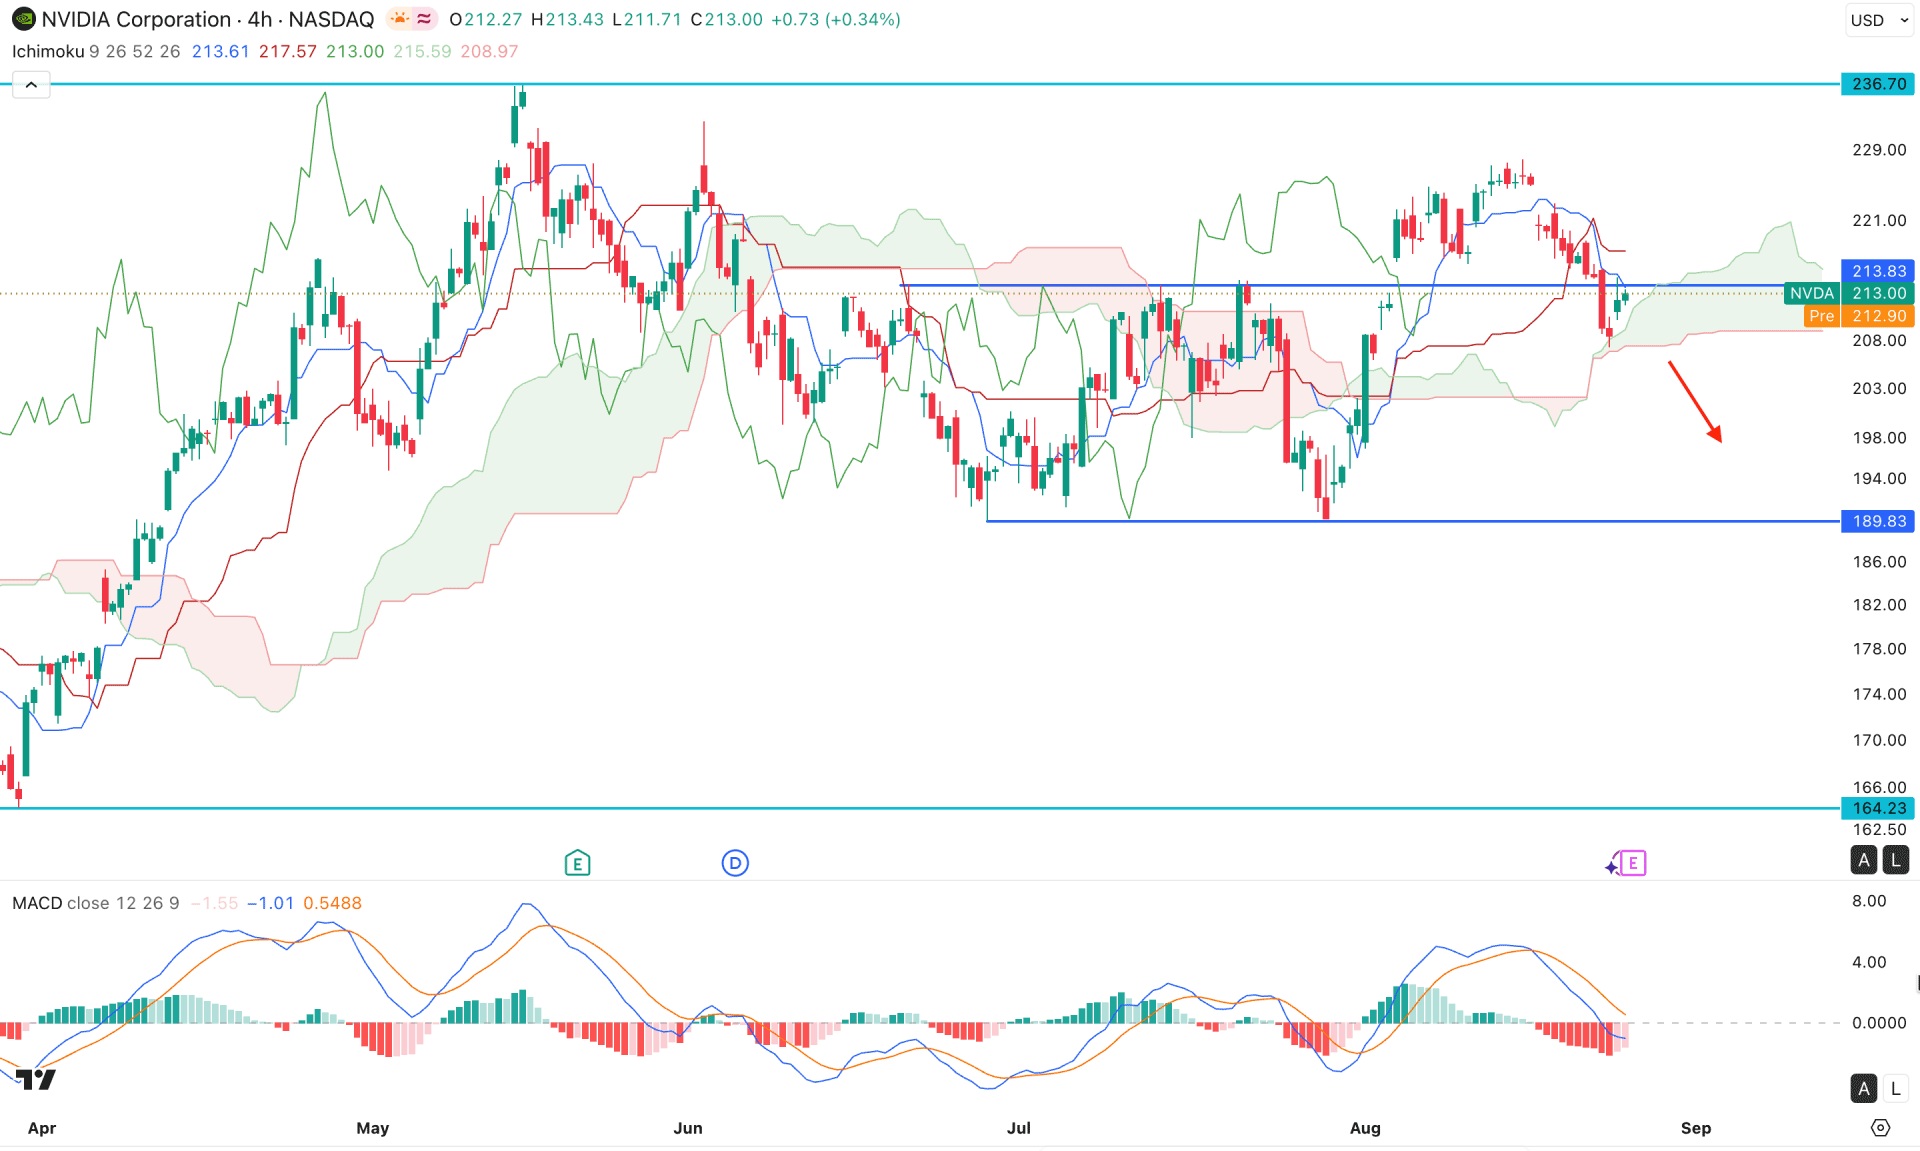
On the NVDA H4 chart, price has shown a decent bullish recovery above the cloud support area but failed to hold momentum before moving sideways. As a result, a rectangle bullish breakout is visible, while the most recent price has returned to the rectangle area. Still, the cloud support is acting as a barrier to sellers, which needs to be violated before forming any bearish rebound.
In the future cloud, both lines are heading upward, signalling a bullish continuation possibility. However, the recent price is trading below the dynamic lines, which signals pressure on buyers.
The secondary indicator window shows a different story, where the MACD histogram is holding an extended position below the neutral level, with a crossover in the signal line.
Based on the structure, failure to hold the price above the 213.83 resistance level, with an immediate recovery below the cloud support, could open the possibility of testing the 189.83 level before forming a bullish rebound. On the other hand, the price is trading within a descending channel, from where a valid recovery above the Kijun resistance level could offer an immediate long opportunity targeting the 236.70 resistance level.
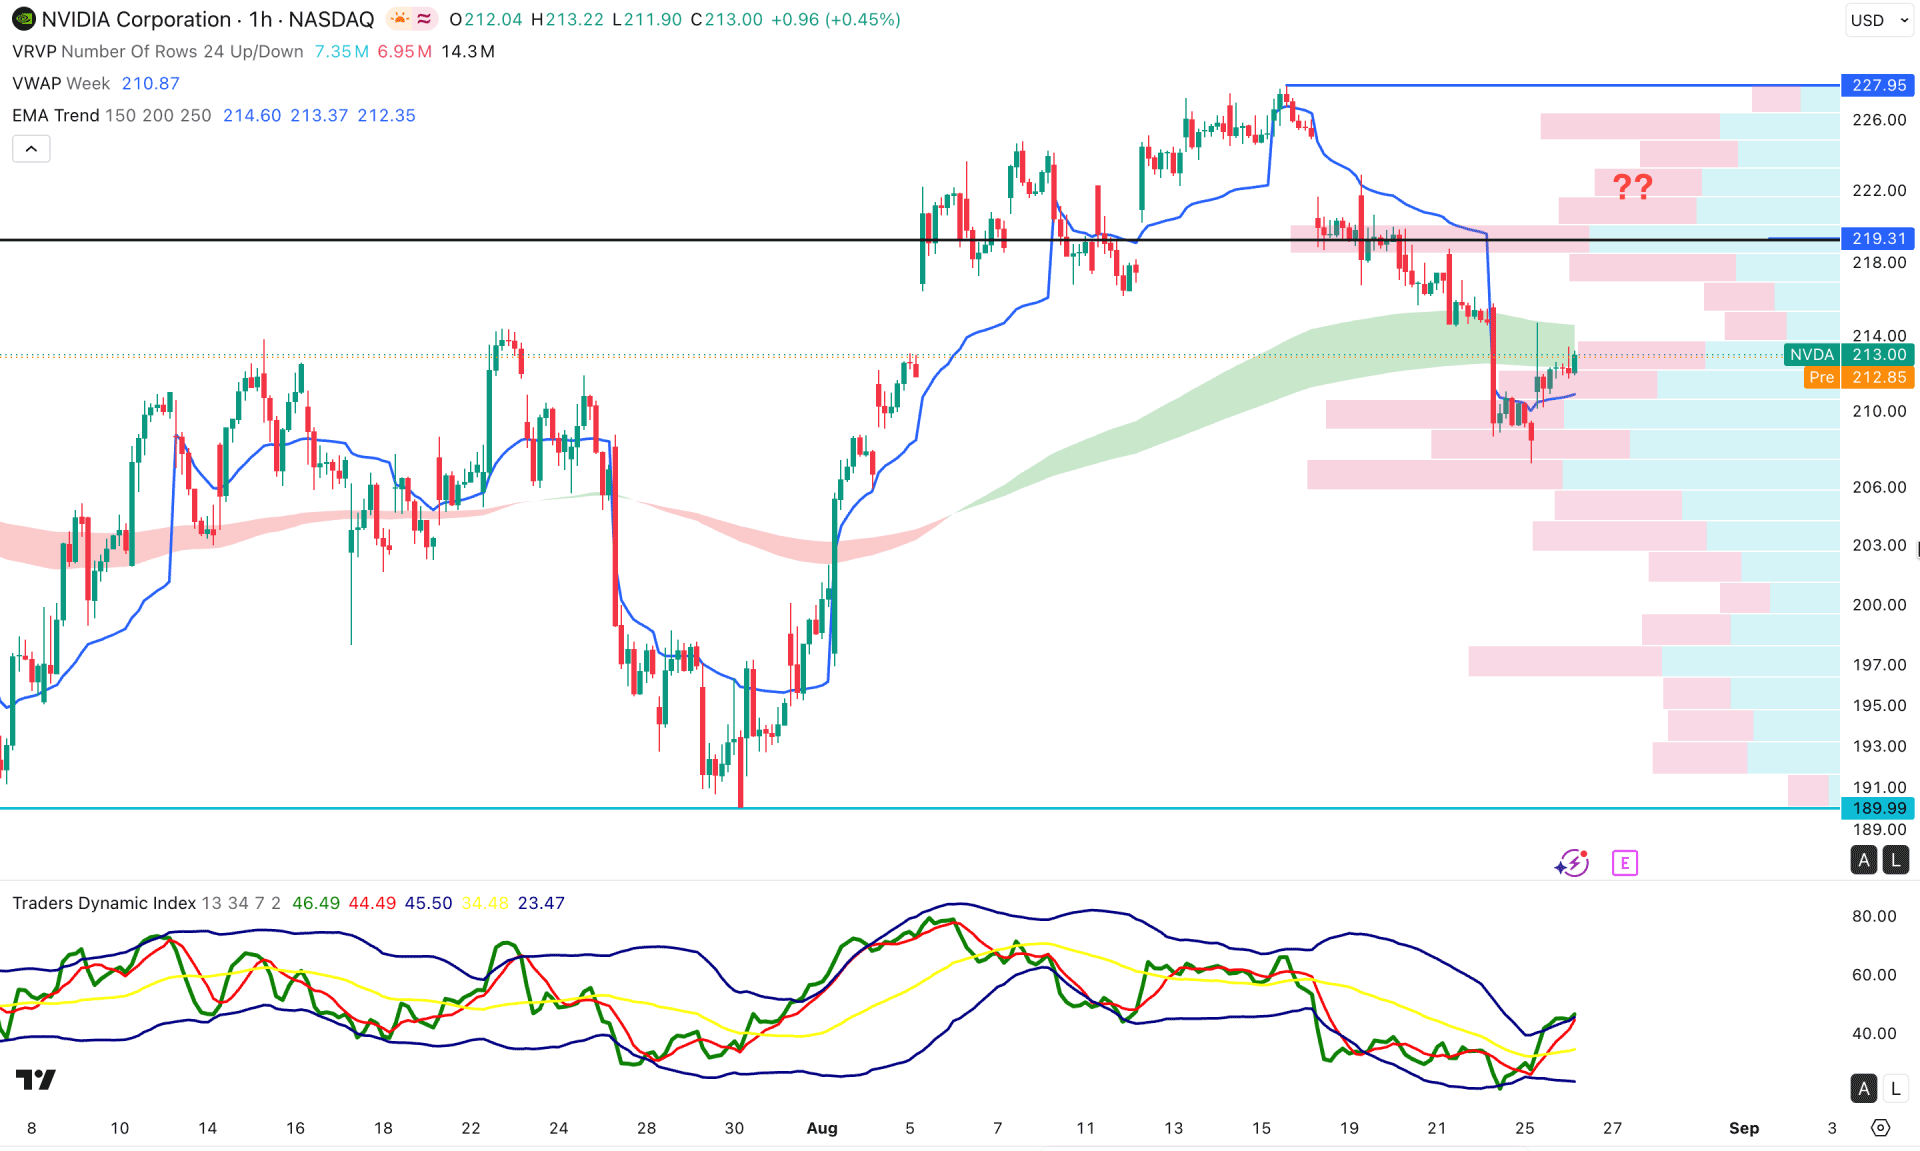
On the hourly timeframe, price is trading higher after forming a new high, while the most recent price is below the EMA wave. However, the weekly VWAP level is sideways and below the current price, with minor buying pressure, and the internal structure is bullish.
In the secondary indicator window, the Traders Dynamic Index is hovering around the 50.00 neutral line, which signals a possible bullish correction in the market. However, the current line is at the bullish peak area, from where a rebound is possible.
Based on this market outlook, a failure to hold the price above the VWAP level, with a bearish recovery, could increase the possibility of testing the 189.99 support level.
However, the current market structure is bullish, from which a recovery above the 219.31 level could validate the bullish structure at any time.
Based on the overall market structure, Nvidia stock is still trading within a bullish trend, where there is no sign of exhaustion at the top. The price has room to move higher and test the near-term resistance level before forming any bearish rebound opportunity.


