Published: February 25th, 2025
Despite the market volatility, Nvidia's upcoming quarterly outcome could be worth watching. The company, with a $3.29 market cap, holds the largest position in the S&P 500 and Nasdaq, along with AAPL and MSFT.
In terms of effectiveness and performance, DeekSeek's AI technology is said to be on par with or better than its US rivals; among other large language models (LLMs), its chatbot even competes with OpenAI's ChatGPT. Therefore, Nvidia's response to this would be another crucial factor to consider.
Following the Trump administration's tariff actions, economic uncertainty has returned, increasing investor anxieties in the United States. The S&P 500 and Nasdaq have seen steep drops in recent trading sessions after reaching all-time highs last Tuesday, and the market mood has been fluctuating erratically.
As the accompanying chart illustrates, Nvidia's stock has been a major contributor to overall market growth in recent years.
Positively, it is anticipated that Nvidia will increase its Q4 sales by 70% to $37.72 billion from $22.1 billion in the same quarter the previous year. Analysts predict that Q4 earnings will be $0.84 per share, up 61% from $0.52 during the prior quarter.
Let's see the future price direction from the NVDA technical analysis:
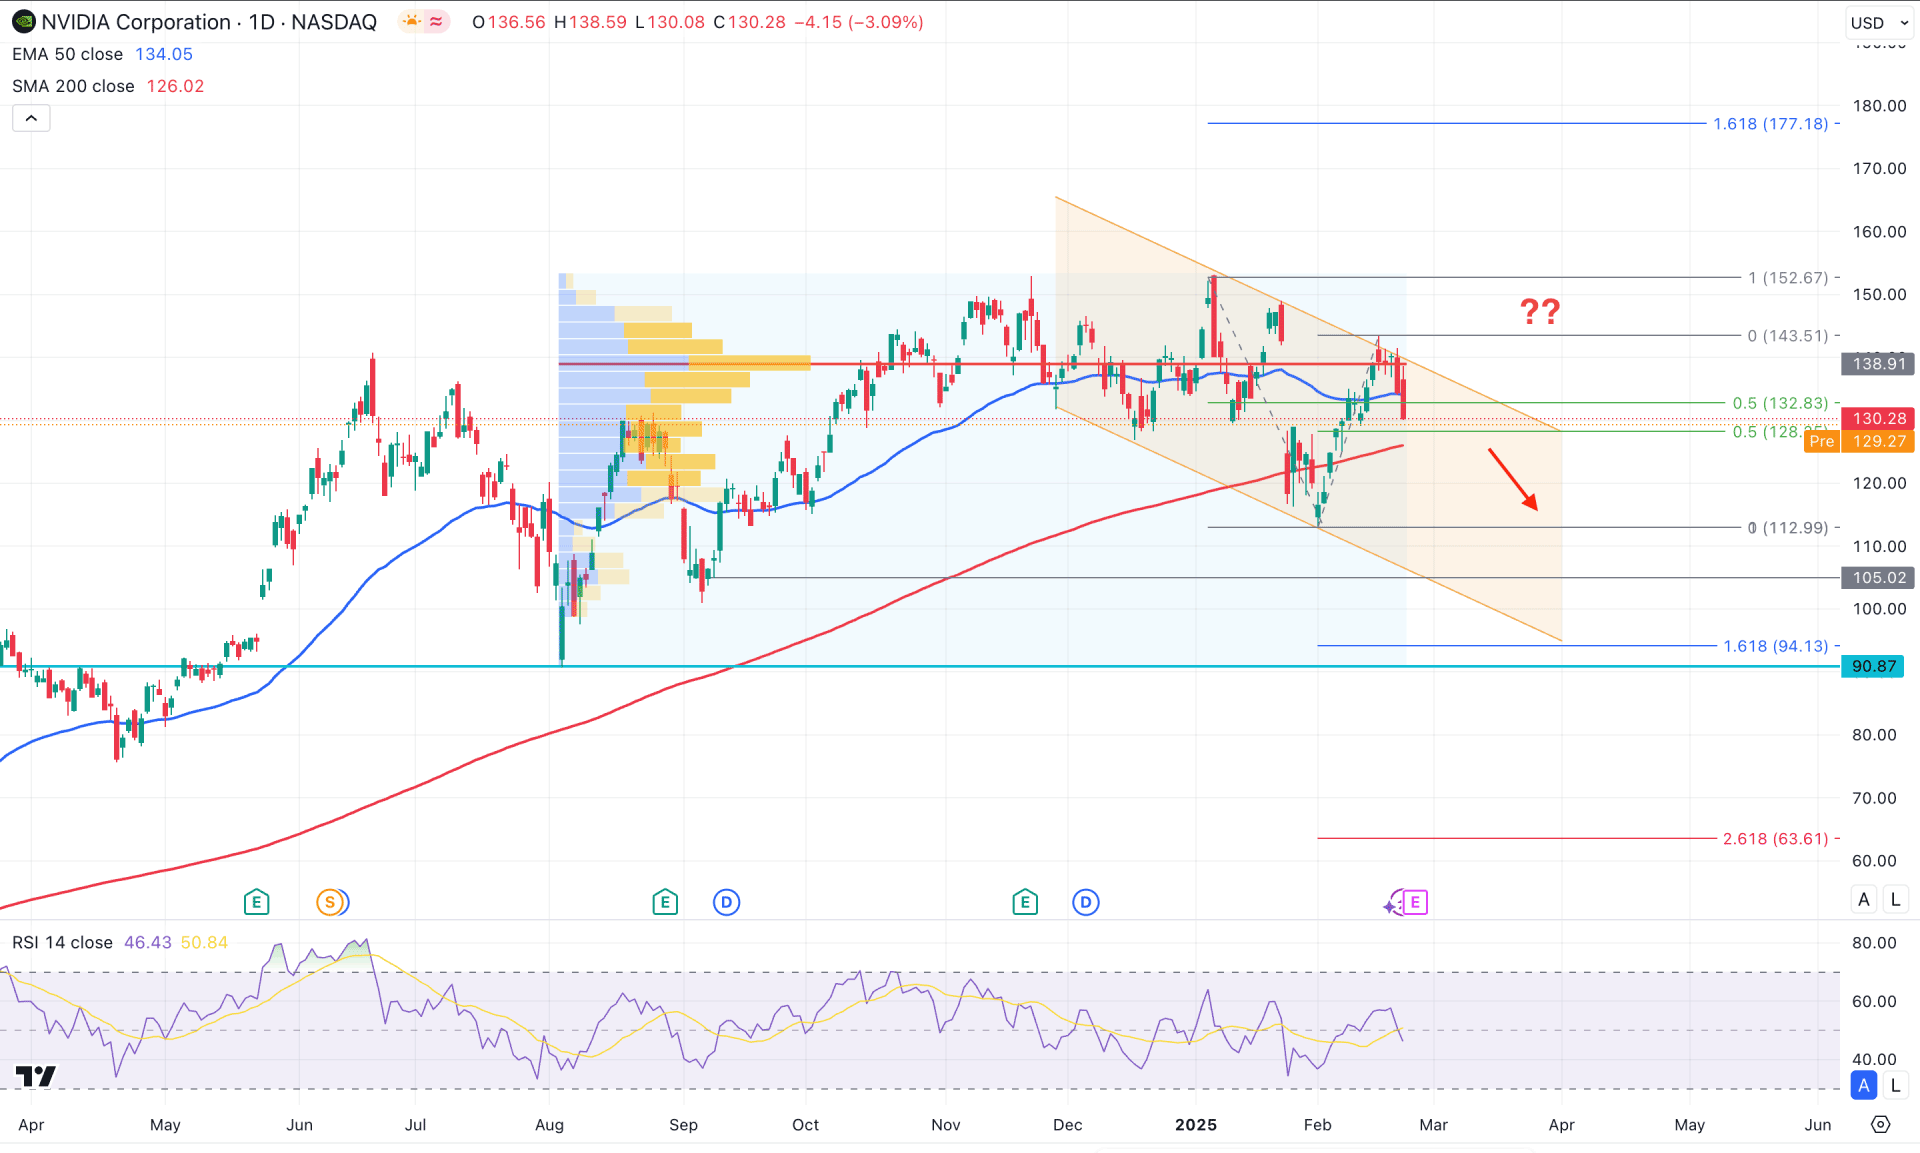
In the daily chart of NVDA, the recent price shows corrective pressure at the all-time high area, suggesting a limit to the bullish continuation. In this context, investors should closely monitor the price action, as an upward continuation is likely to happen after a valid liquidity sweep from the bottom.
In the higher timeframe, the ongoing monthly candle is bullish, signalling buyers' presence after two consecutive bearish months. However, the weekly price remains bearish, with downside pressure at the trendline resistance. The primary aim, based on the higher timeframe, is to look for a valid bullish breakout from the resistance area, signalling a trend continuation.
In the volume structure, the downside pressure is potent as the high volume line since August 2024 is just above the current price. Also, the recent daily candle has already shown a bearish reversal from the high volume line, signalling institutions' involvement in offloading positions.
On the other hand, the major market trend remains bullish, with the 200-day SMA acting as crucial support. Although the current price is hovering below the 50-day EMA line, there is no strong sign of a downside continuation due to a lack of lower low formation.
In the indicator window, the Relative Strength Index (RSI) is hovering below the 50.00 neutral line after visiting the overbought 70.00 position. Primarily, the reversal from the overbought position with a dip below the neutral point signals an early bearish opportunity, awaiting more confirmations.
Based on the daily outlook of NVDA, a descending channel is active where the current price is facing resistance from the trendline. In that case, the primary aim is to wait for a bearish reversal to extend the channel. A valid bearish daily candle below the 128.00 level could extend the selling pressure towards the 94.13 level. Moreover, a selling pressure below the 100.00 psychological level would be a significant recovery as it could influence bulls to join from a lower price.
On the other hand, any immediate bullish recovery above the channel resistance with a daily candle at the 143.00 area could extend the bullish trend towards the 170.00 to 178.00 area.
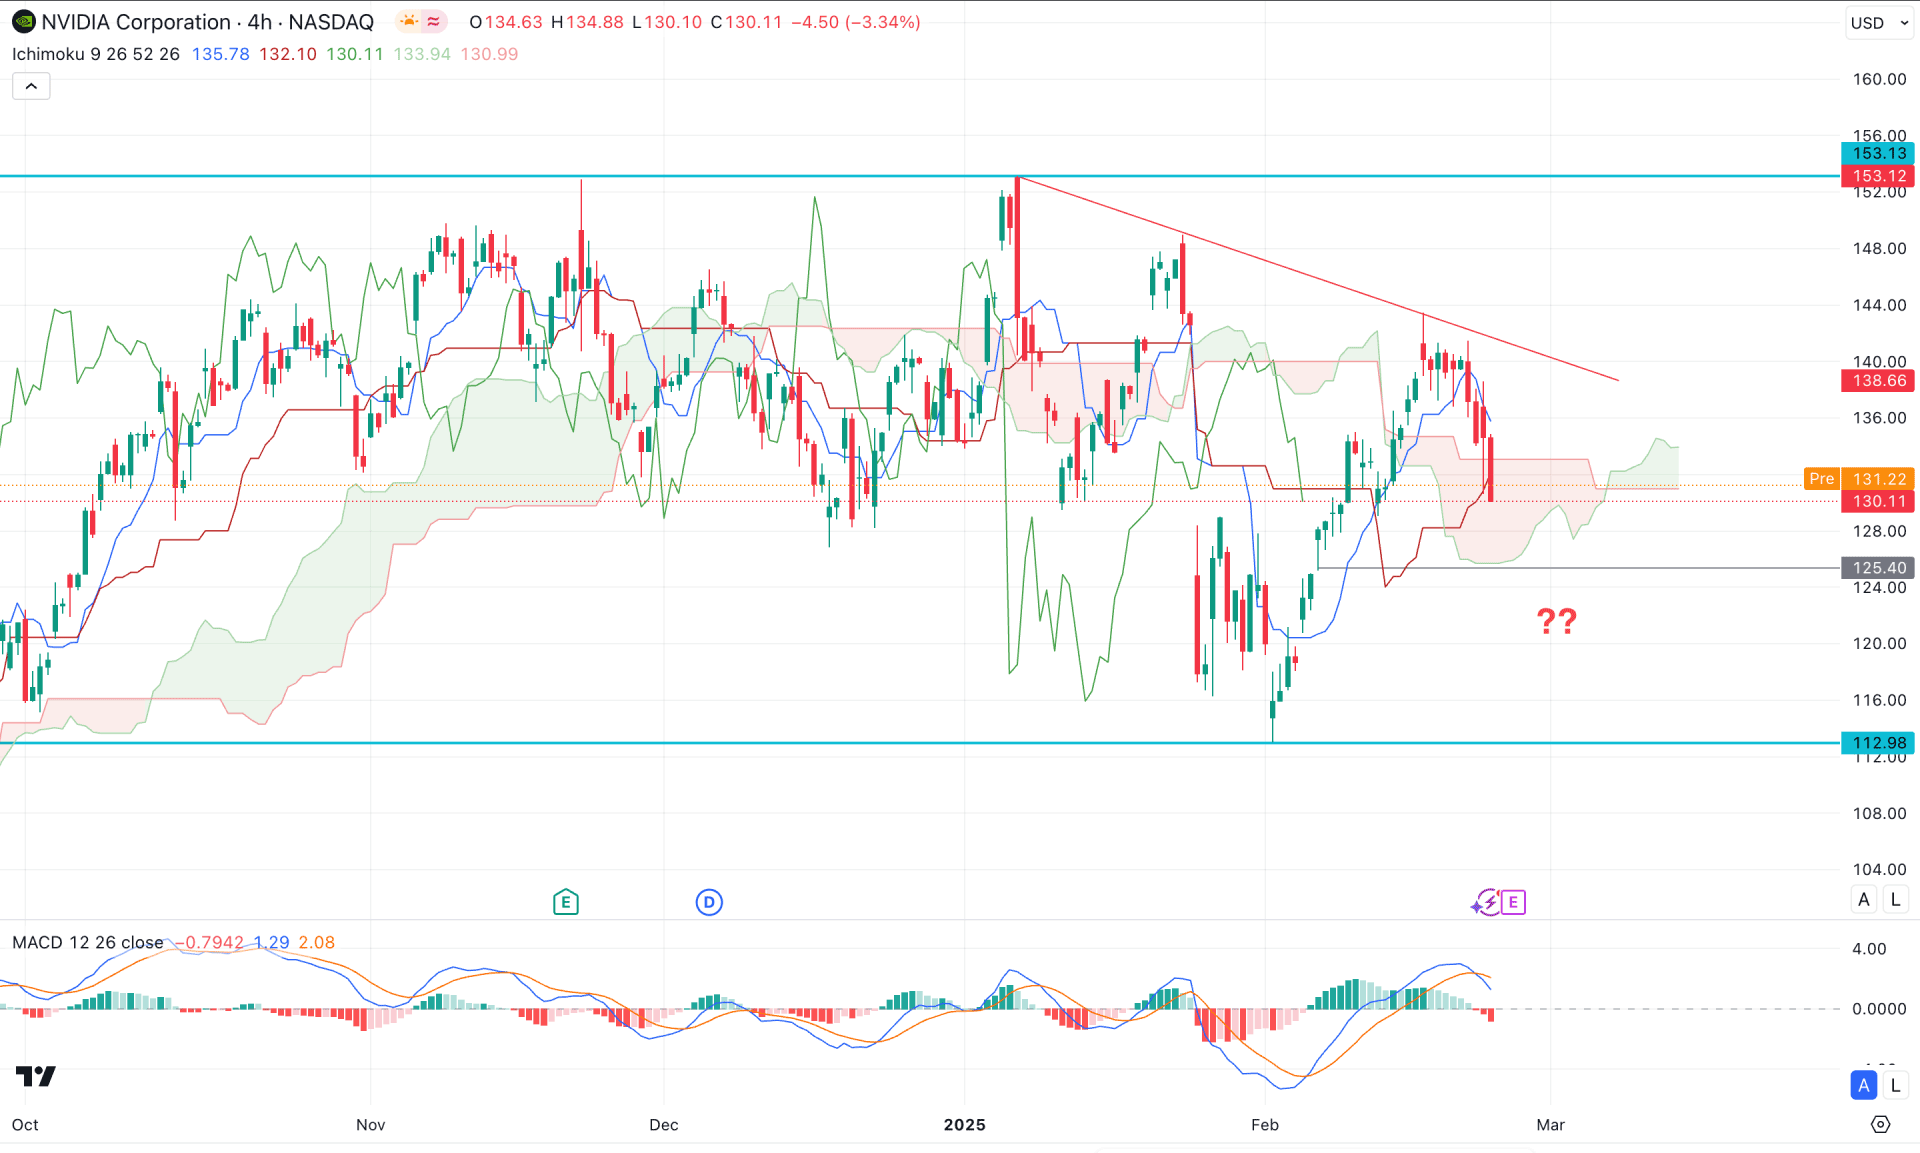
In the H4 timeframe, the current price is hovering within a cloud area, signalling an indecision. Moreover, the Senkou Span B remains flat in the futures cloud, where the Senkou Span A showed a downward slope. The dynamic Tenkan Sen and Kijun Sen are between recent swings, which indicates an additional sign of an indecision.
In the indicator window, the MACD Signal line reached the higher peak and formed a bearish crossover, while the Vertical histogram remained red.
Based on this outlook, a high probability of a long opportunity awaits validation from the trendline. A bullish H4 candle above the 144.00 level could extend the upward pressure towards the 160.00 area.
On the other hand, the ongoing selling pressure is more likely to extend towards the 112.00 area. A valid bearish H4 candle below the Cloud low could extend the loss towards the 100.00 area.
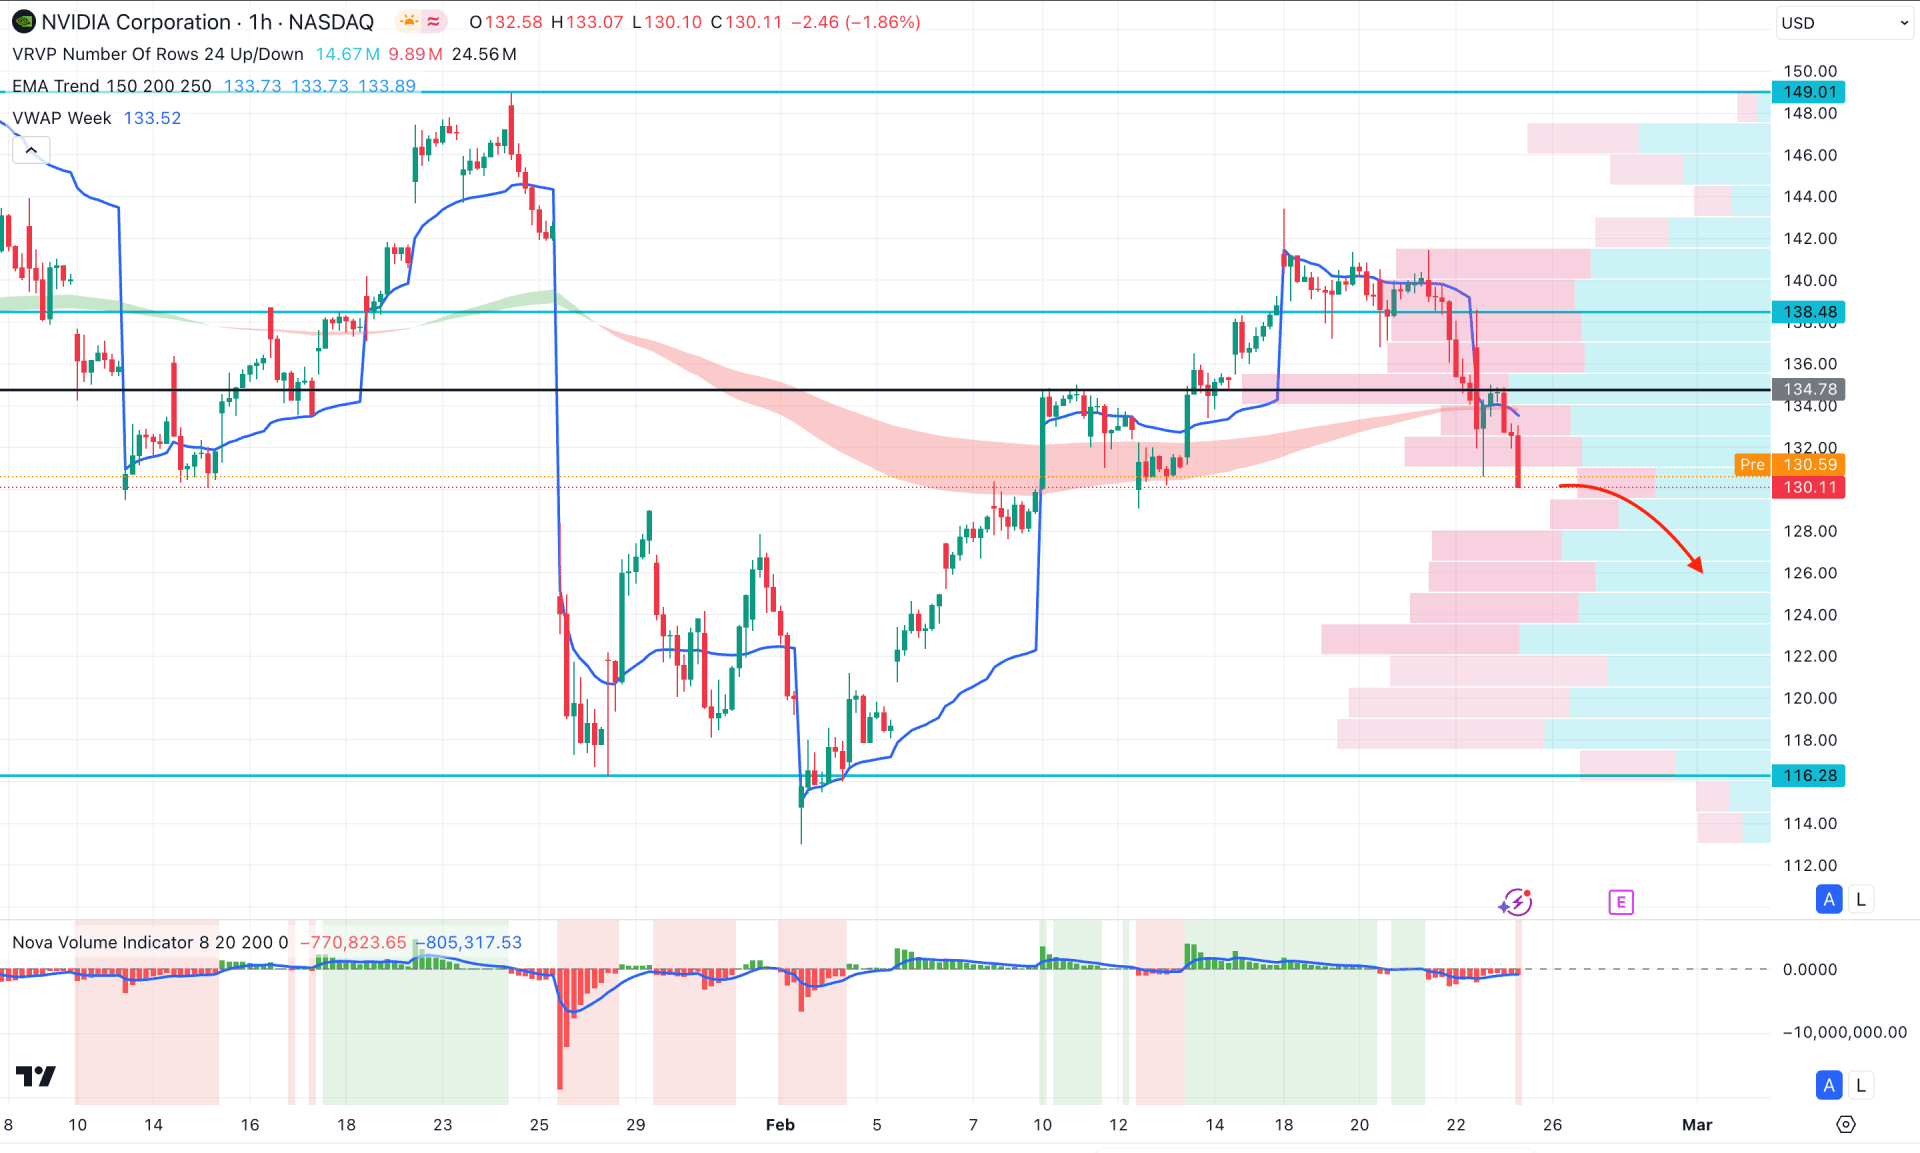
In the hourly time frame, the intraday market momentum is bearish for this stock as crucial intraday levels are above the current price, signalling a downside continuation.
The intraday high volume line is just above the previous hourly candle, signaling an intraday bearish pressure. The Moving Average wave is also above the current price, signaling an additional downside pressure.
Based on the H1 houtlook, the downside pressure is likely to extend, where the main aim would be to test the 116.28 support level.
On the other hand, any immediate recovery above the 138.48 level could alter the current market structure, invalidating the bearish opportunity.
Based on the current market outlook, NVDA is more likely to extend the selling pressure, aiming for the 100.00 psychological line. However, the broader market trend is still bullish, from where any surprising quarterly outcome can hold the major trend.


