![Novartis AG Stock [NVS] Probably Found a Bottom – Is It the Right Time to Buy?](https://d3kvcd8uuqwmxt.cloudfront.net/filecache/articles_img/tech-analysis-main-page.jpg_774_6140b1d1c78e75.91639513.jpeg)
Published: September 14th, 2021
Novartis AG Stock is currently trading around the 85.00 area, where the 52 week high is at 98.52 and 52 weeks low is at 77.04. Its forward P/E ratio of 14.93 indicates that the stock is currently undervalued and has a strong potentiality to move up.
Novartis has strong momentum in psoriasis, gene therapy, and heart drug making. In particular, its sclerosis drug Kesimpta is doing well after some weak quarters. As a result, analysts are expecting a surge in Kesimpta and gene therapy medication Zolgensma sales. Moreover, the management is focusing on restructuring the business and becoming a core drug-based business.
This week, Novartis AG got acceptance from the FDA regarding the biologics application for esophageal cancer that comes after phase 3 trials. The tislelizumab met the initial requirement of the improvement on survival who had systematically received the therapy. As the company has improved net sales and cash flow in Q2, investors should closely monitor how the price reacts at the bottom.
Let’s see the upcoming price direction from the Novartis AG [NVS] technical analysis:
Novartis stock remained sideways after the COVID-19 pandemic and trading within the pre-pandemic high at 99.85 and post-pandemic low at 69.18. Moreover, the price made multiple swing levels but failed to break below or above these lows and highs. Therefore, until the price shows a strong breakout, we may expect an expansion to the current range.
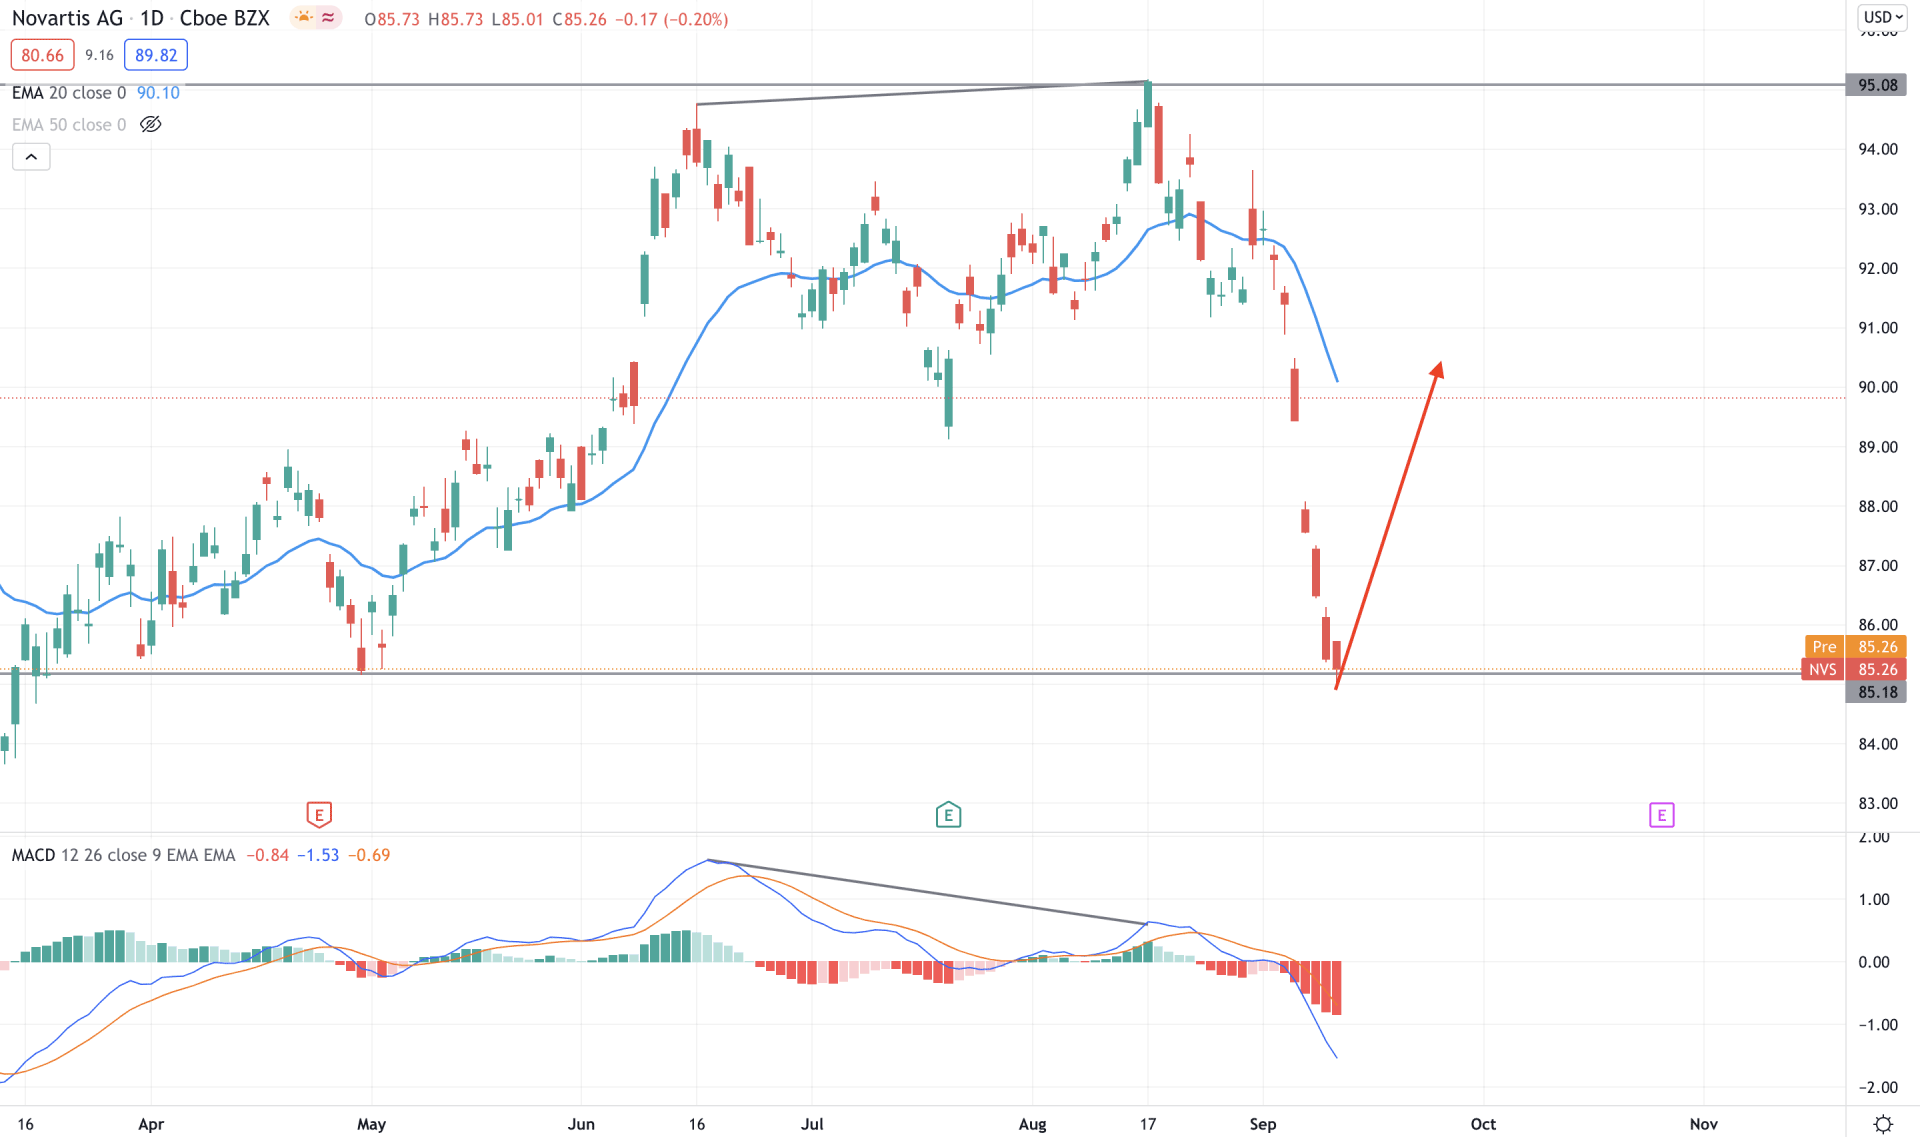
Although the quarterly results are impressive, NVS moved lower from the 95.08 resistance level, followed by a regular divergence in MACD, and found a bottom at 85.18 level. As the bearish pressure was very extreme, the price made a gap with the dynamic resistance of 20 EMA. Therefore, investors should closely monitor how the price reacts on the 85.18 level. Any bullish daily close above the 85.73 level may start a bullish momentum towards the dynamic 20 EMA area.
In that case, investors should follow how the MACD Histogram is moving where a failure to make a new low would be a sign of buyers’ presence.
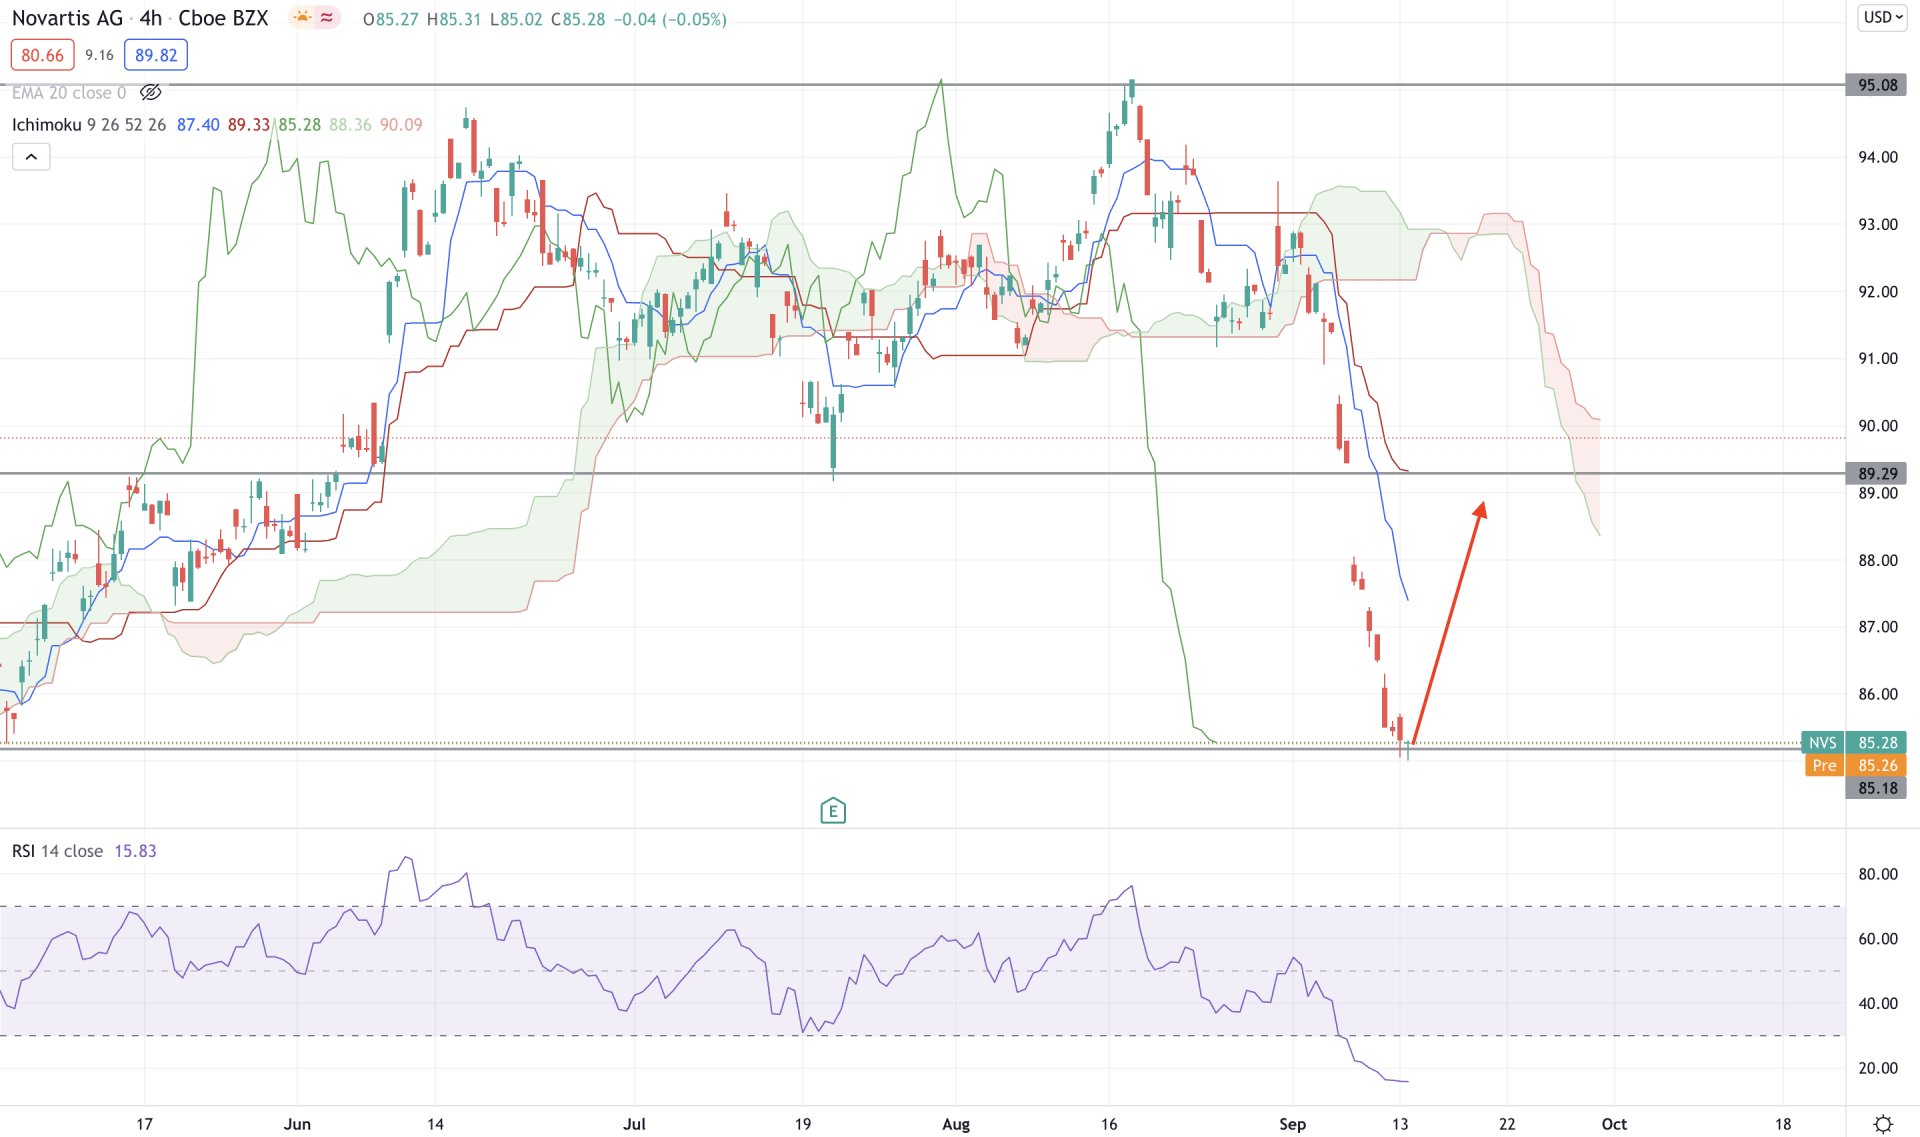
In the H4 timeframe, Novartis Stock moved below the Ichimoku Kumo Cloud with an impulsive bearish pressure that changed the overall market sentiment from bullish to bearish. Senkou Span A moved below Senkou Span B, and the lagging span showed a sharp fall with the price. However, the bearish pressure was very impulsive, which ultimately increased the price gap from the dynamic Kijun Sen.
As per the H4 timeframe, the price is more likely to rebound higher from the 85.26 support level. In that case, any bullish H4 candle with an intraday swing high would be a potential buying point. Moreover, the RSI is showing extreme selling pressure by moving below the 30 levels. Therefore, the buying pressure may extend if the RSI line moves above the 30 levels besides the bullish price action.
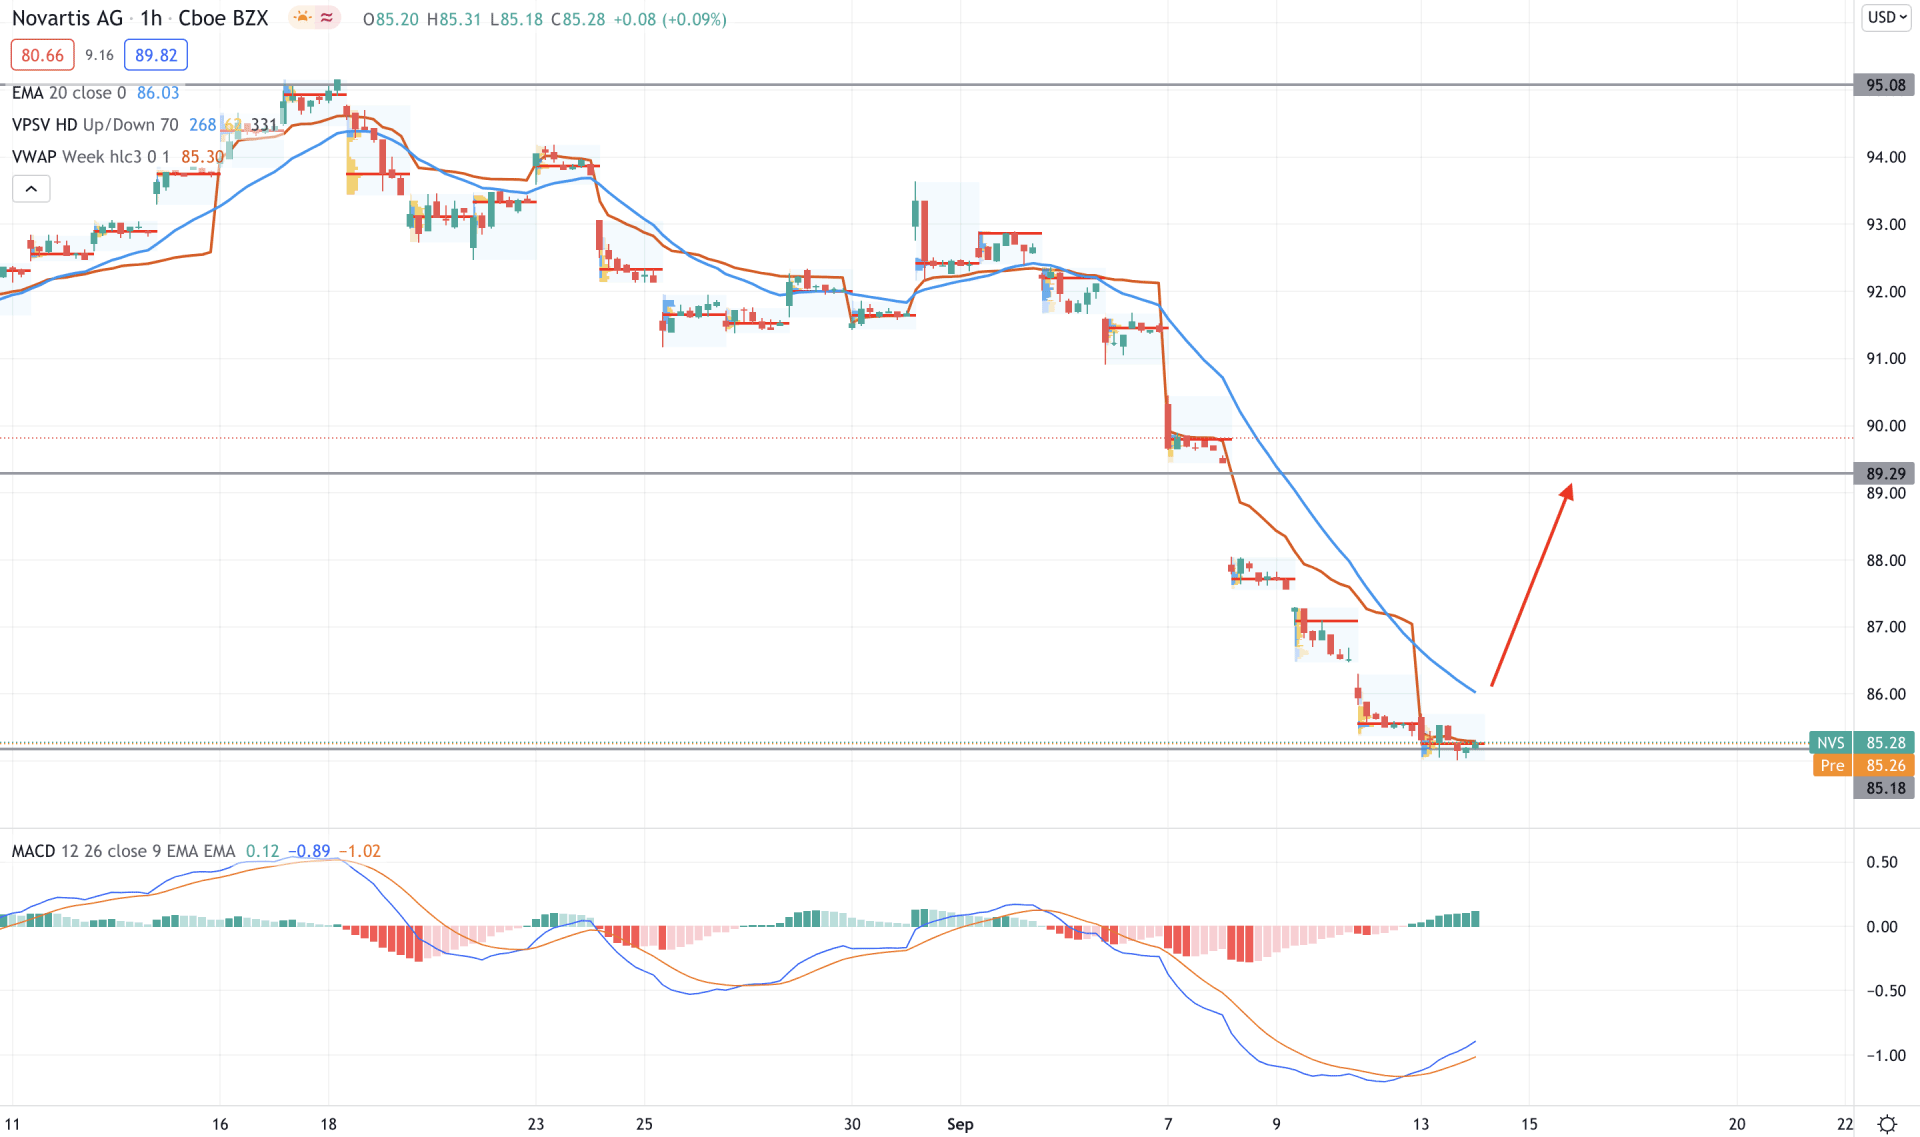
In the intraday chart, Novartis AG stock moved lower below the dynamic 20 EMA and started to move with an impulsive bearish pressure. Moreover, the price made a gap on 7 September that made the bearish pressure more strong.
On the other hand, the MACD Histogram moved above the zero lines and made consecutive highs. In that case, investors should wait for the price to move above the dynamic 20 EMA to consider the upcoming price direction as bullish. However, a bearish price below the 85.18 level may lower the price towards the 82.26 level from where bulls may attempt again.
As per the current finding, Novartis AG Stock is more likely to move up if the intraday price moves above the 86.00 level with a bullish H1 close. In that case, the ultimate price target would be towards the 93.44 supply area.
On the other hand, any bearish H4 close below the 85.18 level may alter the current market structure and make the price more bearish towards the 82.26 level.


