
Published: June 29th, 2022
Nio (NIO) has faced a fair share of issues recently, which include the production delay due to the Covid-19-driven shutdowns, supply chain issues and the effect of rising inflation. As a result, the Nio Stock tumbled and lost 30% of its value from the 2022 opening. However, the stock might have bottomed last month as it moved more than 90% recently. Therefore, it is obvious to check the price behaviour before moving to the investment decision.
Earlier this year, Nio stopped making EVs due to the Covid-19-related lockdown and business shutdown from Chinese suppliers. Moreover, the decent lockdown in late March appeared to be another pressure on the company regarding production and sales. Now, the lockdown-related pressure is over, and it is time to show a rebound in Nio production and sales.
Besides having a solid business in the domestic market, Nio has begun expanding its business to, for the first time, the European battery-swapping station in Norway. Nio takes a monthly subscription for its battery service, which could be a good revenue generator for the company. According to Nio's CEO, the company has a plan to expand the business to 25 countries within 2025.
Nio stock has almost doubled from the 12 May low but is still 56% down from the last 12 months. Let’s see
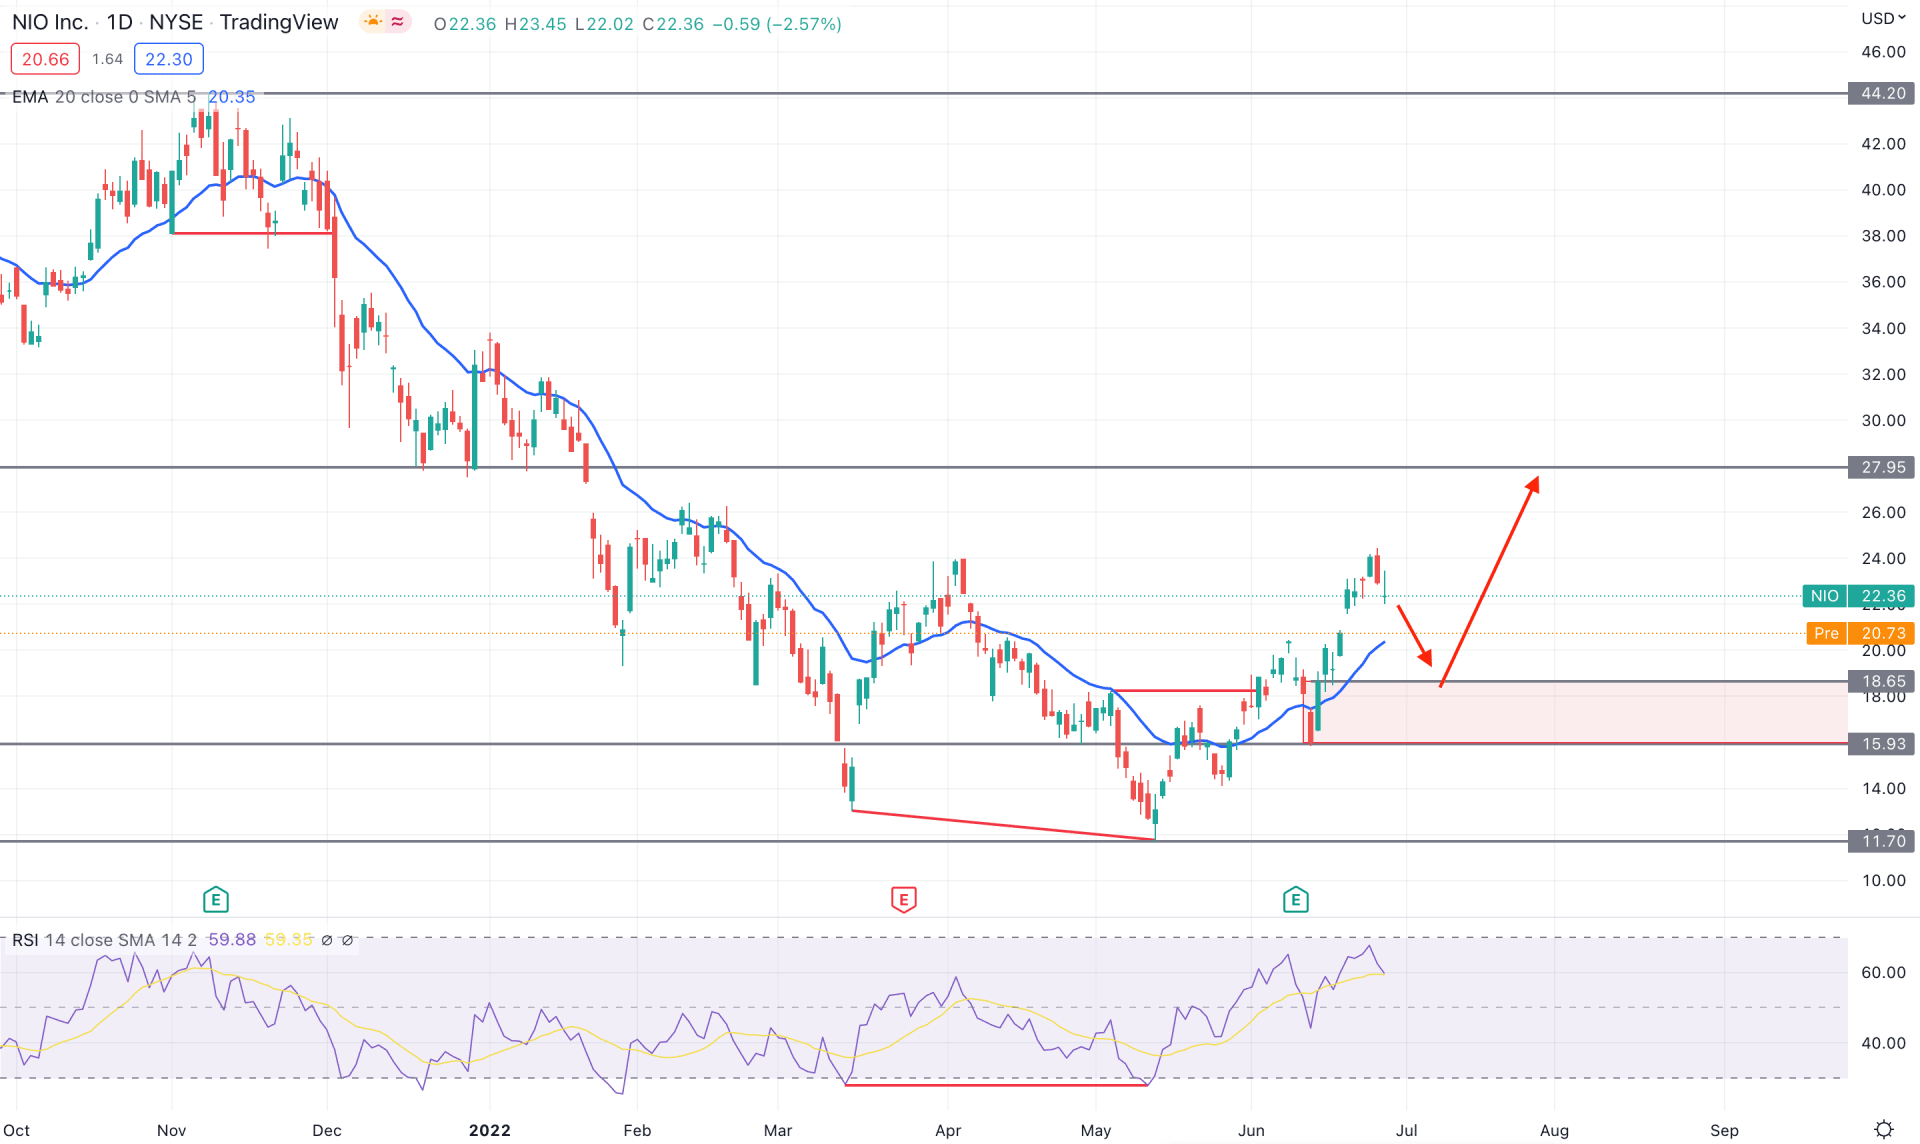
In the Nio stock daily chart, the selling pressure with a bearish Quasimodo formation started from the 44.20 swing high that ended up with the bearish momentum after testing the 11.70 swing low. Therefore, based on the current price action, the trading range of NIO is from 11.70 bottoms to 44.20 high, where 50% of the range is at the 27.95 level. Furthermore, the recent bullish break of structure from the 16.55 level pushed bulls to test another swing high above the 24.00 level. Moreover, the buying pressure opened a gap between the price and dynamic 20 EMA, indicating a pending bearish correction.
The above image shows how the price is trading at the discounted level of the 44.20 to 11.70 range, where finding a bullish opportunity would provide a higher success rate. The indicator window shows a divergence between the price and RSI followed by a bullish pressure from the dynamic 20 EMA support.
Based on the daily structure, a minor bearish correction is pending in this instrument where any bullish rejection from 20.00 to 15.90 area would provide a decent bullish opportunity. The primary target of the bullish pressure is towards the 27.95 level, but the ultimate target would be at the 44.20 area.
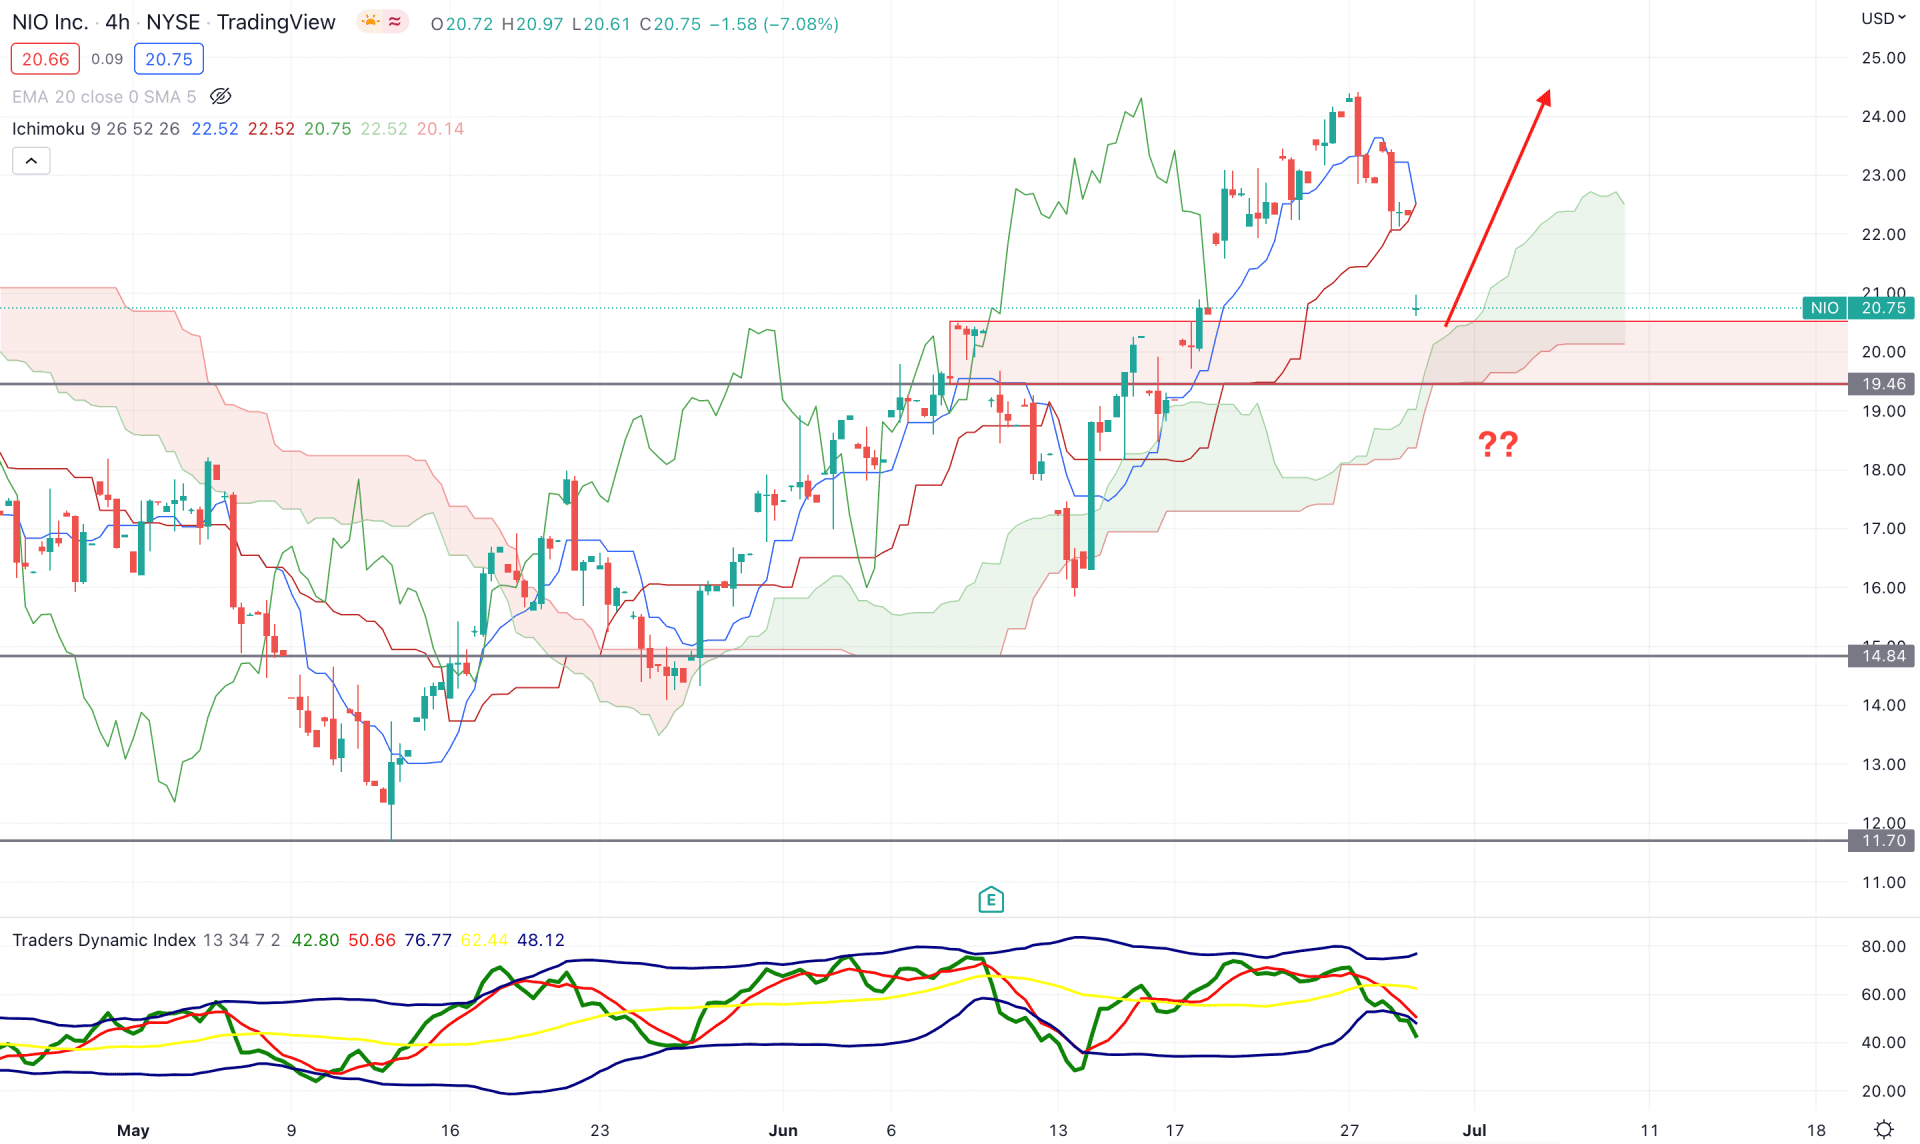
According to the Ichimoku Cloud analysis, the current price structure of Nio stock is bullish. In the future cloud, the Senkou Span A is above the Senkou Span B while the gap between these lines is getting wider. The price moved above the Cloud support with an impulsive bullish pressure and made a solid position above it.
The indicator window shows how sellers dominate the market by pushing the TDI line below the lower band. Therefore, the bullish momentum from cloud support should match the market direction by taking the TDI line above the 50.00 level. On the other hand, the dynamic Tenkan Sen and Kijun Sen moved to the same level while the price broke below these lines, indicating a solid correction.
Based on the H4 structure, investors should closely monitor how the price trades between the 20.70 to 19.40 area, from where any bullish rejection with an H4 candle above the Tenkan Sen line would be a bullish signal. In that case, the primary aim is to test the 25.00 psychological level in the coming days.
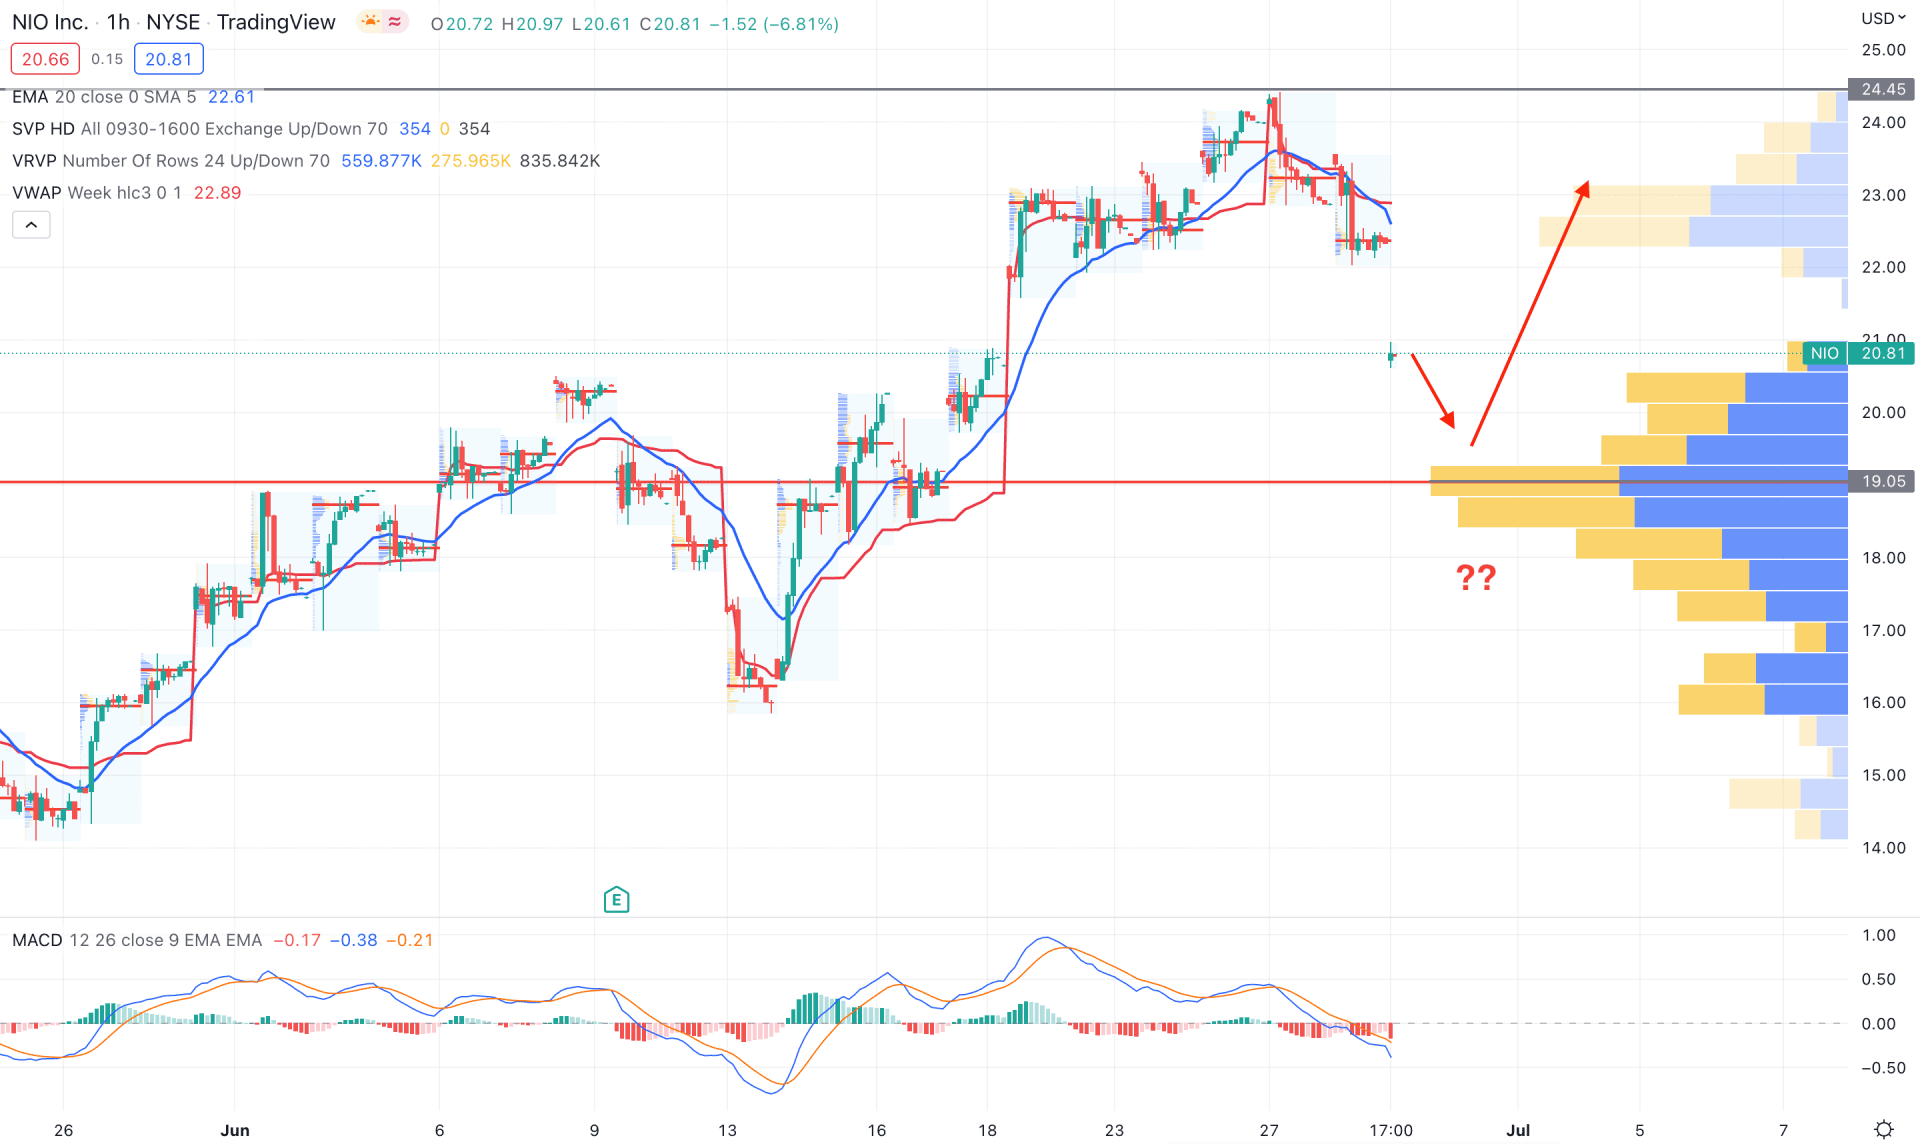
According to the Nio Stock intraday chart, the broader market direction remained bullish, although the dynamic 20 EMA is above the price. According to the visible range volume, the strongest trading volume is at the 19.05 level, which is the ultimate barrier for bears. Although the current price moved below the intraday high volume level, bulls from the 19.05 area could attempt again from the current discounted price.
In the indicator window, the MACD Histogram turned bearish with no sign of a bullish correction. Moreover, the dynamic 20 EMA and weekly VWAP are above the price and working as minor resistances. In that case, investors should consider the current price momentum as bearish as long as it trades below the dynamic 20 EMA. However, breaking below the 19.00 level coils extend the bearish pressure towards the 14.00 area.
Based on the current price action, Nio stock is more likely to move up, although a minor bearish correction is pending. Therefore, any bullish sign from 20.00 to 15.90 area would provide a higher success rate where the ultimate target will be towards the 44.20 area.