
Published: July 29th, 2021
Nintendo released its best-selling console, Nintendo Switch, in 2017, and still, this console has a strong position in the market. This console has both handheld and desktop modes so that users can have maximum flexibility in playing video games anywhere. Moreover, Nintendo online allowed users to save their data online that usually saves spaces from the device.
Nintendo online is the most significant upgrade among others that made using consoles easier for players. As a result, Nintendo made 85 million copies of switch sales since the launch and an additional 29 million this year. Moreover, some flagship brands like Mario, Zelda, and Pokémon increased their earnings by collaborating with Nintendo.
Despite the development, Nintendo stock made the price-to-operating-income multiple of 12 times, which is still below competitors like Activision, Blizzard, and Electronic Arts. Now, economic recovery may influence users and contributors to come back in everyday life, increasing the stock price. However, the current range is a sign that Nintendo Stock needs a reason for setting price direction. In addition, due to the release of digital games, Nintendo's management is optimistic about earnings that may influence the stock.
Let’s see the upcoming price direction from the Nintendo Stock [NTDOY] technical analysis:
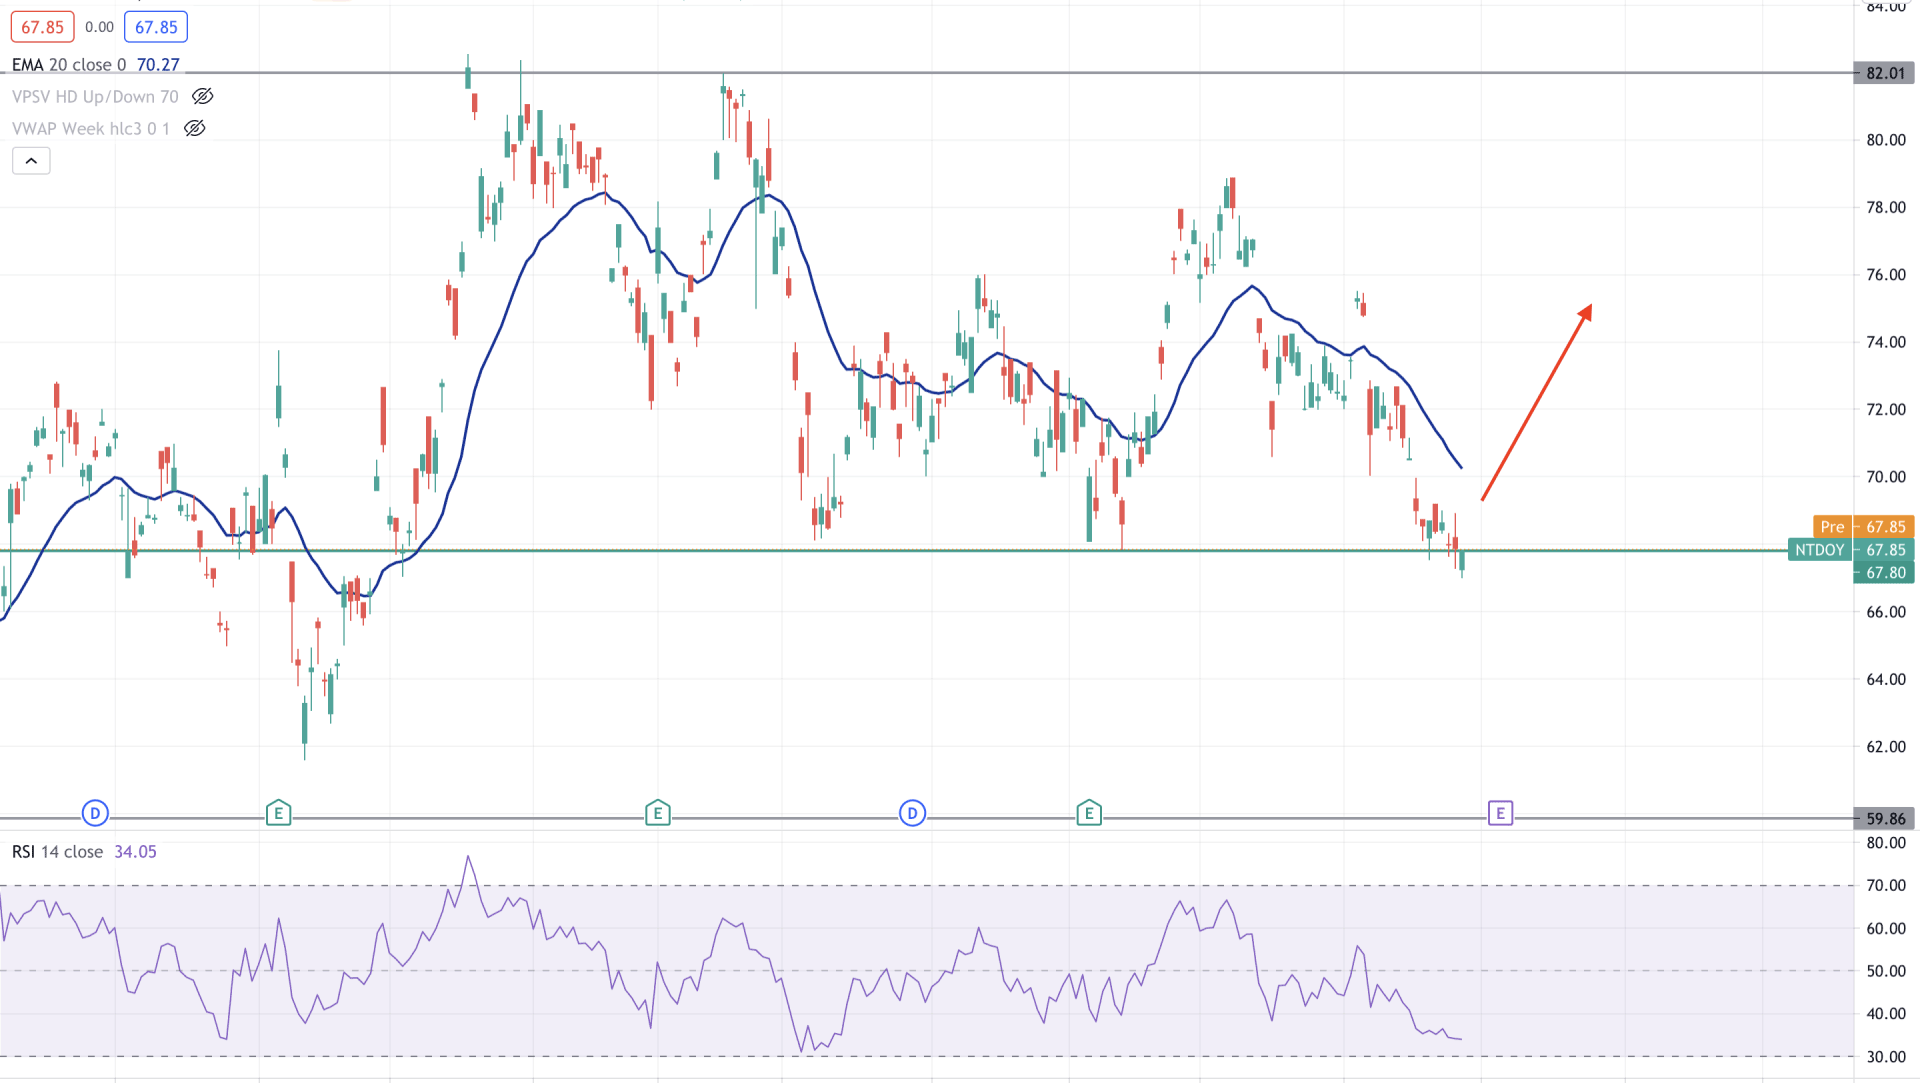
Nintendos stock successfully recovered from the Covid-19 market crash in 2020 and moved higher than it lost during the pandemic. However, since the beginning of 2021, bulls have failed to show any impressive results. Although earnings and other projections were on the recovery track, the price remained within the range between 82.00 to 67.80 level. Now the price is trading at the 67.80 support level, and any sign of bullish momentum may extend the correction higher.
In the above image, we can see the daily chart of Nintendo Stock where the price made several violations of dynamic 20 EMA from February to July. Now the price is facing significant support at 67.80 level where the RSI is just above the overbought 30 levels. Therefore, if the price rejects the support level with a bullish daily close above the dynamic 20 EMA, we can consider the upcoming price momentum as bullish.
On the other hand, a stable bearish daily close below the 67.80 level may initiate a broader correction. In that case, any selling opportunity would be against the more overall market trend.
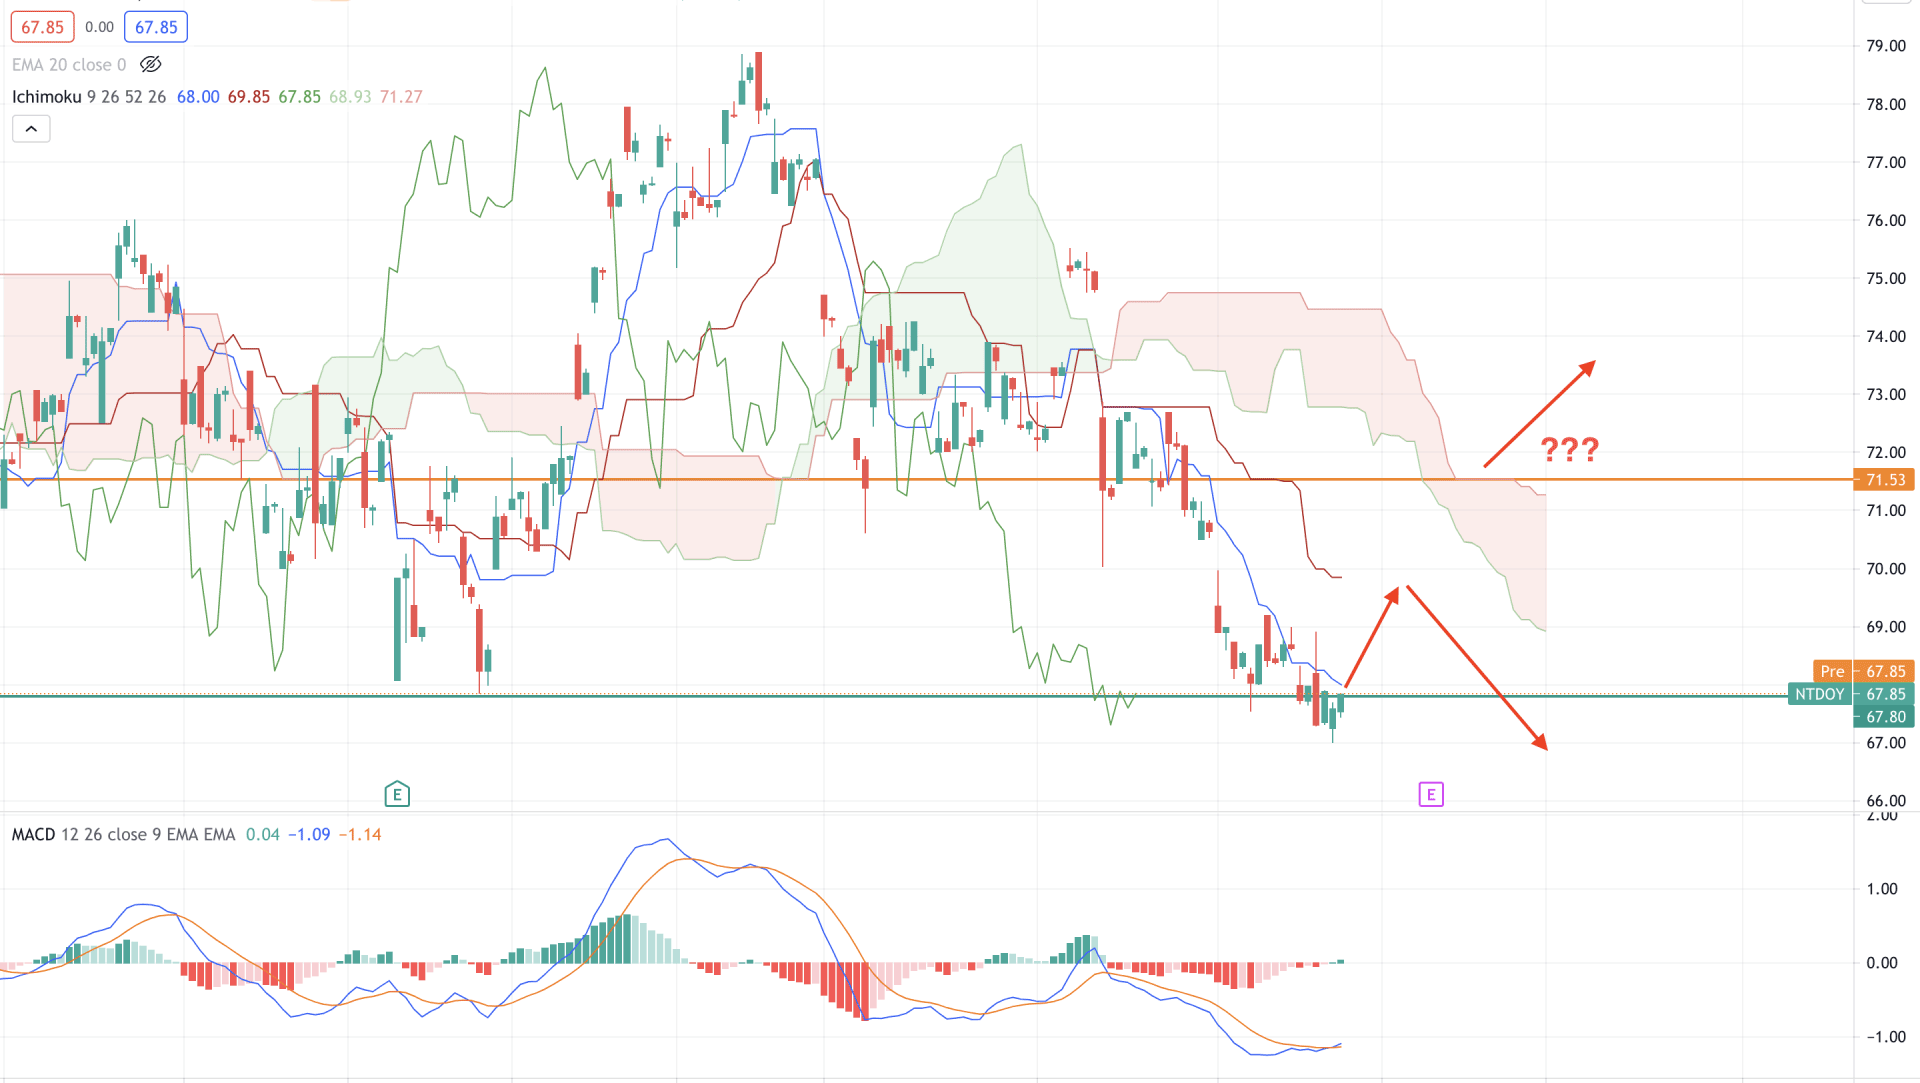
According to the Ichimoku theory, Nintendo Stock is facing intense selling pressure in the H4 chart as the price is stable below the Kumo Could and intraday resistance of 71.50 level. Therefore, as long as the price is trading below the 71.50 level, the overall outlook will be bearish.
The price chart shows that the price is trading at 67.80 support level while the Future cloud is bearish and Chikou Span is below the price. In the indicator window, MACD Histogram turned bullish, increasing bullish correction towards dynamic Kijun Sen from where bears may take the price below the 67.80 level. In that case, a strong rejection and H4 close below the 67.80 level is essential.
On the other hand, any bullish breakout above the Senkou Span B level with an H4 candle may take the price higher towards the 79.00 swings high.
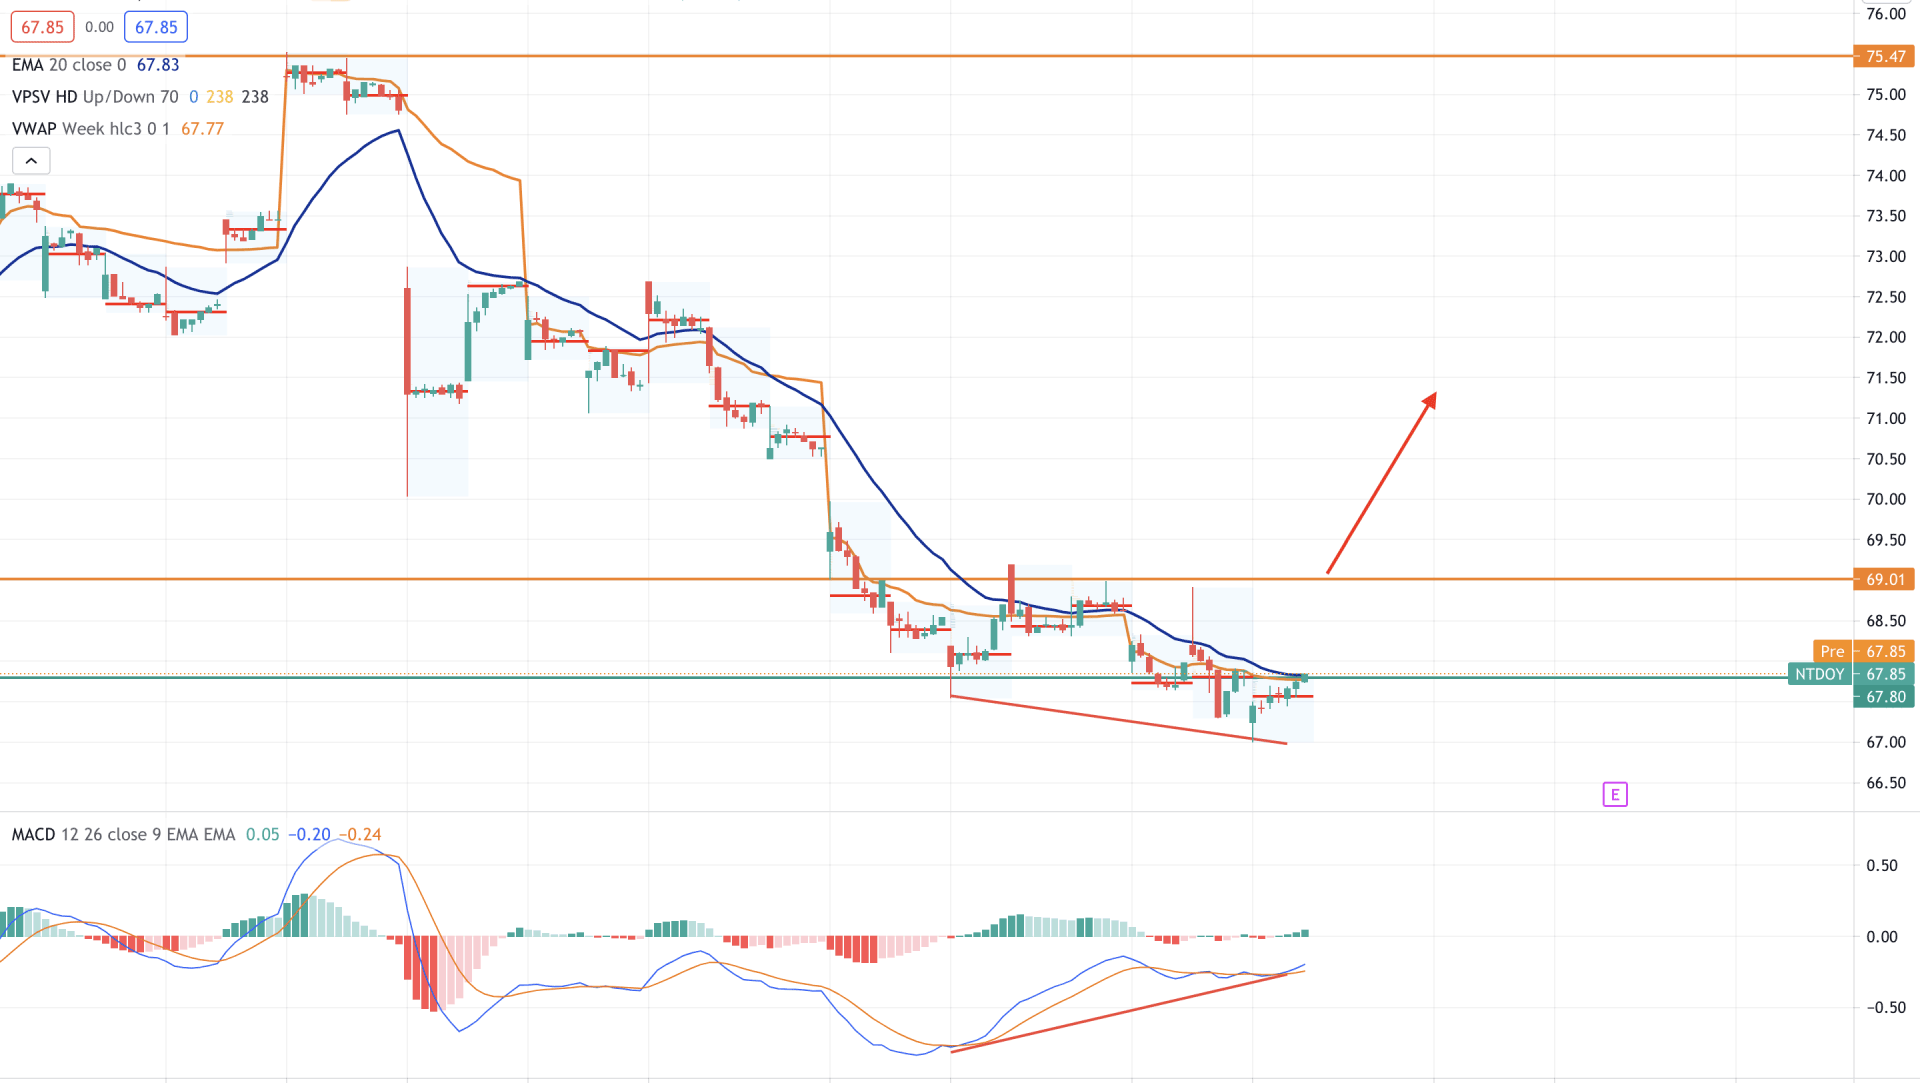
In the intraday chart, Nintendo stock has several signs of believing that bulls are preparing to take the price higher. Therefore, based on the price structure, an H1 close above the 69.00 swing high is important for bulls.
In the H1 chart, the price is hovering at the 67.80 significant support level where the weekly vwap and dynamic 20 EMA remain closer to the price. Moreover, although the price is below the dynamic vwap, it is barely making new swing low.
MACD lines failed to make a new low like the price in the indicator window, pointing out a price reversal possibility. Therefore, as long as the regular divergence is in play, an intense bullish pressure above the dynamic vwap with an H1 close above the 69.00 level may take the price higher towards 75.50 level in the coming sessions.
As per the current observation, traders should find an intraday buying pressure from the H1 chart with a bullish H1 close above the 69.00 level to join the possible extension of the broader price correction.
On the other hand, a solid bearish H4 close below the 67.80 may alter the current market structure and initiate a deep correction towards the 64.00 area.


