
Published: April 12th, 2023
Some market experts have suggested that NIKE is an investment opportunity, while others have cautioned against doing so.
Nonetheless, the company is well-positioned to recruit environmentally and socially responsible investors. The purchase of over 500 shares by director Peter B. Henry in February 2023 has also bolstered confidence in the company.
Despite one analyst's "Sell" rating, 22 analysts have given the stock a "Buy" rating, while 13 have given it a "Hold" rating. The consensus recommendation for this stock is "Moderate buy," with a price target of $134.33. Analysts expect NIKE to report remarkable earnings per share for the third quarter of 2024, an increase from their previous prediction.
The consensus estimate for NIKE's full-year earnings is $3.24 per share, while the earnings for the third quarter of 2025 are $0.98 per share. Institutional investors, including BTC Capital Management Inc. and Foster Group Inc., have recently purchased and sold NIKE shares. The company appears resilient and is attracting the attention of investors who recognize the industry's development and profit potential. NIKE's future is promising, and investors should closely monitor the company's performance.
Should you invest in Nike Stock (NKE)? Let’s see the upcoming price direction from Nike Stock (NKE) technical analysis:
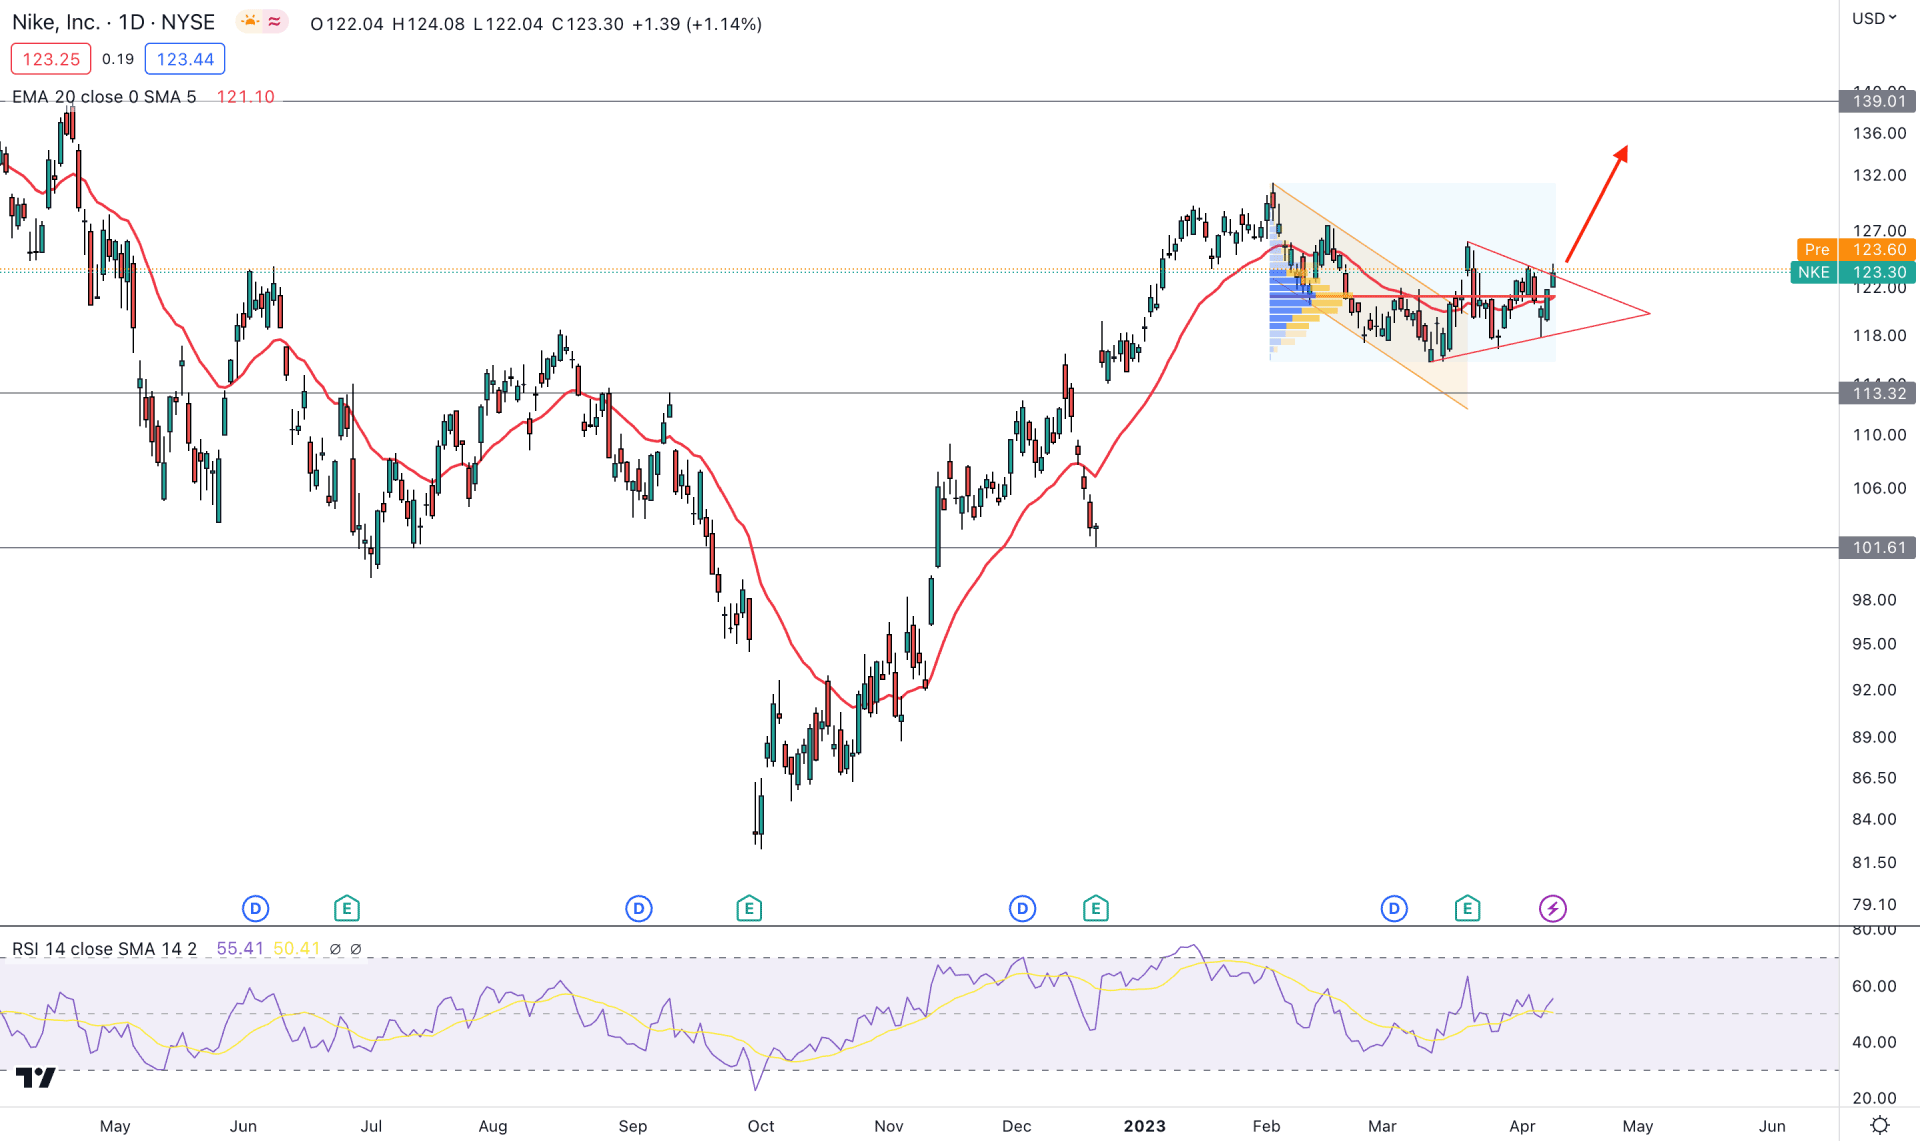
In the daily chart, significant buying pressure is seen in NKE as the current price is trading higher by creating multiple higher highs.
A massive downside pressure and a V-shape recovery in October 2022 is backing the current bullish momentum, whereas the recent price shows multiple bullish continuation patterns.
The most significant pattern in the current context is the latest descending channel breakout and holding the momentum above it. An impulsive pressure came from the channel resistance and closed above it in the daily candle. Later on, a sideways market is seen from the bullish pennant pattern formation. Therefore, the primary trading idea is to look for long opportunities as long as the price trades above the 113.32 key support level.
The fixed range high volume indicator shows that the latest activity level since February 2023 is just below the current price. It is also working as a confluence support to the dynamic 20-day EMA.
In the indicator window, a similar price structure is visible where the current RSI level shows a buying momentum for the bullish recovery at the 50.00 level. It is a sign that bulls are still active in the market and can extend the momentum toward the 70.00 RSI level.
Based on the daily structure, investors might expect a bullish continuation trading opportunity in the coming days. The primary target price would be 126.01 level, which is the 21 March 2023 high. Further buying pressure could extend the momentum toward the 139.00 level.
The bearish opportunity is also available where a stable price with a daily candle close is needed below the 113.00 level. It might lower the price toward the 101.61 support level in the coming days.
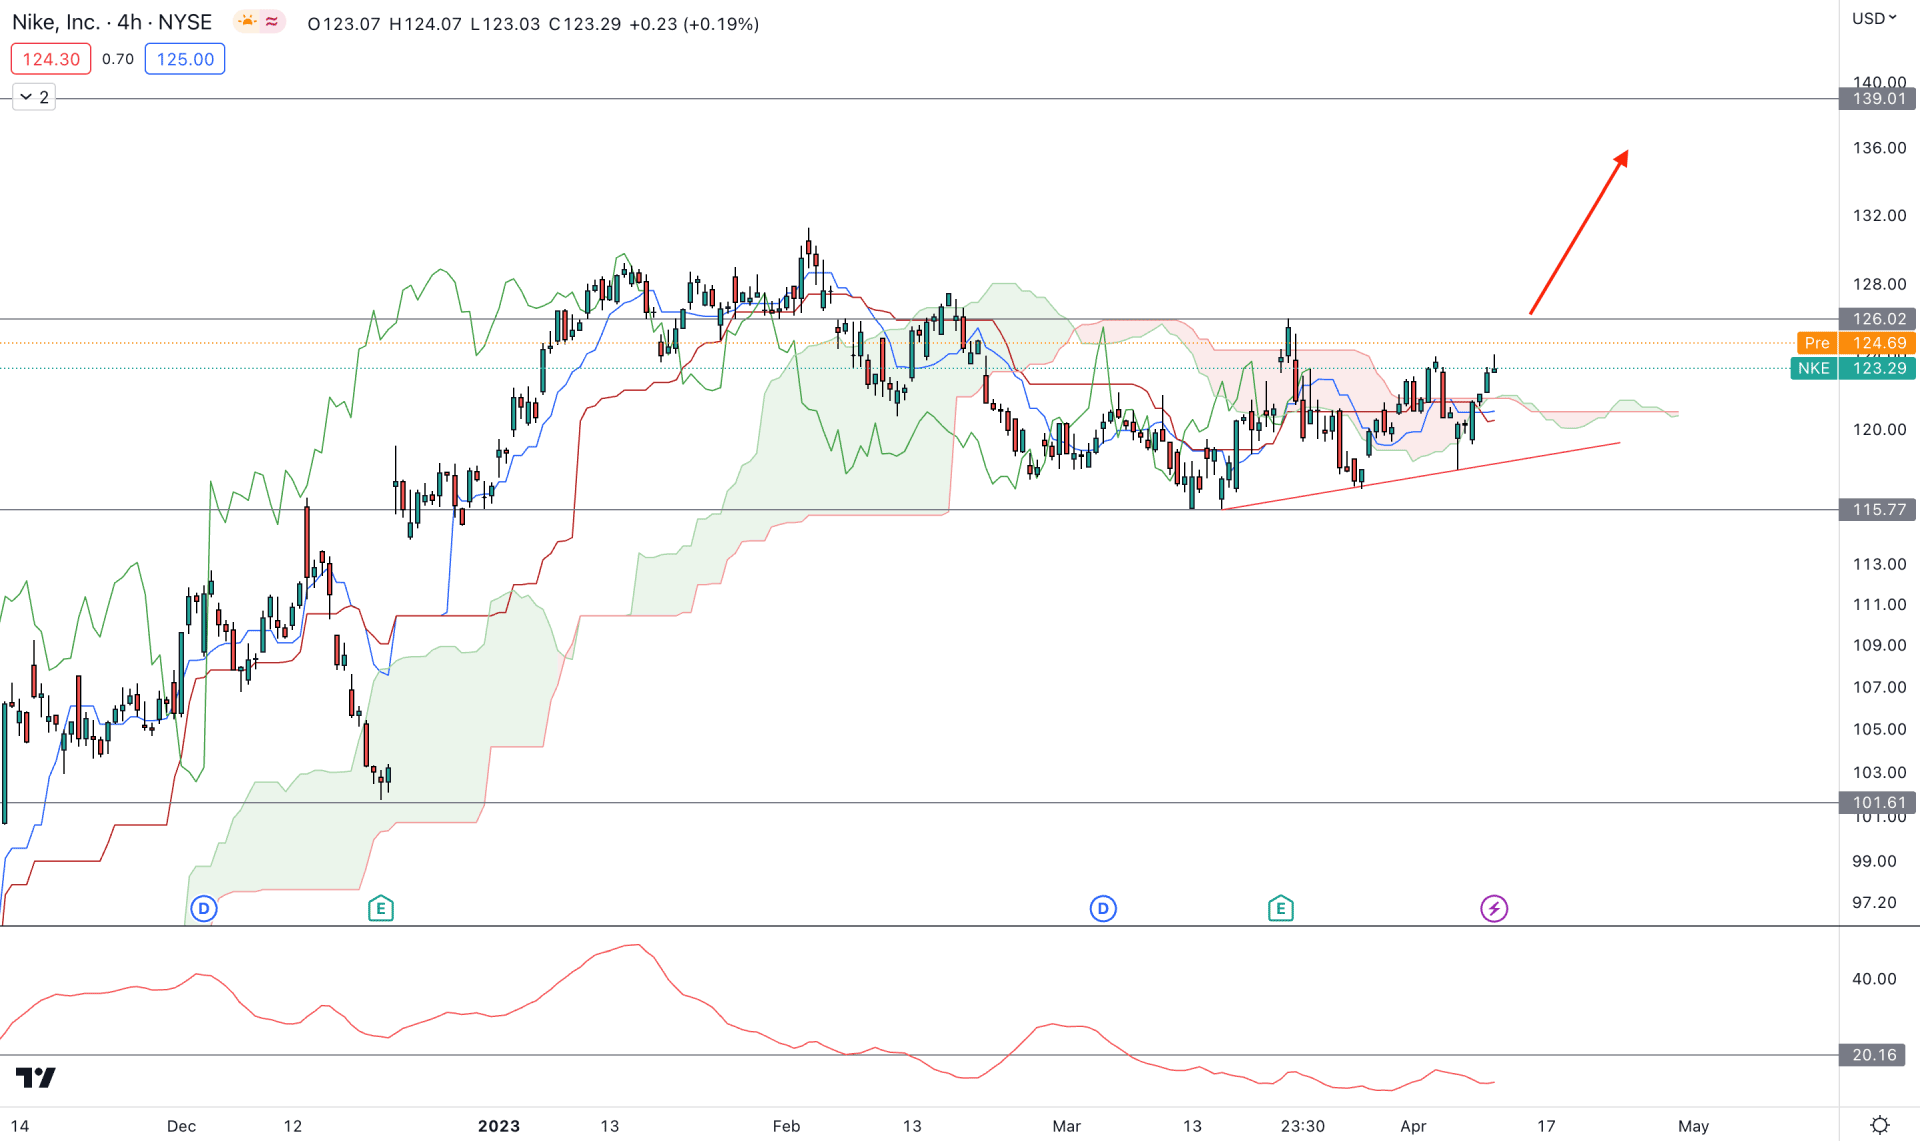
In the H4 chart, a bullish trend continuation opportunity is visible where the most recent price is sideways after a long bullish trend. Therefore, the primary anticipation is to look for long opportunities as long as the price trades above the near-term Cloud support level.
In the future cloud, the current structure is extremely corrective where the Senkou Span A and B are closer together, which is a sign of a potential breakout.
In the indicator window, the corrective market momentum is visible from the ADX, which is below the 20.00 line.
Based on the current market outlook, a bullish break and an H4 close above the 126.01 level could offer a long opportunity in this instrument. Also, a bearish pressure and a liquidity sweep below the current trend line support could offer another bullish opportunity.
However, breaking below the 115.77 level with an H4 close could limit the bullish opportunity and lower the price toward the 101.00 area.
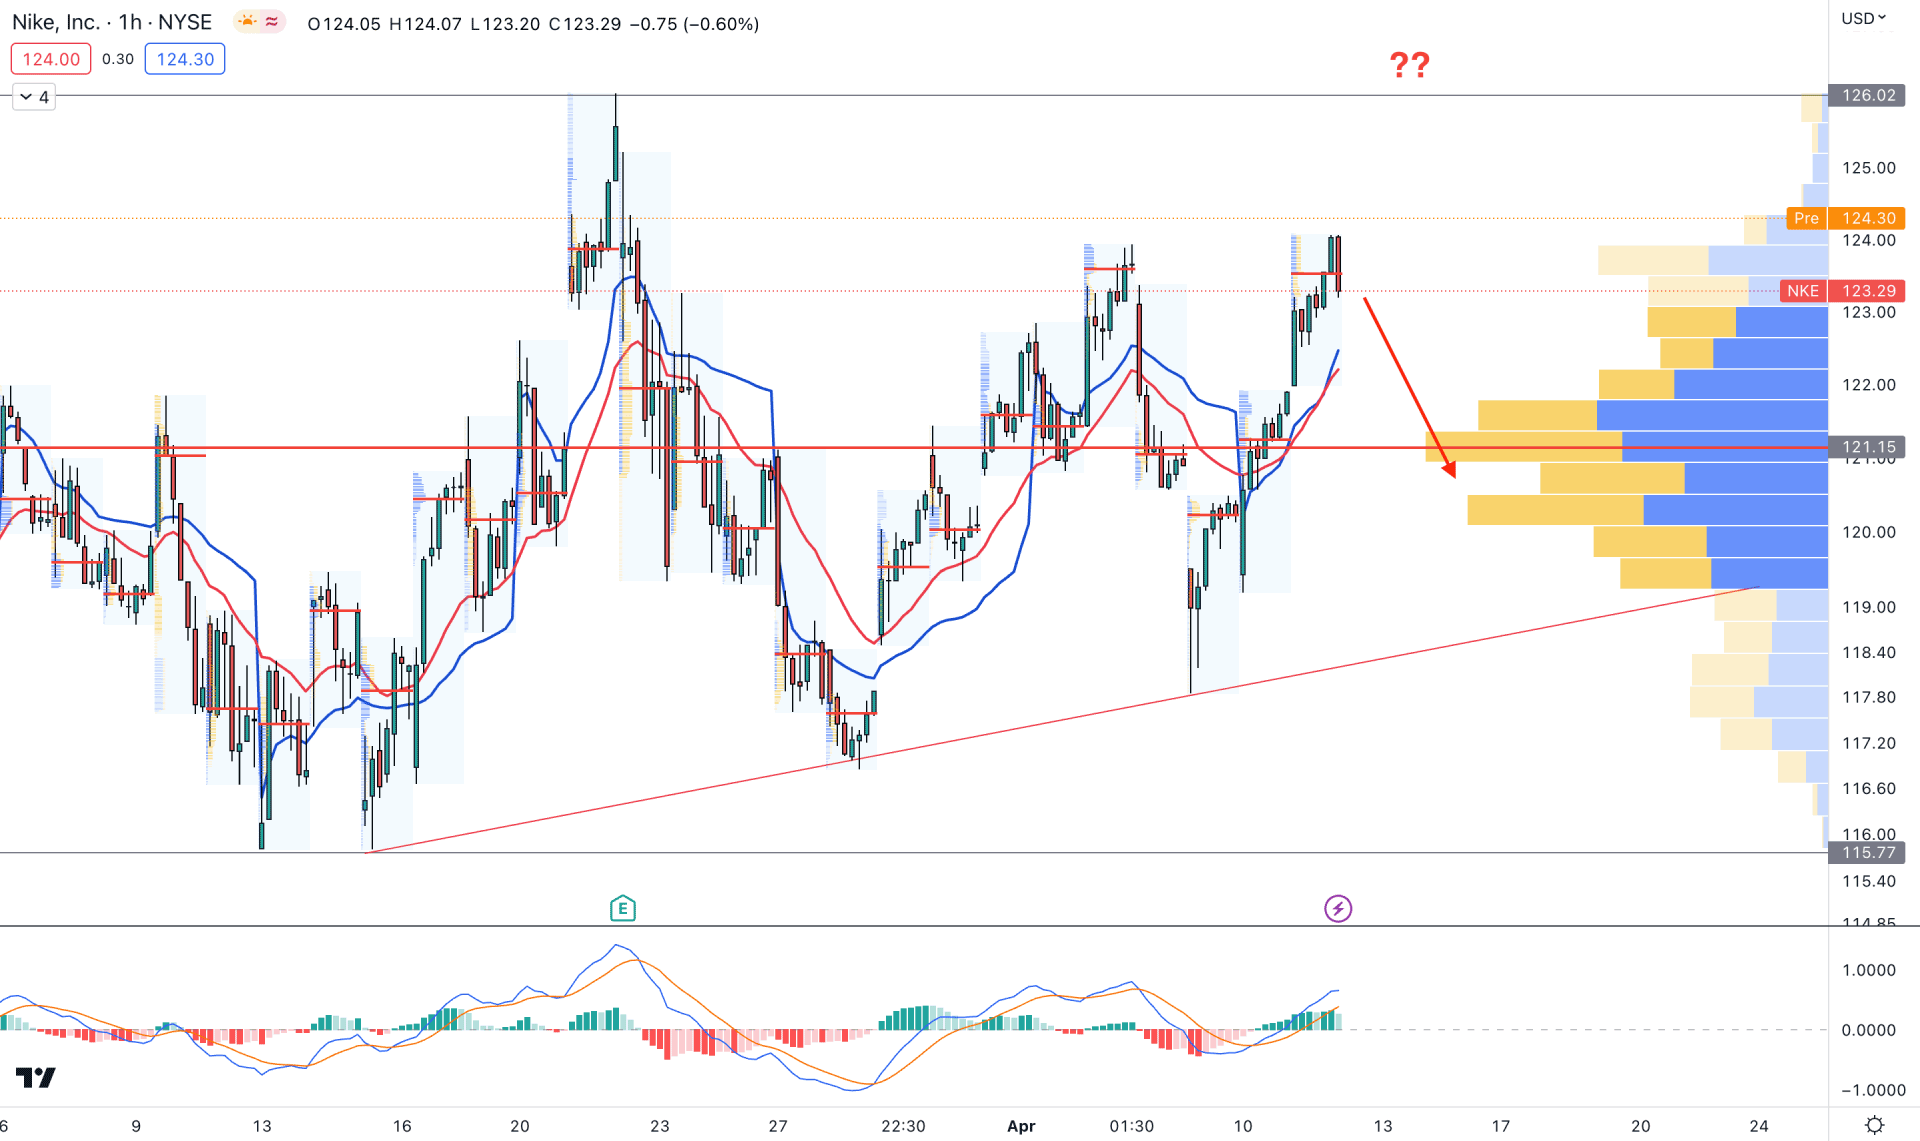
In the hourly chart, the price is corrective where the visible range high volume level is below the current price. Moreover, the dynamic 20 EMA and VWAP are below the current price and working as an immediate support level. It is a sign that bullish momentum is slightly higher in this market, where any bullish breakout could offer a stable trend trading opportunity.
The latest intraday high volume level moved above the price, which indicates a short-term bearish possibility. Therefore, a strong bullish momentum needs an H4 candle above the 126.00 level, targeting the 130.00 area.
Based on the current market outlook, the bullish trend continuation opportunity is solid as long as the current price is above the descending channel support. As the intraday price is corrective, investors should wait for buying opportunities after a bearish liquidity sweep from a near-term support level.


