
Published: March 31st, 2026
Investors are anticipating early indications that Nike's recovery efforts are beginning to pay off as the company prepares for its next earnings release.
Wall Street projects that the company will make about $11.2 billion in revenue during quarter three of the fiscal year, with profits per share expected to drop from $0.54 to $0.28. Although ongoing issues like fluctuating pressure and profit demands are to blame for the downward revision, attention is now on what will happen next.
The most crucial question, according to analysts, is whether Nike can continue to make steady progress behind the scenes. This entails improving North American performance, maintaining stable trends in China, and demonstrating greater control over costs and inventory.
Good signals are perceived by some. The company appears to be taking more drastic steps to restart the firm, like streamlining roles, altering distribution, and refining leadership priorities. New goods and occasions like the World Cup could be beneficial at the same time.
In an attempt to turn things around, Nike has been working to expand its operating company, restore its wholesale channel, and get rid of outdated inventory. However, the company's plan has encountered significant challenges, including sluggish demand in China, slow development in North America, and additional tariff charges.
Let's see the further price movement from the NKE analysis:
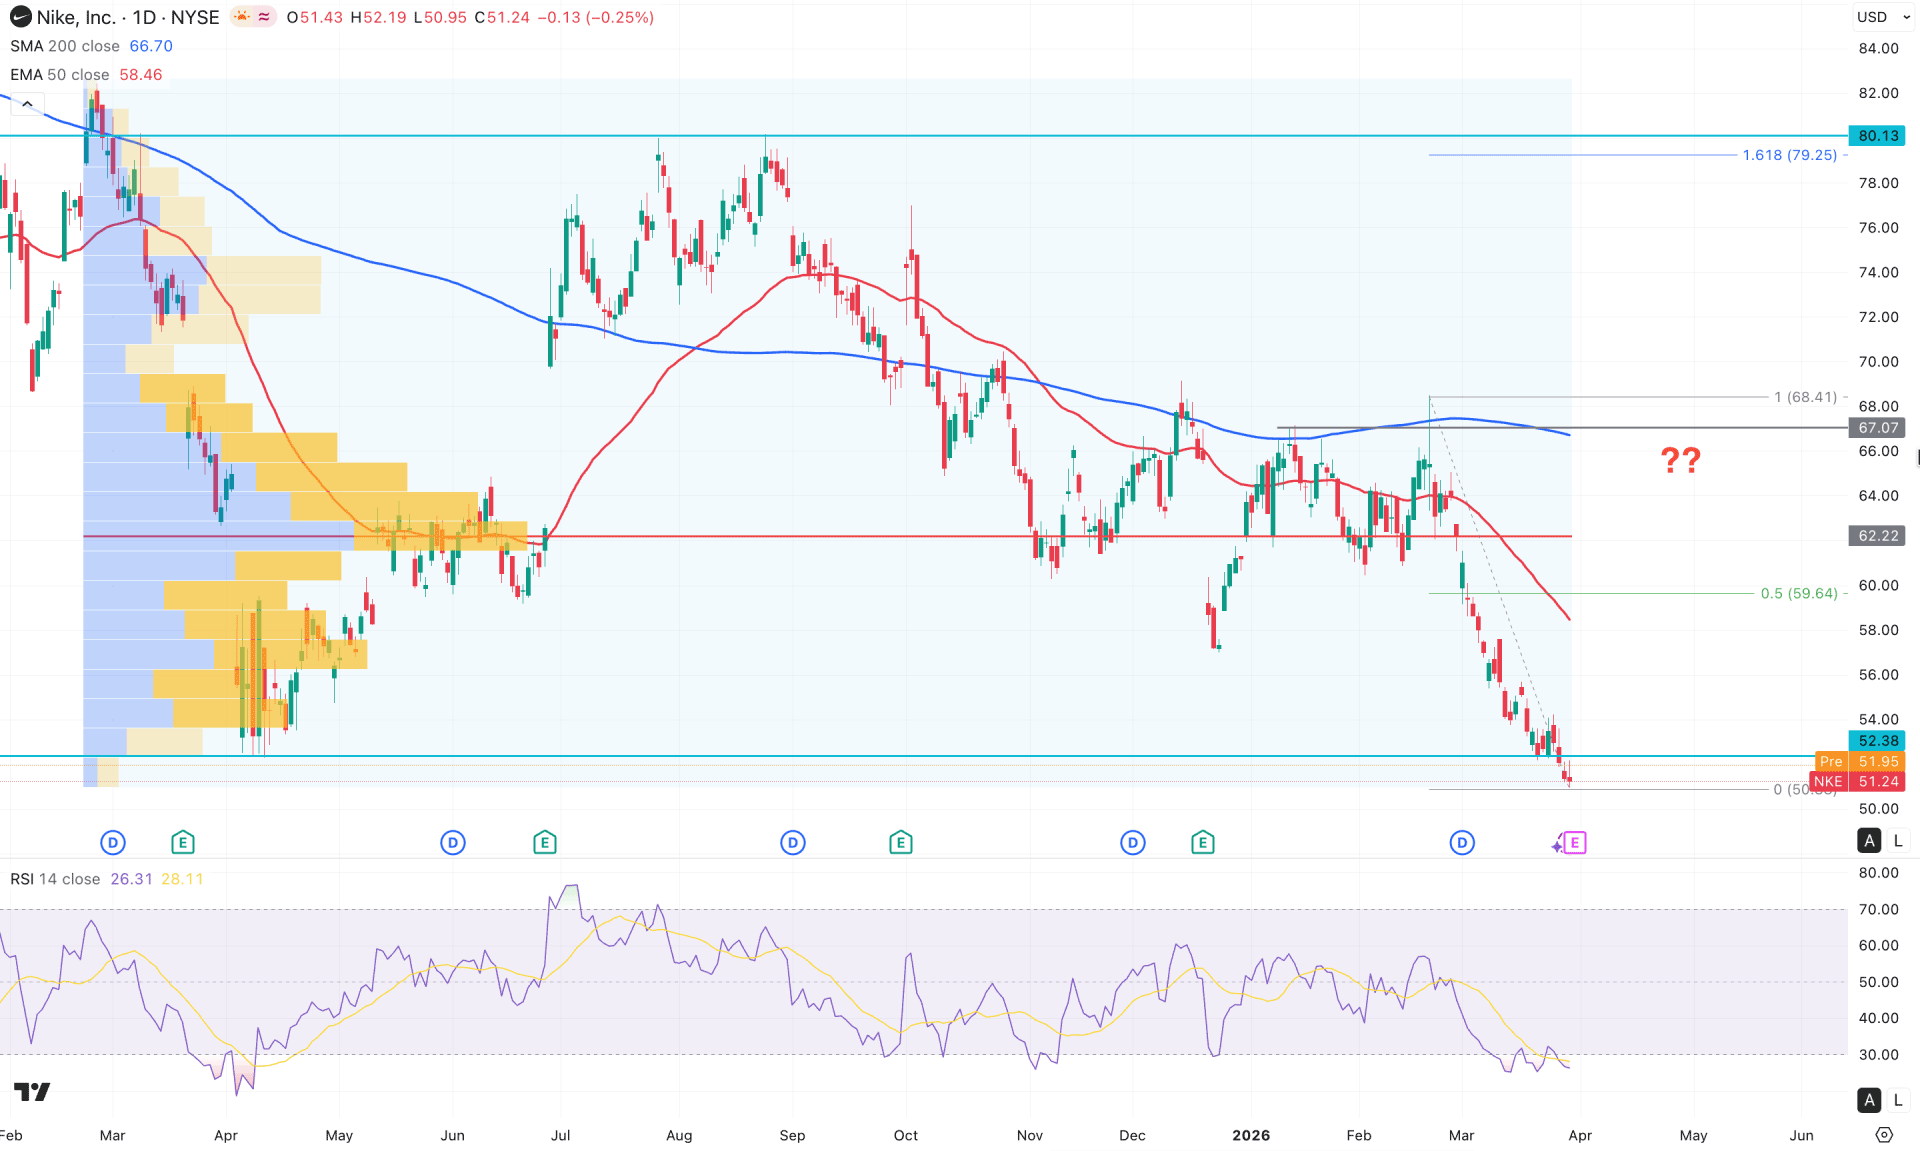
In the daily chart of NKE, the recent market momentum is bearish with no sign of a bottom formation. Primarily, the ongoing selling pressure has a higher possibility of extending the momentum before forming any long signal.
Looking at the higher timeframe, the recent monthly candle is strongly bearish, which came after five consecutive Doji formations. As the long-term momentum is bearish with a drop-base-drop formation, more downside pressure could come. The weekly timeframe shows a similar outlook, where the recent price is in a bearish overextended area. Primarily, a minor upward correction is pending, but the major trend remains unchanged until a bottom is formed.
In terms of the volume, sellers are in control of the price as the largest activity level since March 2025 is way above the current price, with no significant activity at the bottom.
In the daily chart, the 200-day SMA is the major resistance, which has a downward slope after a strong liquidity grab from the February 2026 peak. Moreover, the 50-day EMA is following the same structure, having a bearish slope within a death cross pattern.
On the other hand, the gap between the current price and dynamic lines has expanded, which increased the possibility of a bullish correction. However, as long as the major dynamic lines are untouched, the ongoing selling pressure could extend.
In the secondary indicator, the Relative Strength Index (RSI) represents an extreme selling condition as the recent line remains below the 30.00 line for a considerable time. Moreover, the strength of the trend is still weak as the current ADX is hovering below the 20.00 level.
Based on the daily market outlook, the NKE stock is struggling at a multi-year low, where a strong bull case is needed to validate the bottom. As the recent price is overextended at the low, a decent bullish correction is pending towards the 52.38 Fibonacci Retracement level. However, overcoming the 62.22 high volume line with a daily close might increase the possibility of testing the 80.13 high.
The alternative trading approach is to wait for a valid bearish reversal from the 58.00 to 67.29 zone that might extend the downside pressure towards the 40.00 psychological line.
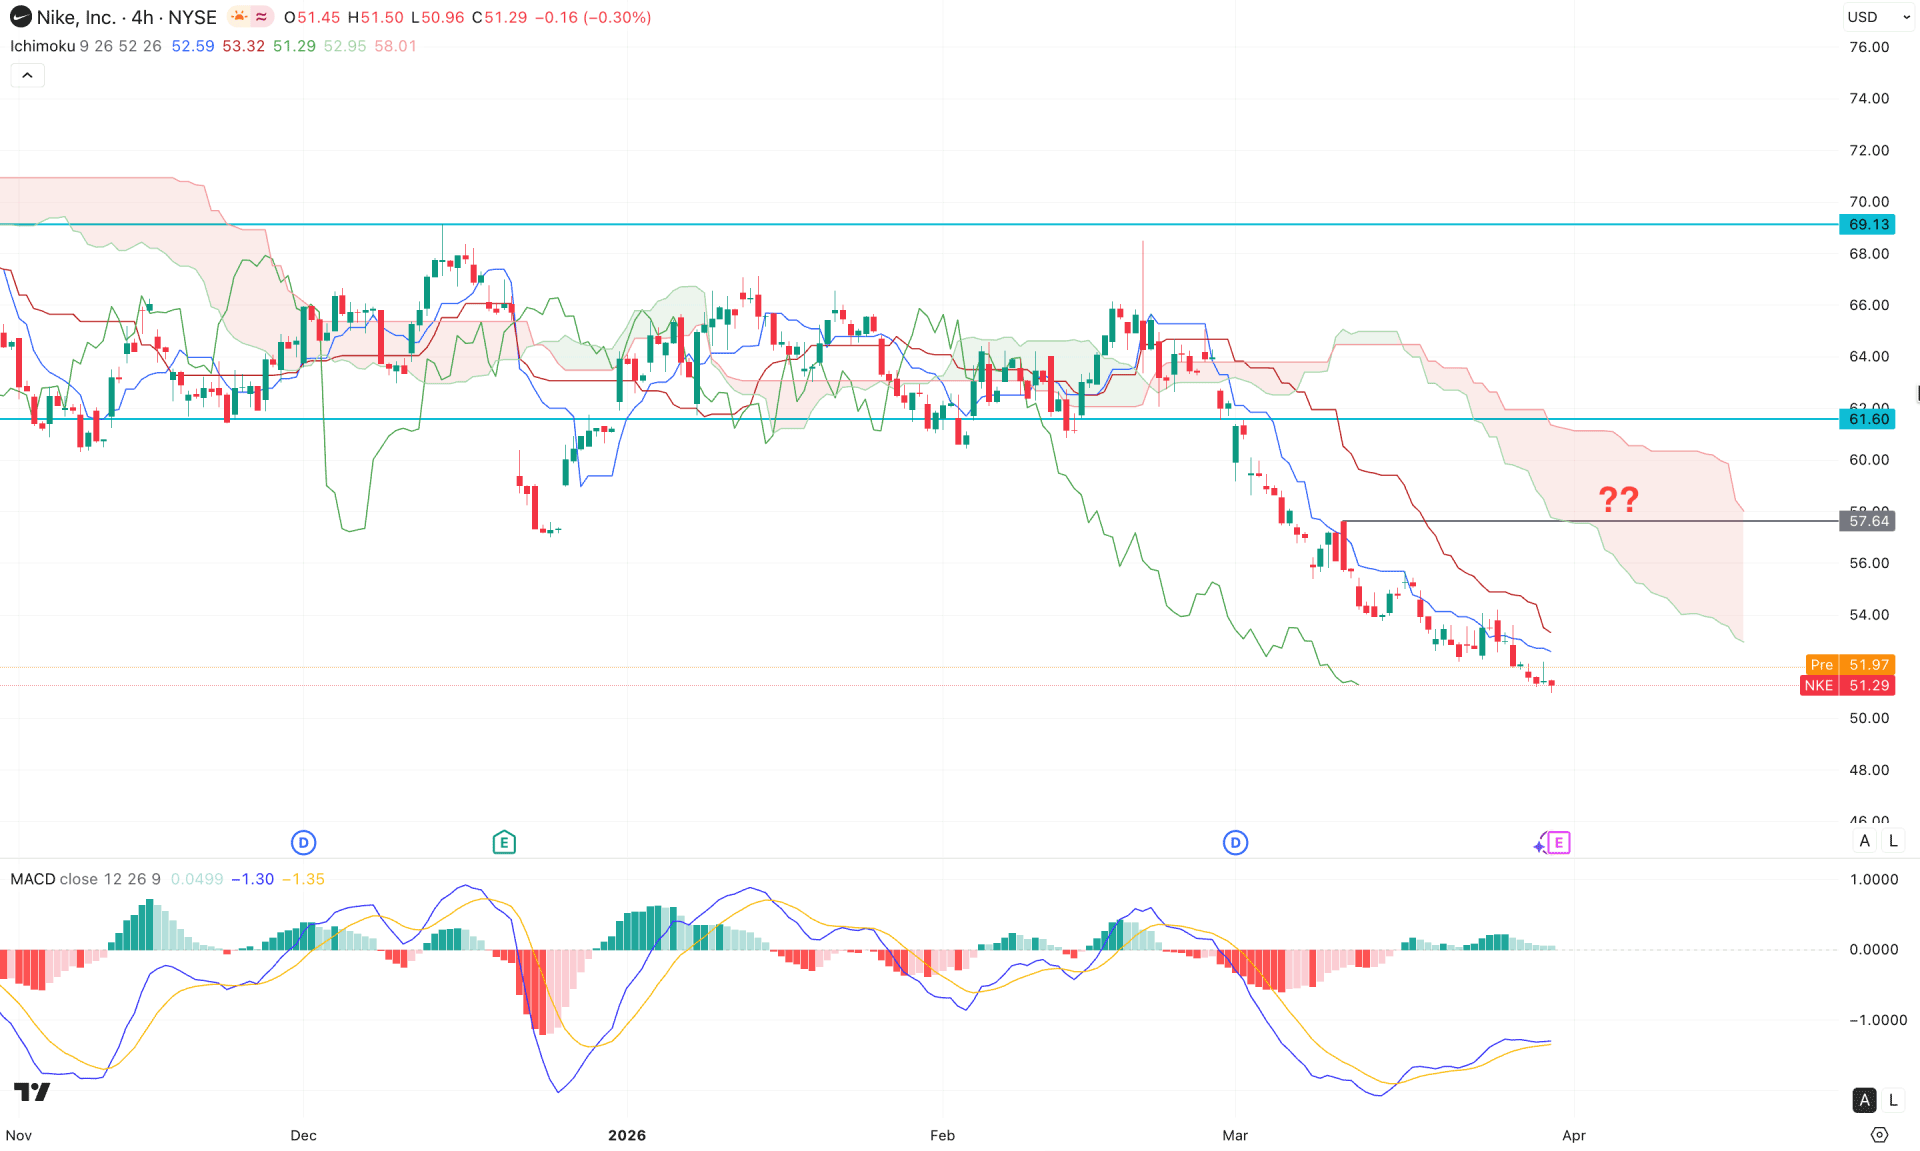
In the four-hour timeframe, the current price is trading within a bearish structure, forming deeper lower lows below the Kumo cloud area. Moreover, the future cloud appears strongly bearish, as both leading spans are trending downward with a widening gap.
On the other hand, selling pressure is becoming overextended following the range breakout, suggesting that a bullish correction may be pending.
In the secondary indicator window, the MACD histogram is failing to sustain buying pressure, even as the price continues to move lower. However, the signal line is showing a bullish correction, creating a divergence with the current price trend.
Based on this outlook, investors might expect a decent bullish correction, supported by divergence with the signal line. The immediate resistance is located at 57.64, which acts as a key barrier for the bullish correction. A breakout above this level, followed by consolidation, could invalidate the bearish continuation structure and increase the likelihood of testing the 68.00 level.
On the other hand, a valid bearish rejection from the 57.64 level could resume the existing downtrend, with the potential to form a new swing low below the 50.00 level.
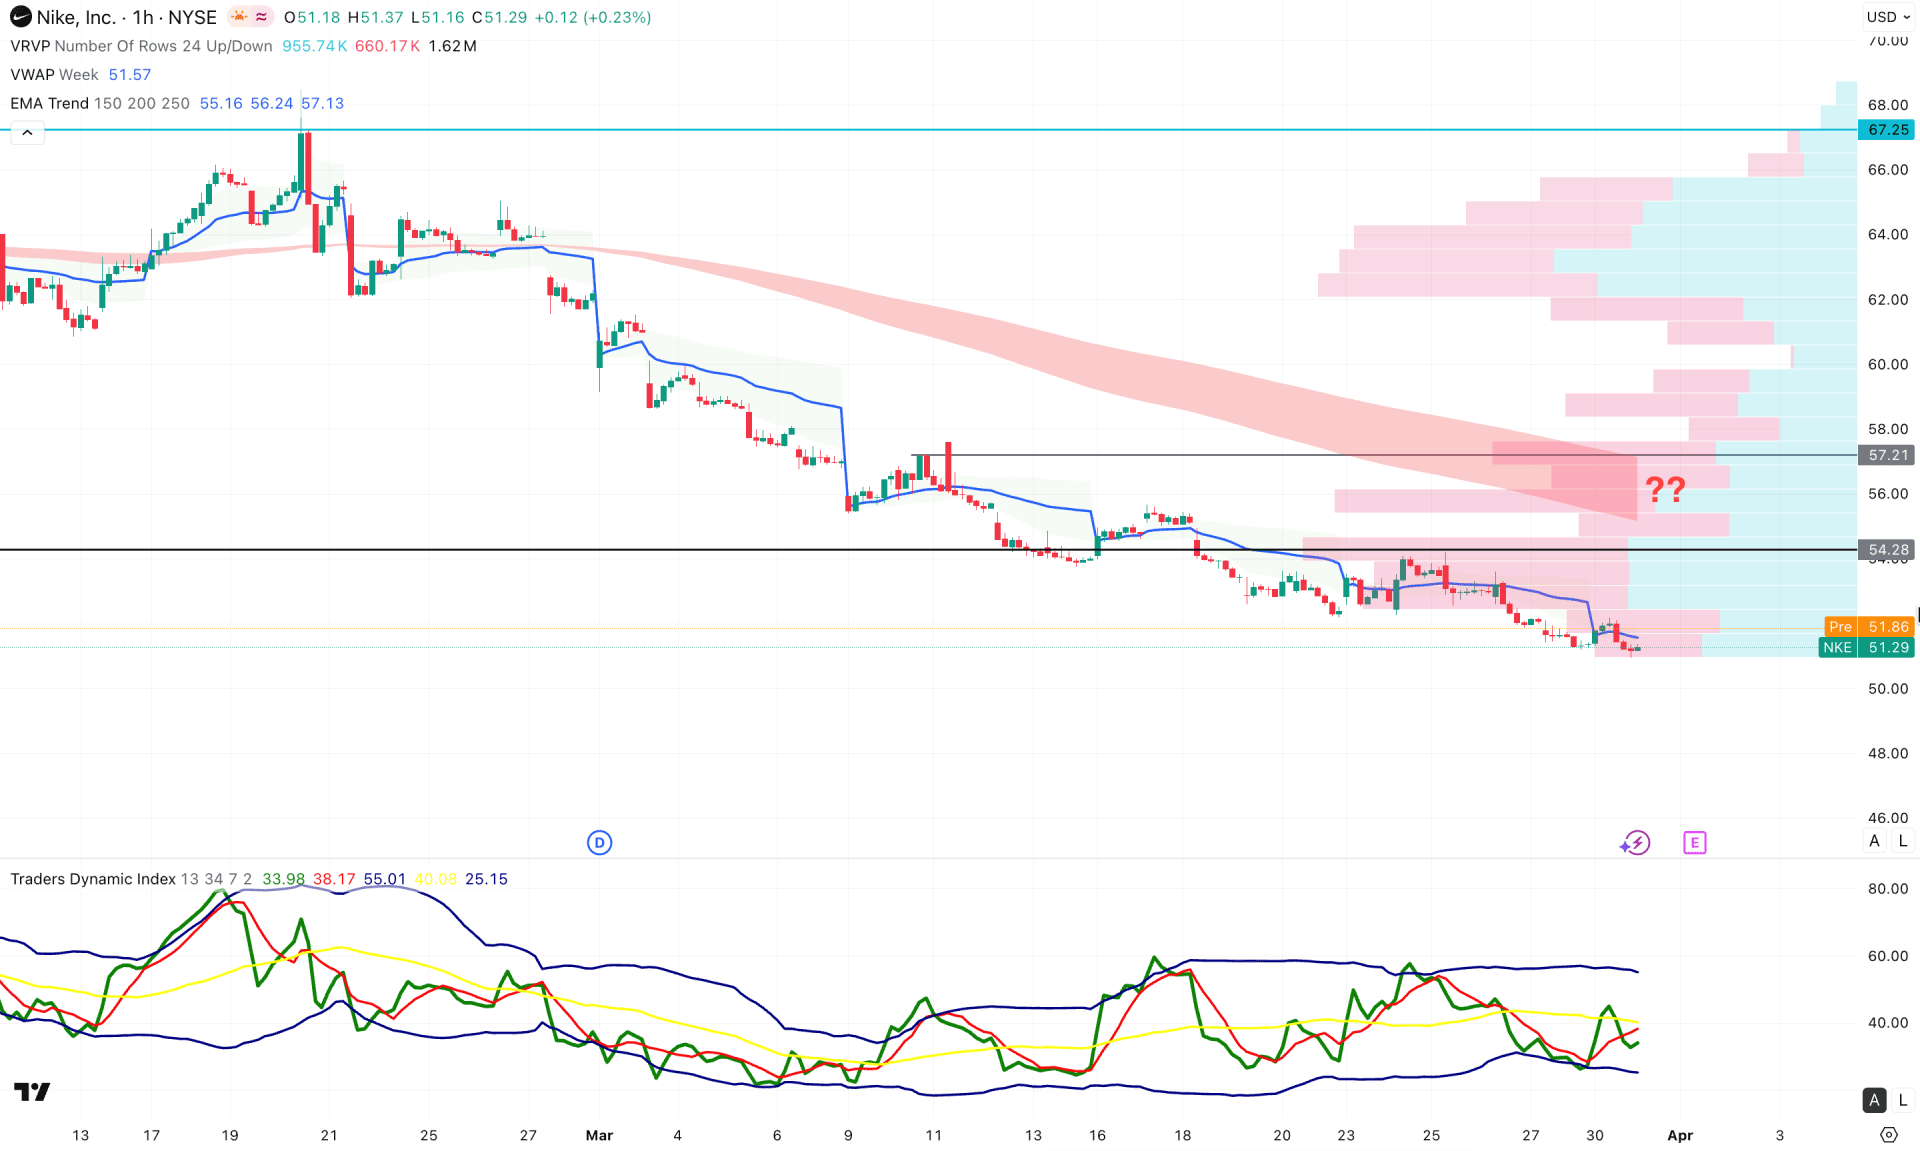
In the hourly timeframe, the price is experiencing strong selling pressure, as the dynamic weekly VWAP and exponential moving averages are positioned above the current price with a bearish slope.
In the secondary indicator window, the price is trading below the 50.000 neutral line, signaling ongoing selling pressure on the chart.
Based on the current market structure, the major trend remains bearish; however, a considerable bullish correction is pending. The immediate resistance target is the weekly VWAP level, from which a valid reversal could resume the existing trend.
Considering the overall market structure of NKE, the price is trading below the multi-EMA, and no signs of a bullish reversal are visible at the moment. Investors should closely monitor the upcoming earnings report, as strong fundamental support combined with a valid technical bottom formation could present a long opportunity. For now, the price is moving downward, with a higher probability of forming a new swing low.


