
Published: September 27th, 2022
In the latest earnings report released on 27 June 2022, Nike generated a revenue of $12.2 billion, 1% down from the previous year but 3% on a currency-neutral basis. The directly generated revenue came at $4.80 billion, indicating a 7% increase compared to the previous year.
This week will be significant for Nike investors as the company will release the earnings report this Thursday. As per analysts' projections, the revenue could come at $12.27 billion with earnings per share of $0.92. The higher expected revenue could be a bullish factor for the stock, while the recent price action is not supported.
The current Internal Rate of Return of the company is almost 15%, considering the 6% revenue growth rate and 8% EBID growth rate for the next 5 years. On the other hand, the current forward P/E ratio for the company is 25.98, which is 28% down from the 5-year average of 36.00.
Based on the internal rate of return and forward P/E ratio, the stock is trading at an undervalued rate, which may work as a bullish factor.
Let’s see the future price action for the Nike Inc Stock from Nike Stock (NKE) technical analysis.
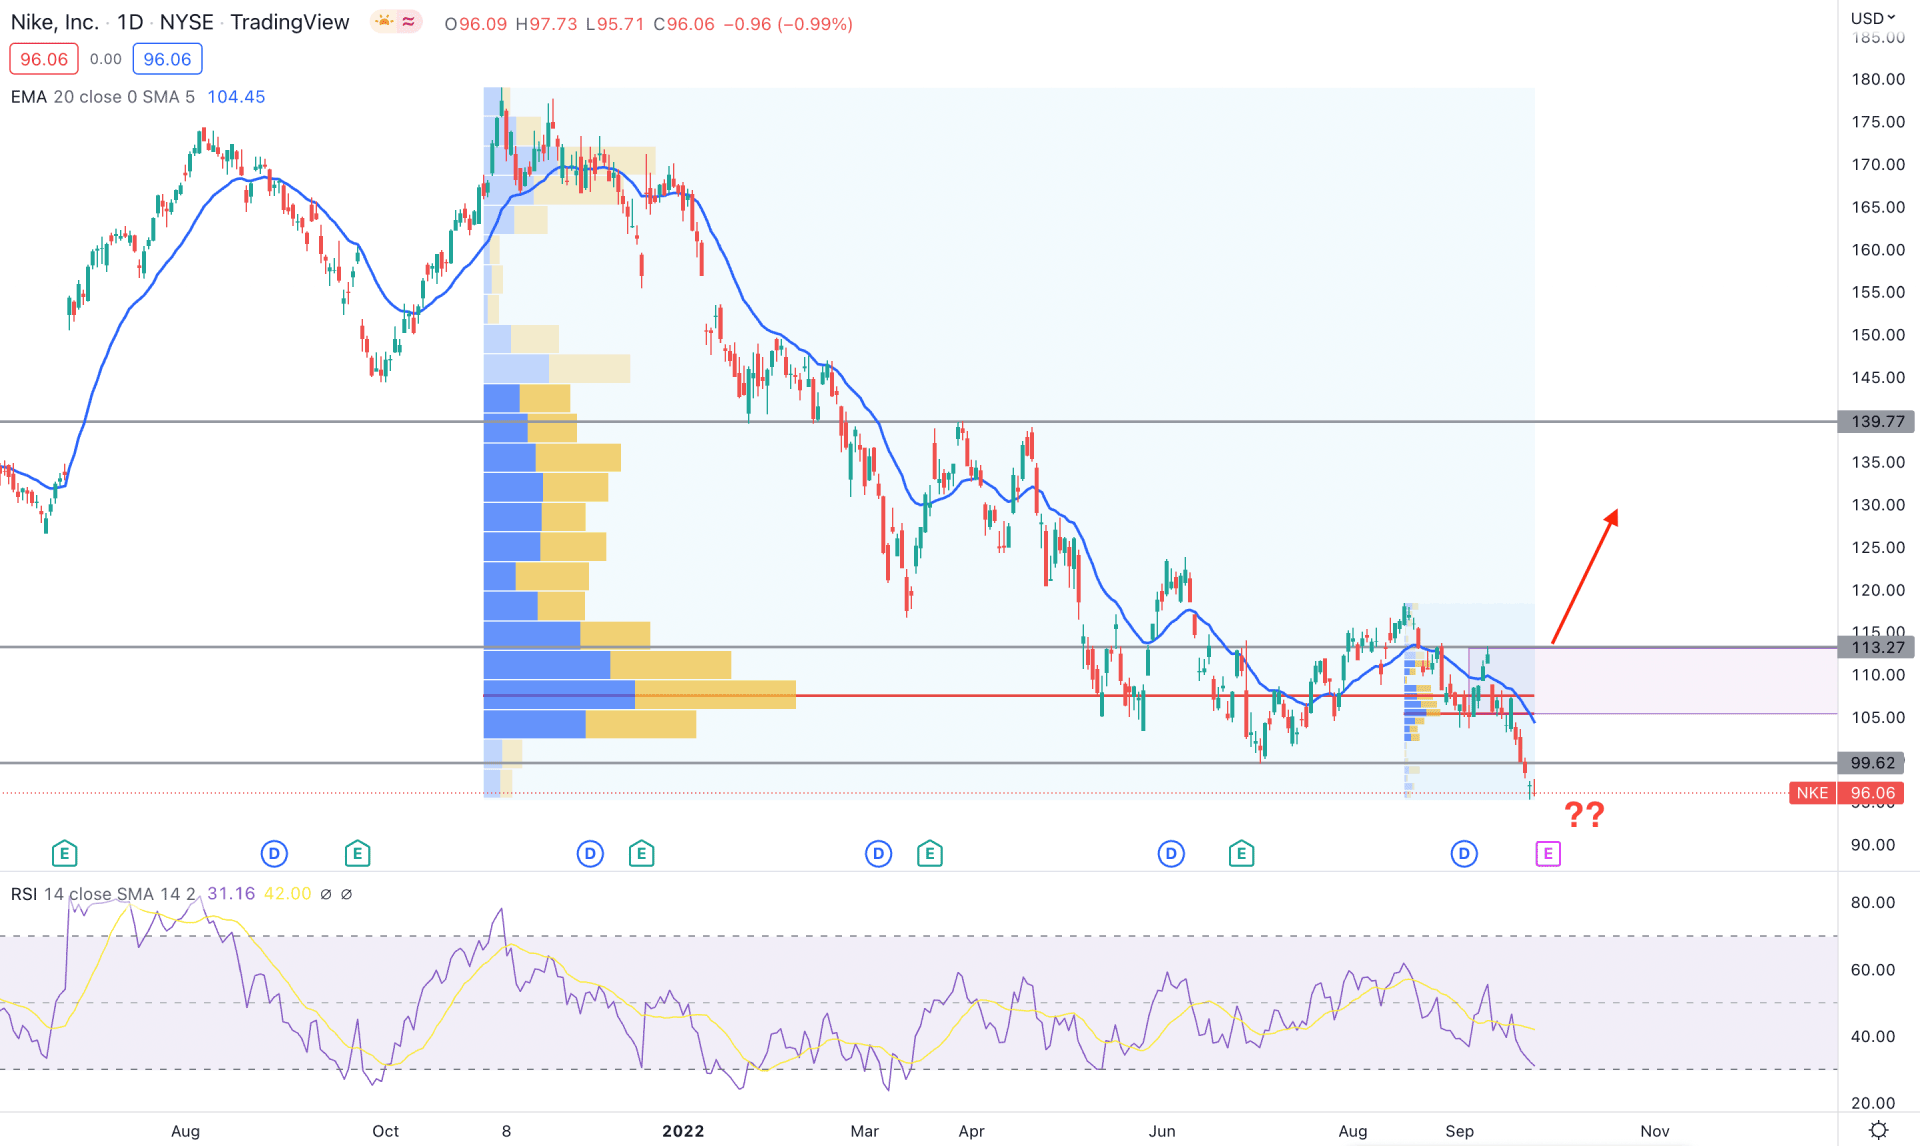
Technically Nike Stock is trading with strong selling pressure as the current price is trading below the multiple high volume levels. The highest trading volume from October 2021 high to September 2022 low is 107.58, indicating that the recent selling pressure was stronger than in the last 1 year. Moreover, the high volume level for August high to September low is 105.45, which also supports the massive selling pressure in this pair.
As the broader stock market is facing pressure from the stronger US Dollar, the price could extend the selling pressure if the earnings report fails to show a better-than-expected result. However, a minor bullish correction is pending in this instrument as the dynamic 20 DMA is above the current price while the Relative Strength Index reached the oversold zone.
Based on the daily price prediction of Nike stock, has a higher possibility of extending the bearish trend until the price breaks out above the 113.27 key resistance level. In that case, the buying pressure may extend toward the 139.77 level.
On the other hand, the minor bullish correction and a bearish rejection from 113.27 to 105.20 zone could open a bearish opportunity, targeting the 80.00 level.
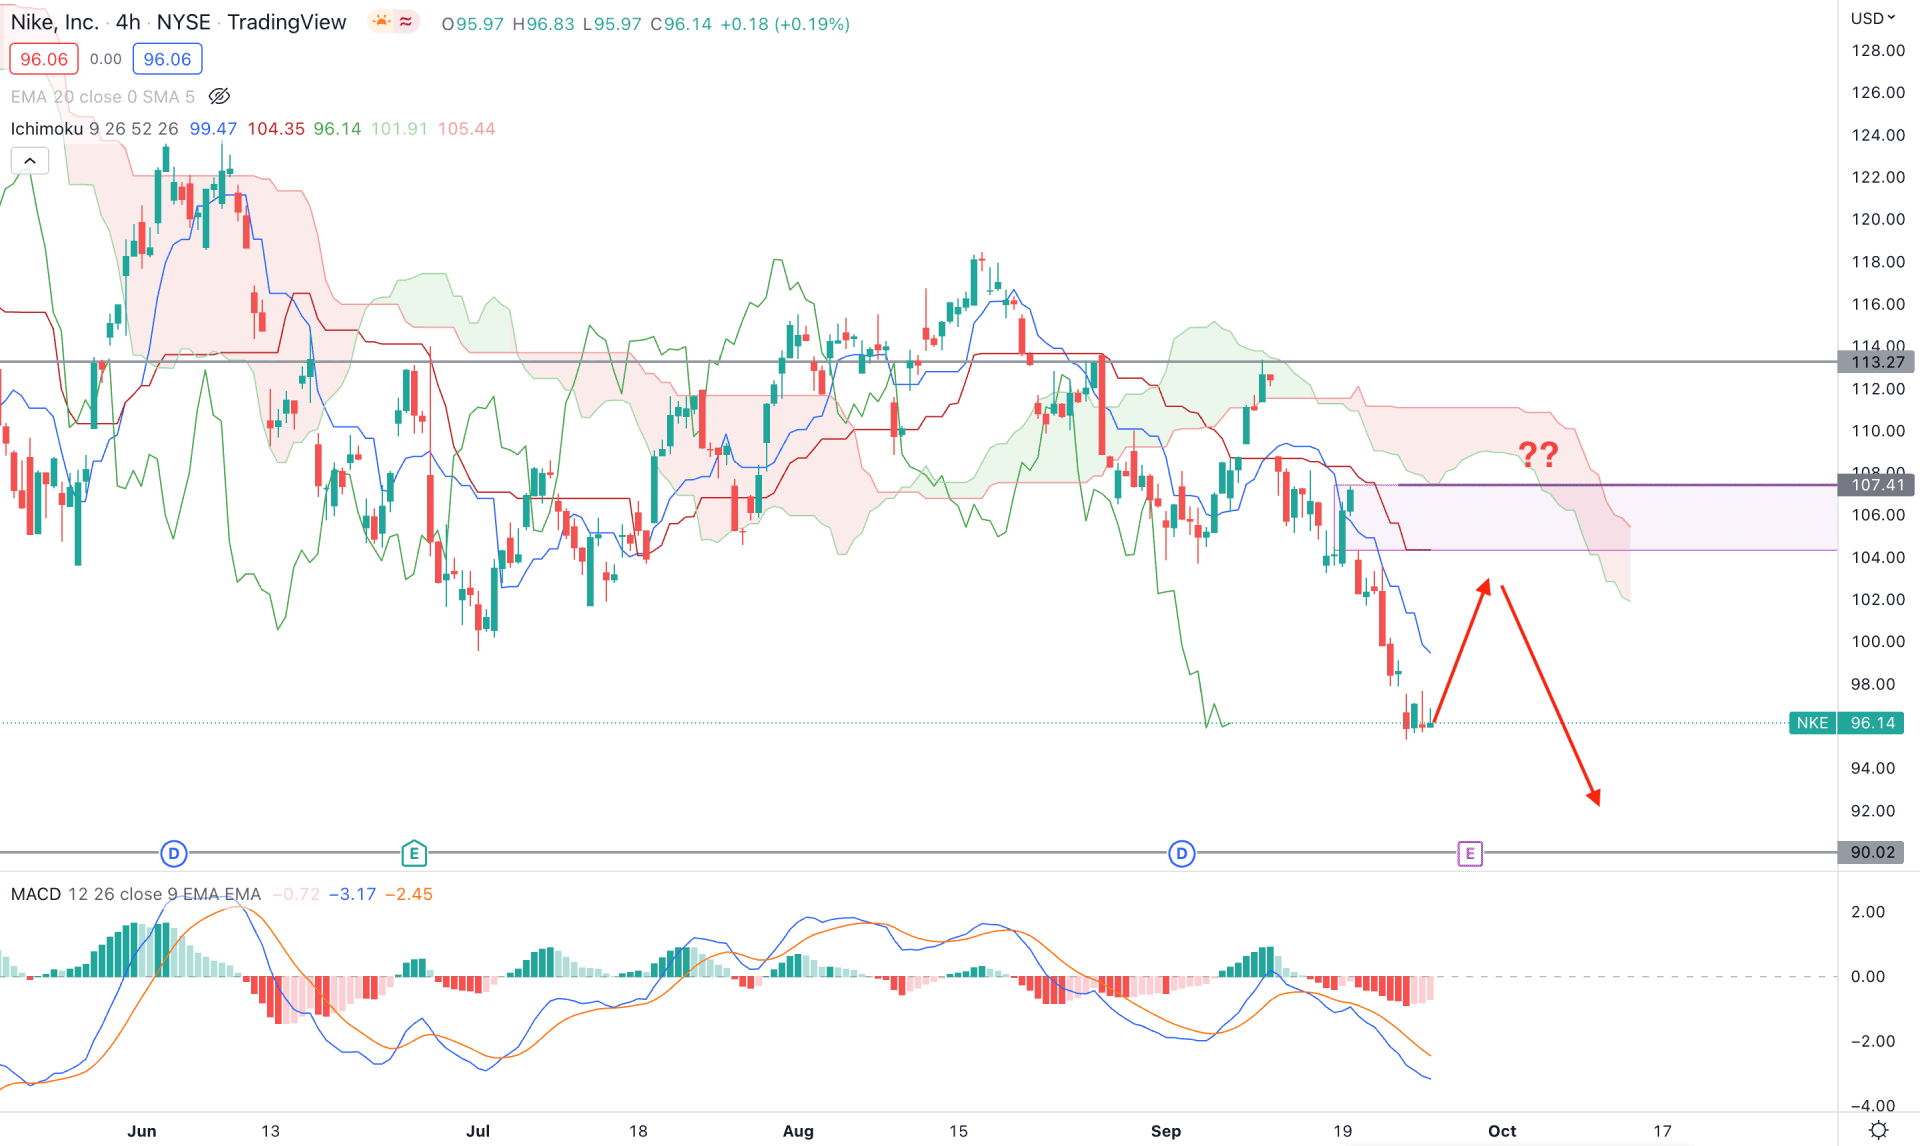
The Nike stock H4 timeframe shows a strong bearish trend, where the current price moved below the Kumo Cloud and made a new swing low. As a result, the gap between the price and dynamic Kijun Sen has extended, increasing the possibility of a bullish correction.
In the future cloud, the Senkou Span A and B are moving down, while the Lagging Span is already below the price from that level. The indicator window also shows the same story, where the MACD Histogram is moving up within the bearish zone, which is a sign of bullish recovery.
Based on the H4 price prediction, bears may regain momentum if the price moves up and shows a bearish rejection from the near-term resistance level. However, breaking above the 113.27 level with a bullish daily candle can alter the current market structure and increase the buying pressure towards the 128.00 area.
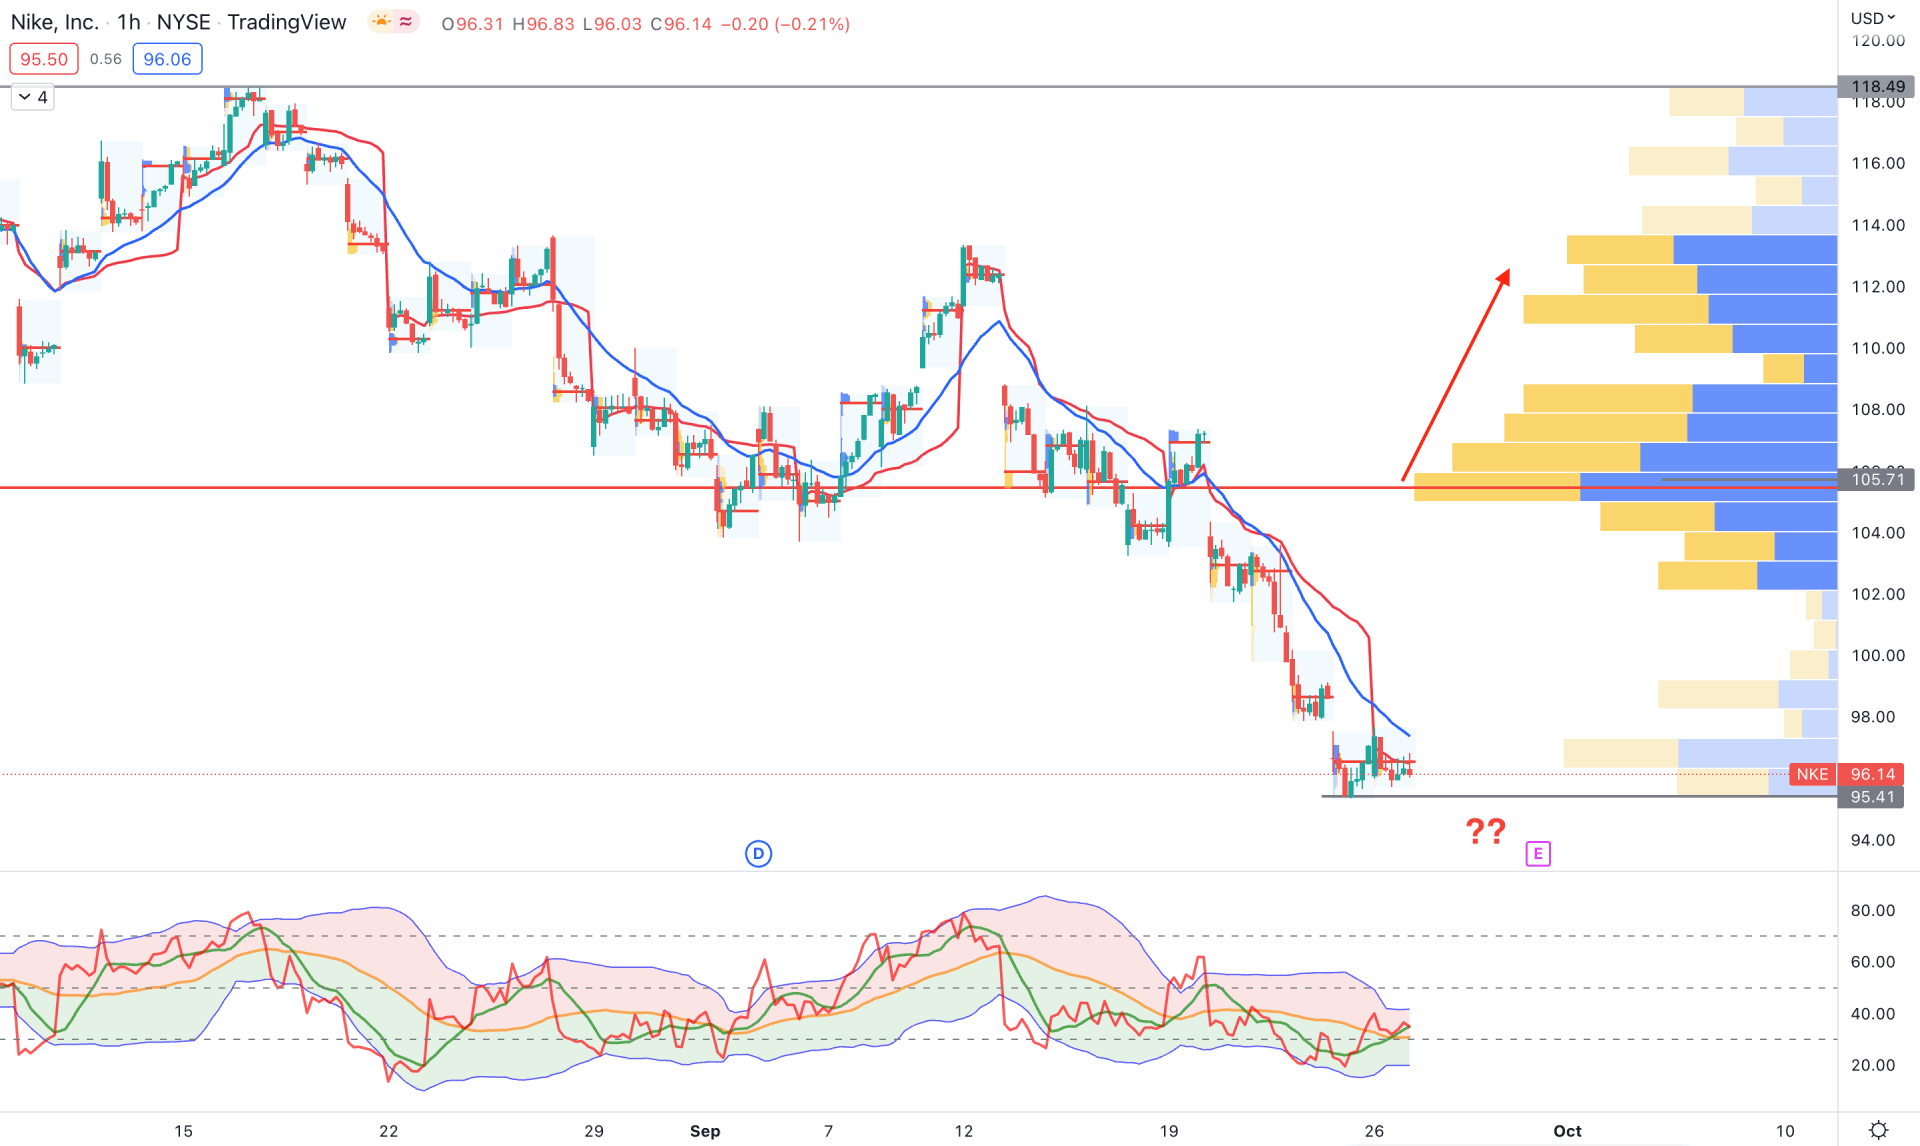
Nike stock (NKE) might show increased volatility before the earnings report release. However, the current market trend in the H1 timeframe is bearish while the most recent price moved 15% down from the immediate swing high of 113.28.
Based on the visible range volume, the highest trading volume was present at the 105.70 level since 15 August. Therefore, this instrument's primary outlook is bearish as long as it remains below the 105.70 high volume level.
The 20 Exponential Moving Average and weekly VWAP are closer to the price, working as immediate resistance. However, the gap between the price and high volume 105.70 level is high, while the TDI level is above the 50% area.
Based on the intraday price prediction of Nike stock (NKE), an immediate bearish pressure and H1 close below the 95.41 level could lower the price towards the 90.00 level. However, a bullish recovery and H1 close above the dynamic 20 EMA could increase the price towards the 104.00 area.
Based on the current analysis, Nike Stock (NKE) needs a strong bullish breakout for a bullish opportunity. Moreover, investors should monitor how the earnings report is coming on Thursday, where better-than-expected releases could work as a bullish signal.


