
Published: January 22nd, 2025
As of the same period a year earlier, NextEra Energy (NEE) is expected to announce quarterly profits of $0.51 per share in its next report, which would represent a 1.9% decrease. Revenues are anticipated to be $6.52 billion, a 5.3% decline from the previous year.
The current level of the average EPS forecast for the quarter is the result of a 6.6% upward revision throughout the past thirty days. This represents the overall reexamination of the covered analysts' original projections for this period.
The analyst community as a whole believes that "Operating Revenues-Florida Power & Light (FPL)" ought to amount to $4.36 billion. The estimate indicates an alteration of +3.9% year over year.
'Operating Revenues-NextEra Energy Resources (NEER)' is expected to hit $2.23 billion, according to analysts. According to the projection, there was a 16.2% transition from the quarter of the previous year.
Analysts expect that "Operating Income (Loss)-NextEra Energy Resources (NEER)" will be $599.05 million on average. The business stated $1.05 billion in the exact same period last year, which is more than the current estimate.
Is it the right time to buy the NextEra Stock? Let's see the complete outlook from the NEE technical analysis:
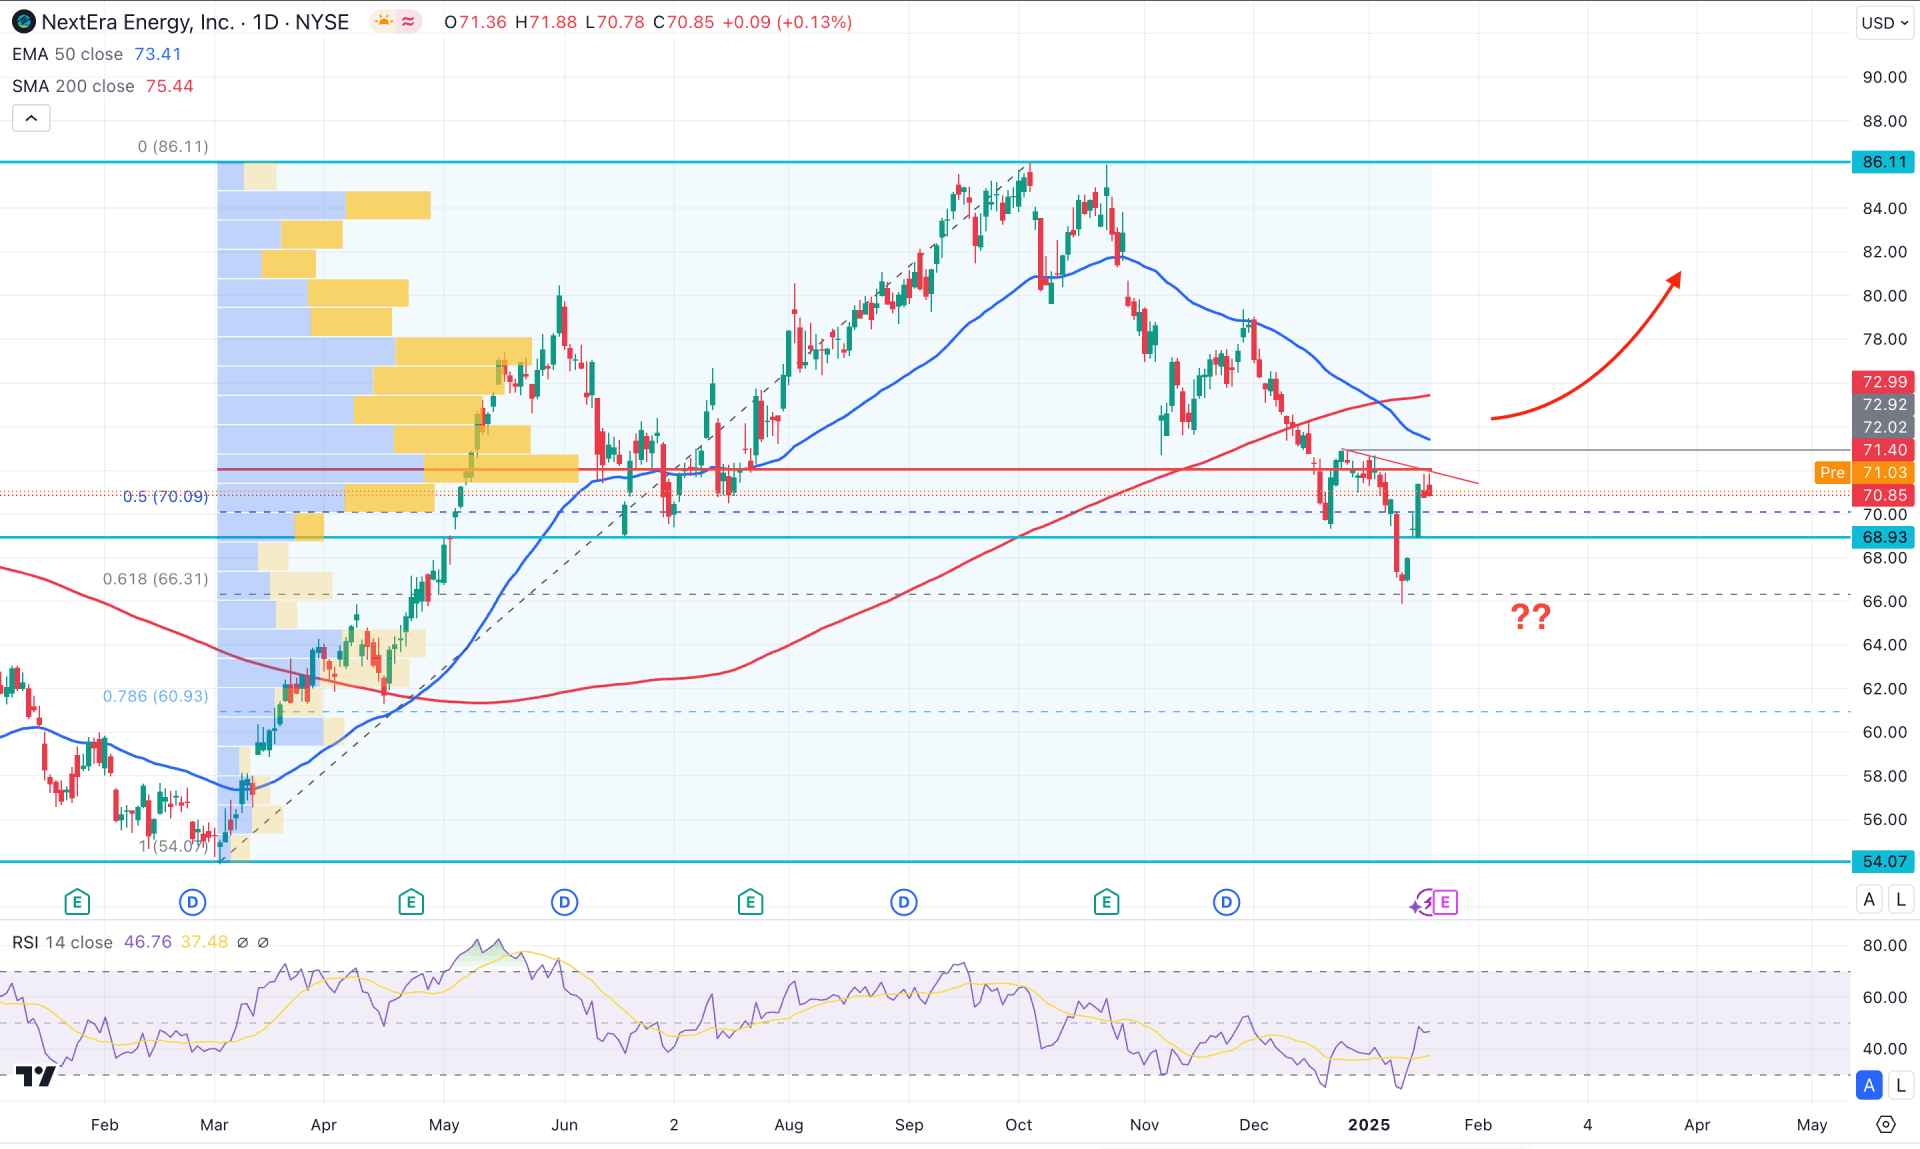
In the daily chart of NEE, the tradable range is visible as the recent price showed a selling pressure from the 86.11 top. On the downside, the existing bullish reversal is present from the 54.07 low, suggesting a valid bottom. The current price is hovering below the 50% Fibonacci Retracement level of this swing, suggesting a discounted zone. Considering the context, the primary aim for this stock is to look for long trades once a valid bullish rebound comes from the discounted zone.
In the higher timeframe, prolonged selling pressure has been seen for the last four months, creating a valid dip. However, the price is still trading below the December 2024 close, from which a rebound could signal buyers' dominance in the market.
Moreover, the most high volume line since March 2024 is just above the current price, working as a resistance. As a potential range is visible within the high-volume area, a decent trend trading opportunity might come after forming a valid breakout.
In the main chart, a Death Cross formation is visible as the 50-day EMA is below the 200-day SMA line, signaling a selling pressure. However, the price has yet to test the near-term resistance, and valid rejection from that level could be a short opportunity.
Based on the daily outlook of NEE, the ongoing market trend is bullish, where an upward continuation is likely to happen. Investors should closely monitor how the price trades at the trendline resistance. A valid bullish reversal with a daily candle above the 72.02 high could be a long opportunity, aiming for the 86.11 resistance level.
On the bearish side, a failure to overcome the 50-day EMA could be a challenging factor for bulls. In that case, a bearish daily close below the 68.00 level might extend the selling pressure toward the 60.93 support level.
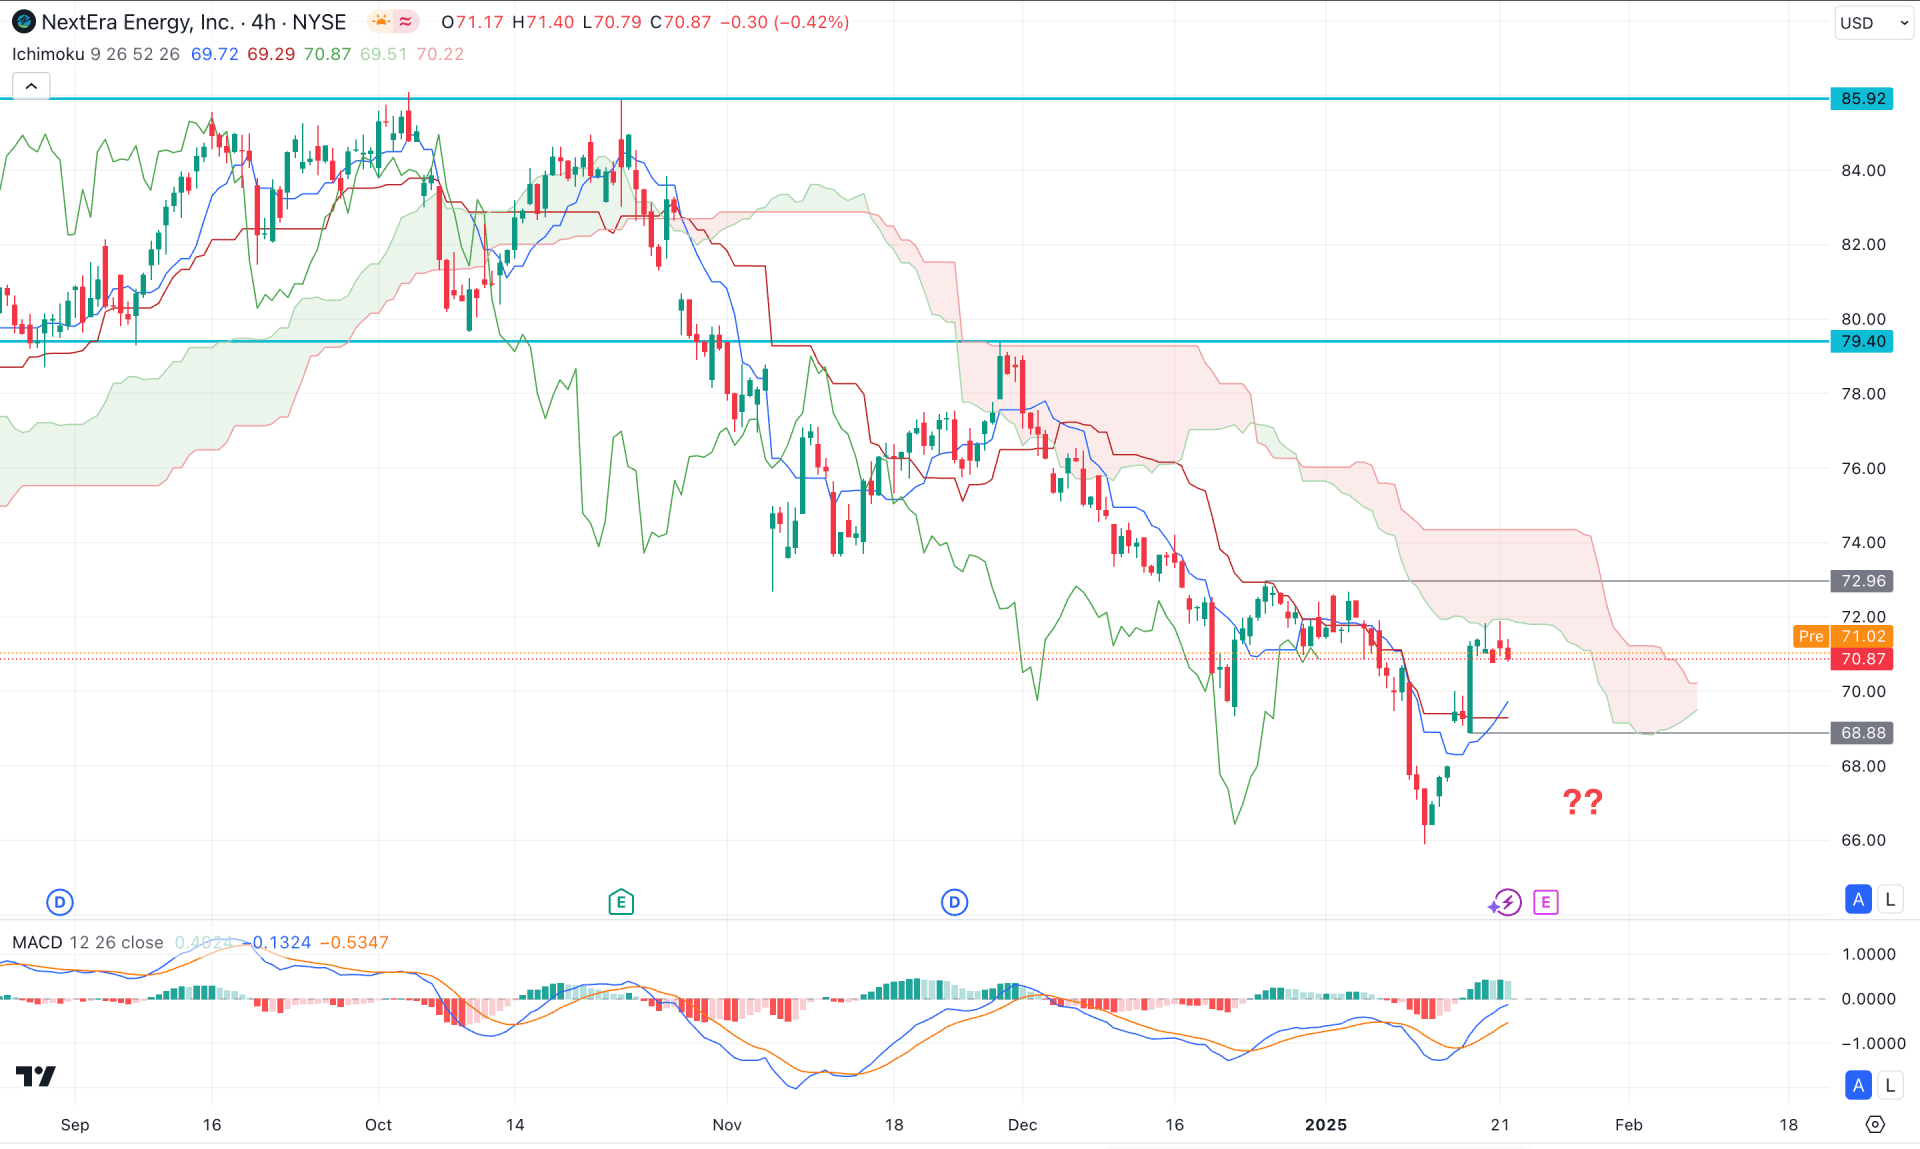
In the H4 timeframe, the recent price hovers below the Ichimoku Cloud zone, suggesting a bearish trend continuation in the intraday market. However, the thickness of the Futures Cloud signals a challenge to bears as the Senkou Span A failed to maintain the downward slope.
In the indicator window, the MACD Histogram maintains the momentum above the neutral line, while the Signal line forms a bullish crossover at the bottom.
Based on this outlook, investors should closely monitor how the price trades at the Ichimoku Cloud resistance area. A valid bullish breakout above the cloud high could extend the buying pressure above the 79.40 resistance level.
On the other hand, an immediate selling pressure below the 68.88 low could signal a trend continuation towards the 62.00 area.
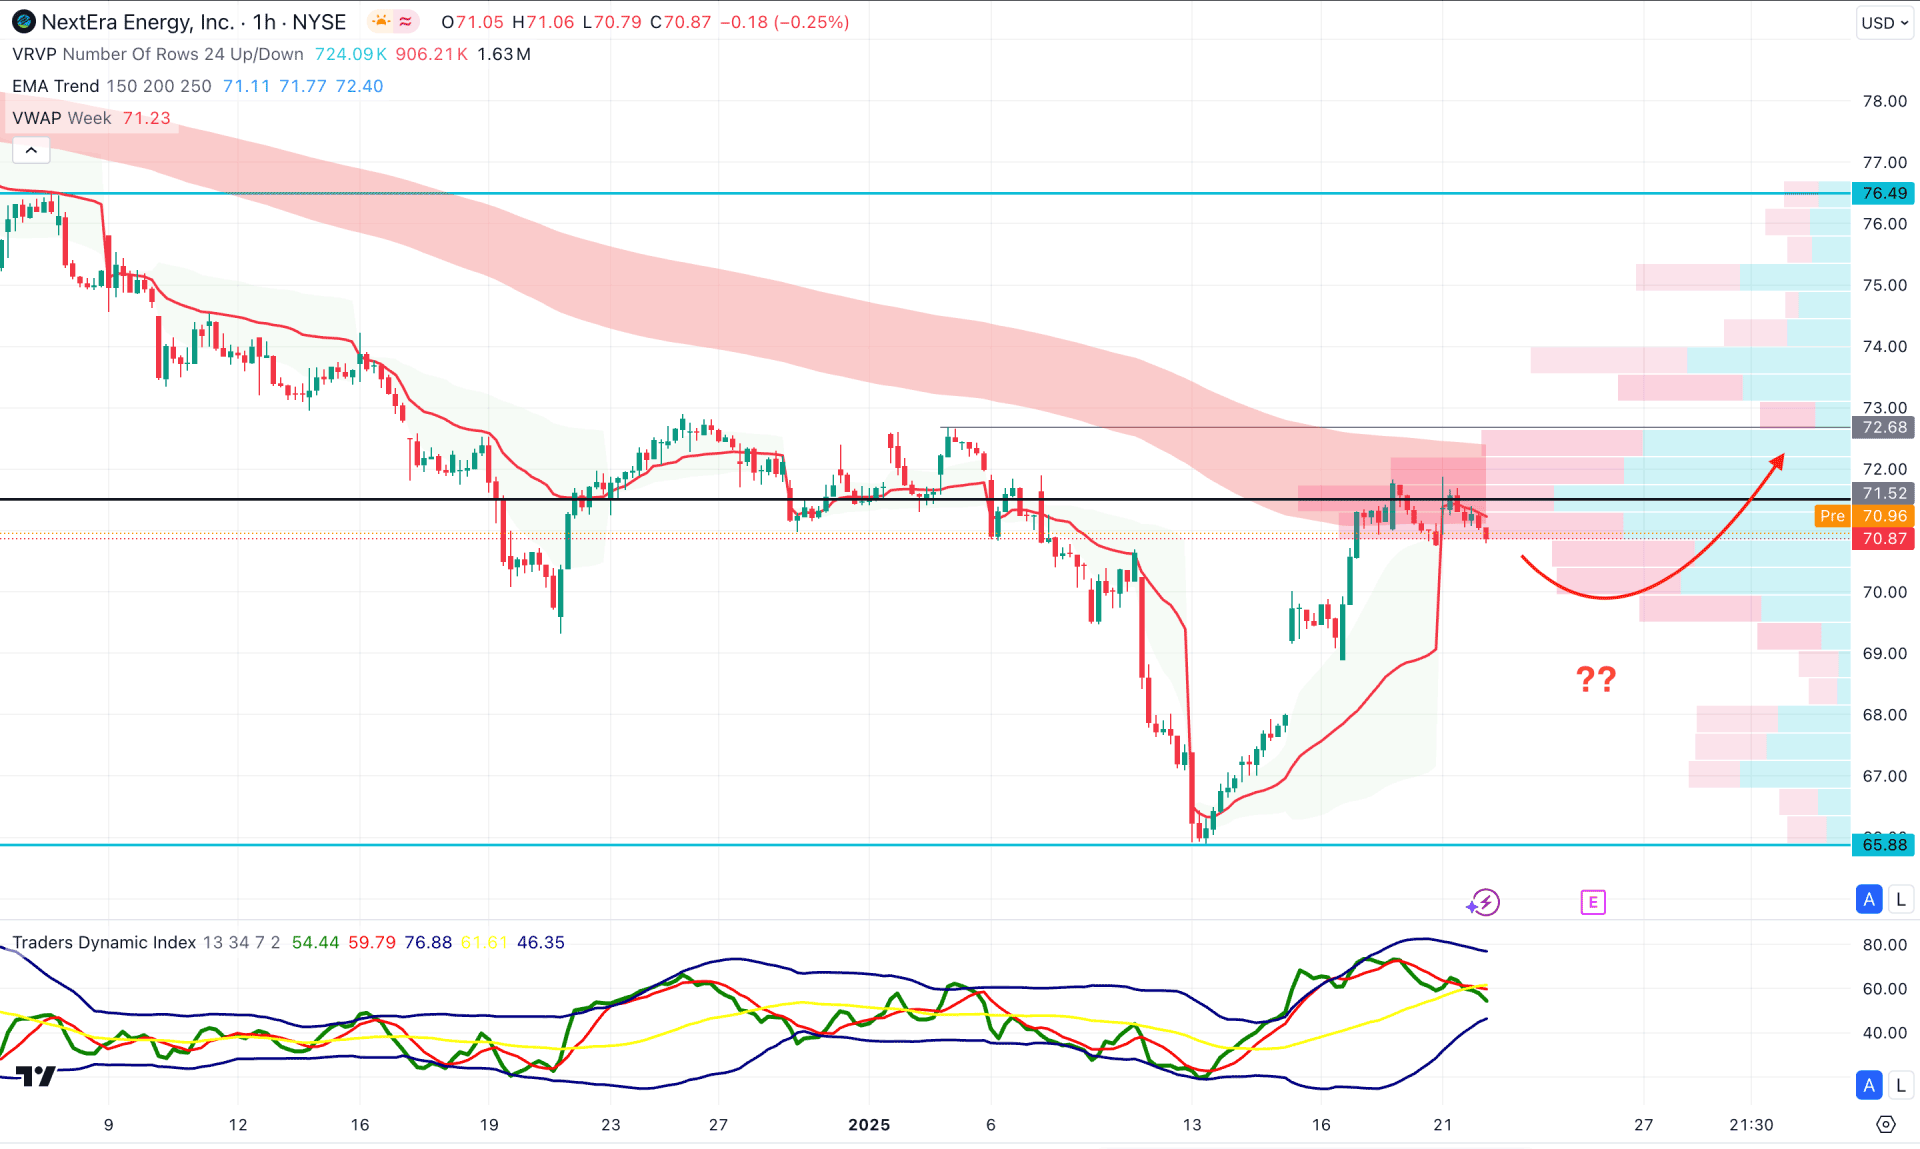
In the H1 timeframe, the price shows an intraday selling pressure as the Moving Average Wave acts as a valid resistance. Moreover, the visible range high volume line is just above the current price, working as a confluence of bearish pressure.
Moreover, the weekly VWAP is hovering at the current price area, suggesting an indecision to the existing market momentum. The indicator window shows a possible selling pressure as the Traders Dynamic Index (TDI) has found a ceiling before aiming lower below the 50.00 level.
Based on this outlook, an immediate bullish breakout above the MA wave could validate the recent V-shape recovery. In that case, the price might extend the upward pressure towards the 76.49 resistance level.
Based on the current market structure, the NEE is more likely to extend the buying pressure after forming a valid swing high from the current range. The intraday price is still bearish, whereas an early buy signal might come from a bullish change of character formation.


