Published: May 10th, 2023
NEXO/USDT price has shown a strong correction in recent weeks, increasing the possibility of a strong breakout. The weekly price shows a 6% increase, while the candle pattern indicates a potential bullish breakout.
Nexo, a prominent institution in the realm of digital assets, endeavours to increase the value and effectiveness of such assets by offering a comprehensive selection of products. These include advanced trading solutions customized for both retail and institutional clients, aggregating liquidity from leading venues, and providing tax-efficient credit lines secured by assets.
Nexo expanded its business in 2022 by establishing Nexo Ventures, an investment arm that presently manages a portfolio of over sixty companies. Over 130 billion dollars in transactions have been entrusted to Nexo by over five million users in over two hundred jurisdictions.
Nexo's native currency is the NEXO Token, an ERC-20 token based on Ethereum. This token grants holders access to the various tiers of the Nexo Loyalty Program. The token, which is traded on the open market, provides a variety of advantages, including preferential borrowing rates, cash-back, free withdrawals, and greater yield rates.
Let’s see the future price direction of Nexo from the NEXO/USDT technical analysis:

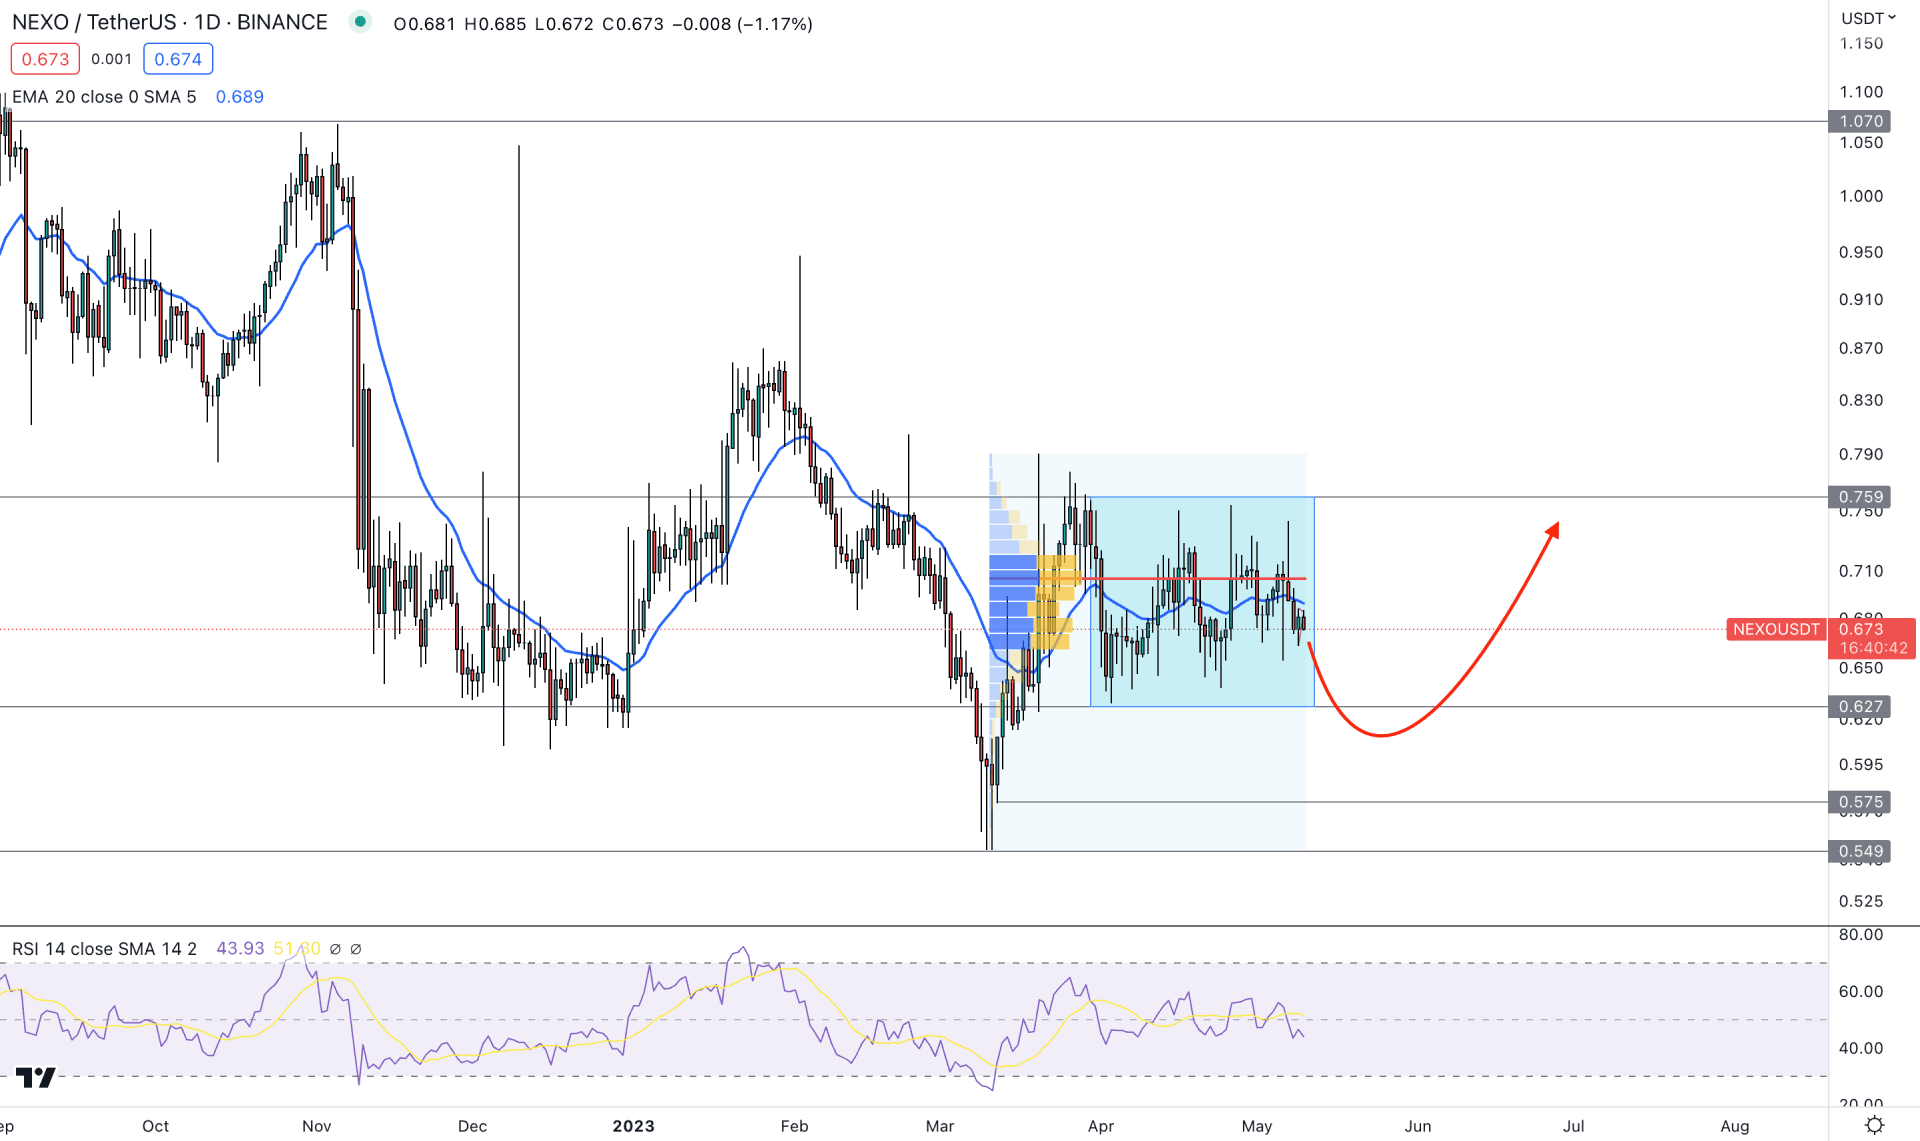
In the daily chart of NEXO/USDT, the broader market structure is extremely correct as the current price remained within a rectangular pattern.
The weekly price also supports the daily context, where multiple indecision candle formations are seen in the last 2-3 months. In that case, investors should wait for a valid breakout and retest before experiencing a stable trend.
Despite the consolidation, the latest high volume level since 10 March 2023 is spotted above the current price, which is a sign of active selling pressure in the market.
The ideal trading approach from a range is to look for a false breakout on the opposite side of the trend as a liquidity sweep. For NEXO/USDT, bulls should wait for the price to come below the 0.627 rectangle pattern low and immediately recover above this level. Later on, a valid break with a candle close above the 0.759 level would extend the buying pressure towards the 1.070 area.
In the main chart, the dynamic 20 EMA is almost flat due to the consolidation, while the current Relative Strength Index (RSI) is below the 50.00 level.
Based on the daily price projection, NEXO/USDT bulls should wait for a valid bullish breakout and a daily candle close above the 0.759 level. In that case, the trading approach would be to look for long trades only, where the ultimate target is to test the 1.070 resistance level.
As the current momentum is indecisive, a strong sell-side pressure may come, where a break below the 0.627 level might lower the price towards the 0.549 support level.

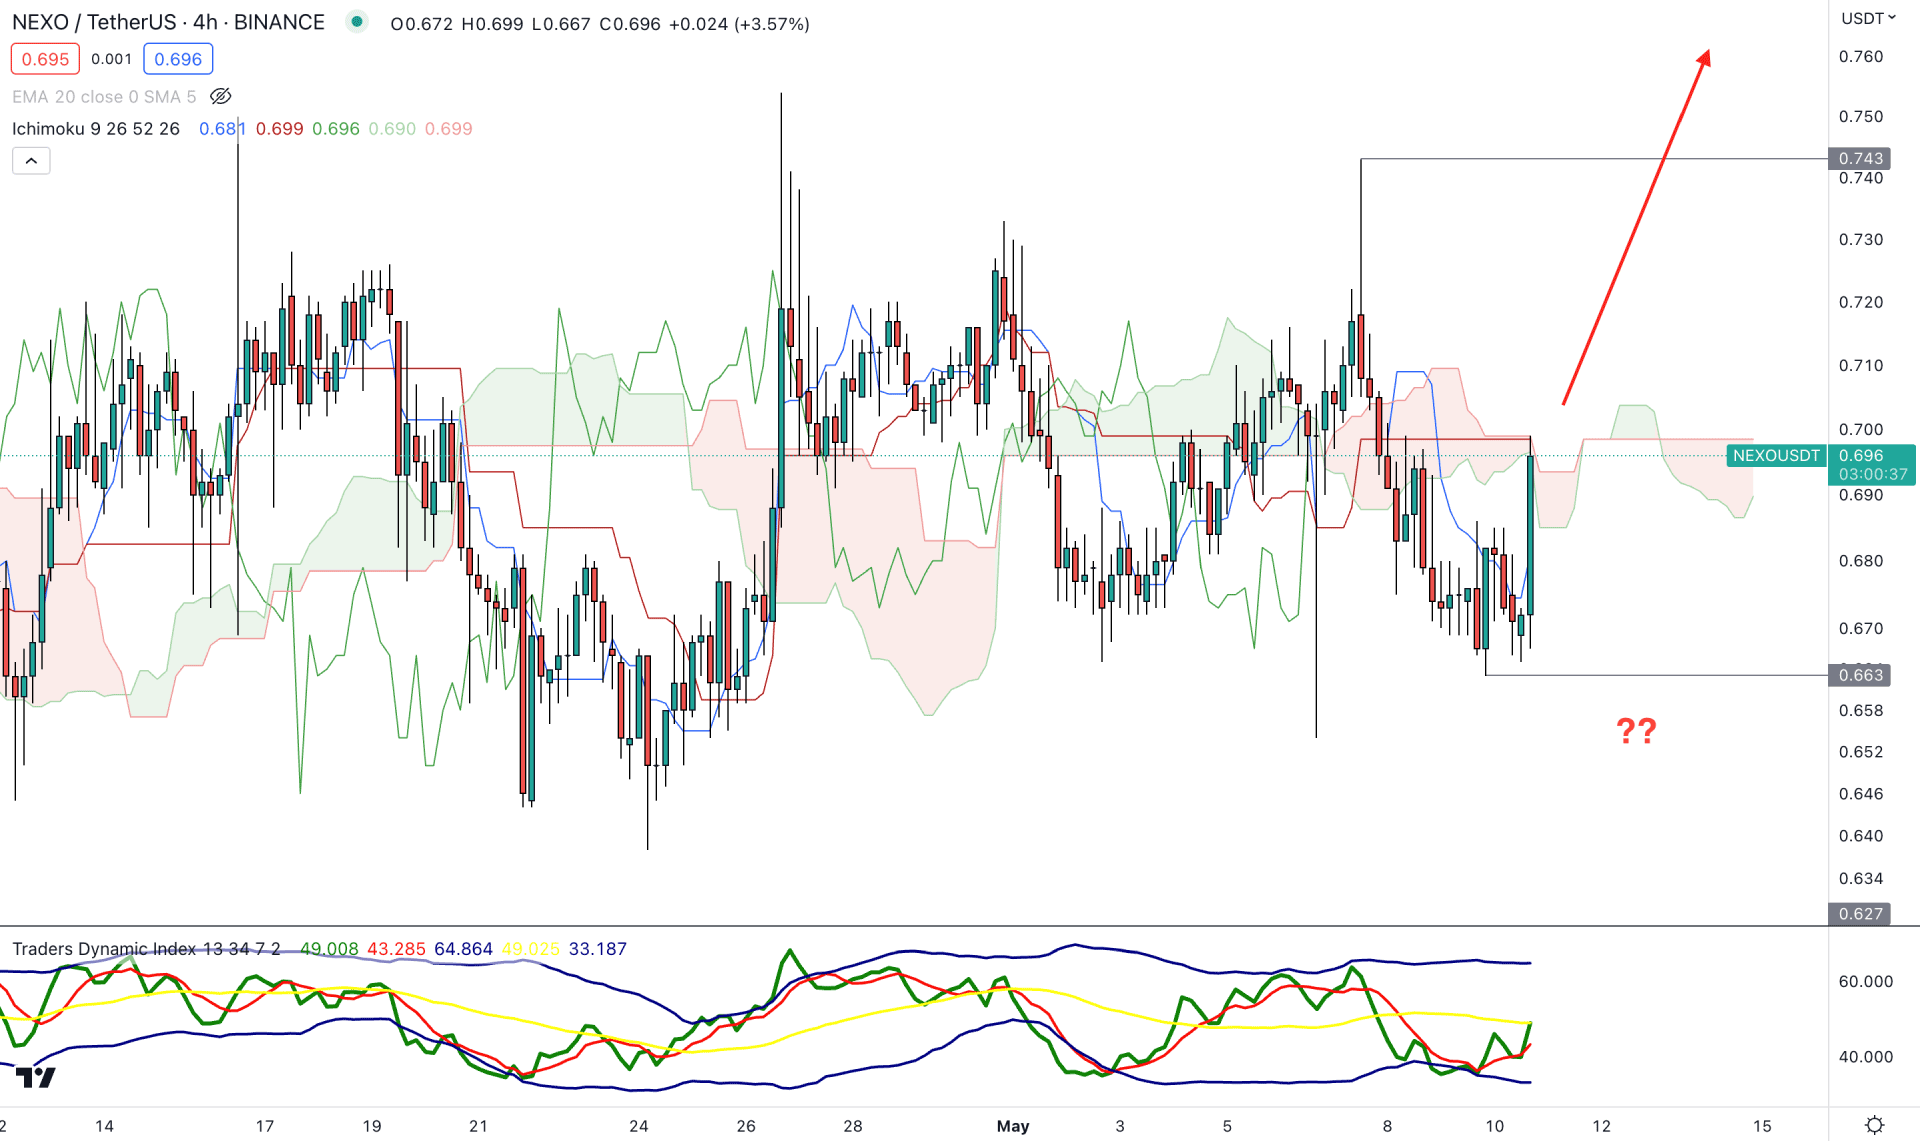
In the H4 timeframe, the current market structure is extremely correct, where it is difficult to define a trend until a breakout occurs. In the internal structure, the swing low of 0.660 could be a significant level to watch from where a strong bullish H4 candle forms.
In the future cloud, the Senkou Span A is still below the Senkou Span B, which is a sign of a selling pressure in the market. The indicator window shows the same story, where the current Traders Dynamic Index (TDI) level shows a rebound from the 40.00 line.
Based on the current H4 outlook, a valid bullish breakout from the Ichimoku Cloud zone is mandatory before aiming for the 1.00 psychological level. However, an immediate recovery with an H4 candle below the dynamic Kijun Sen level might extend the downside correction towards the 0.600 support level.

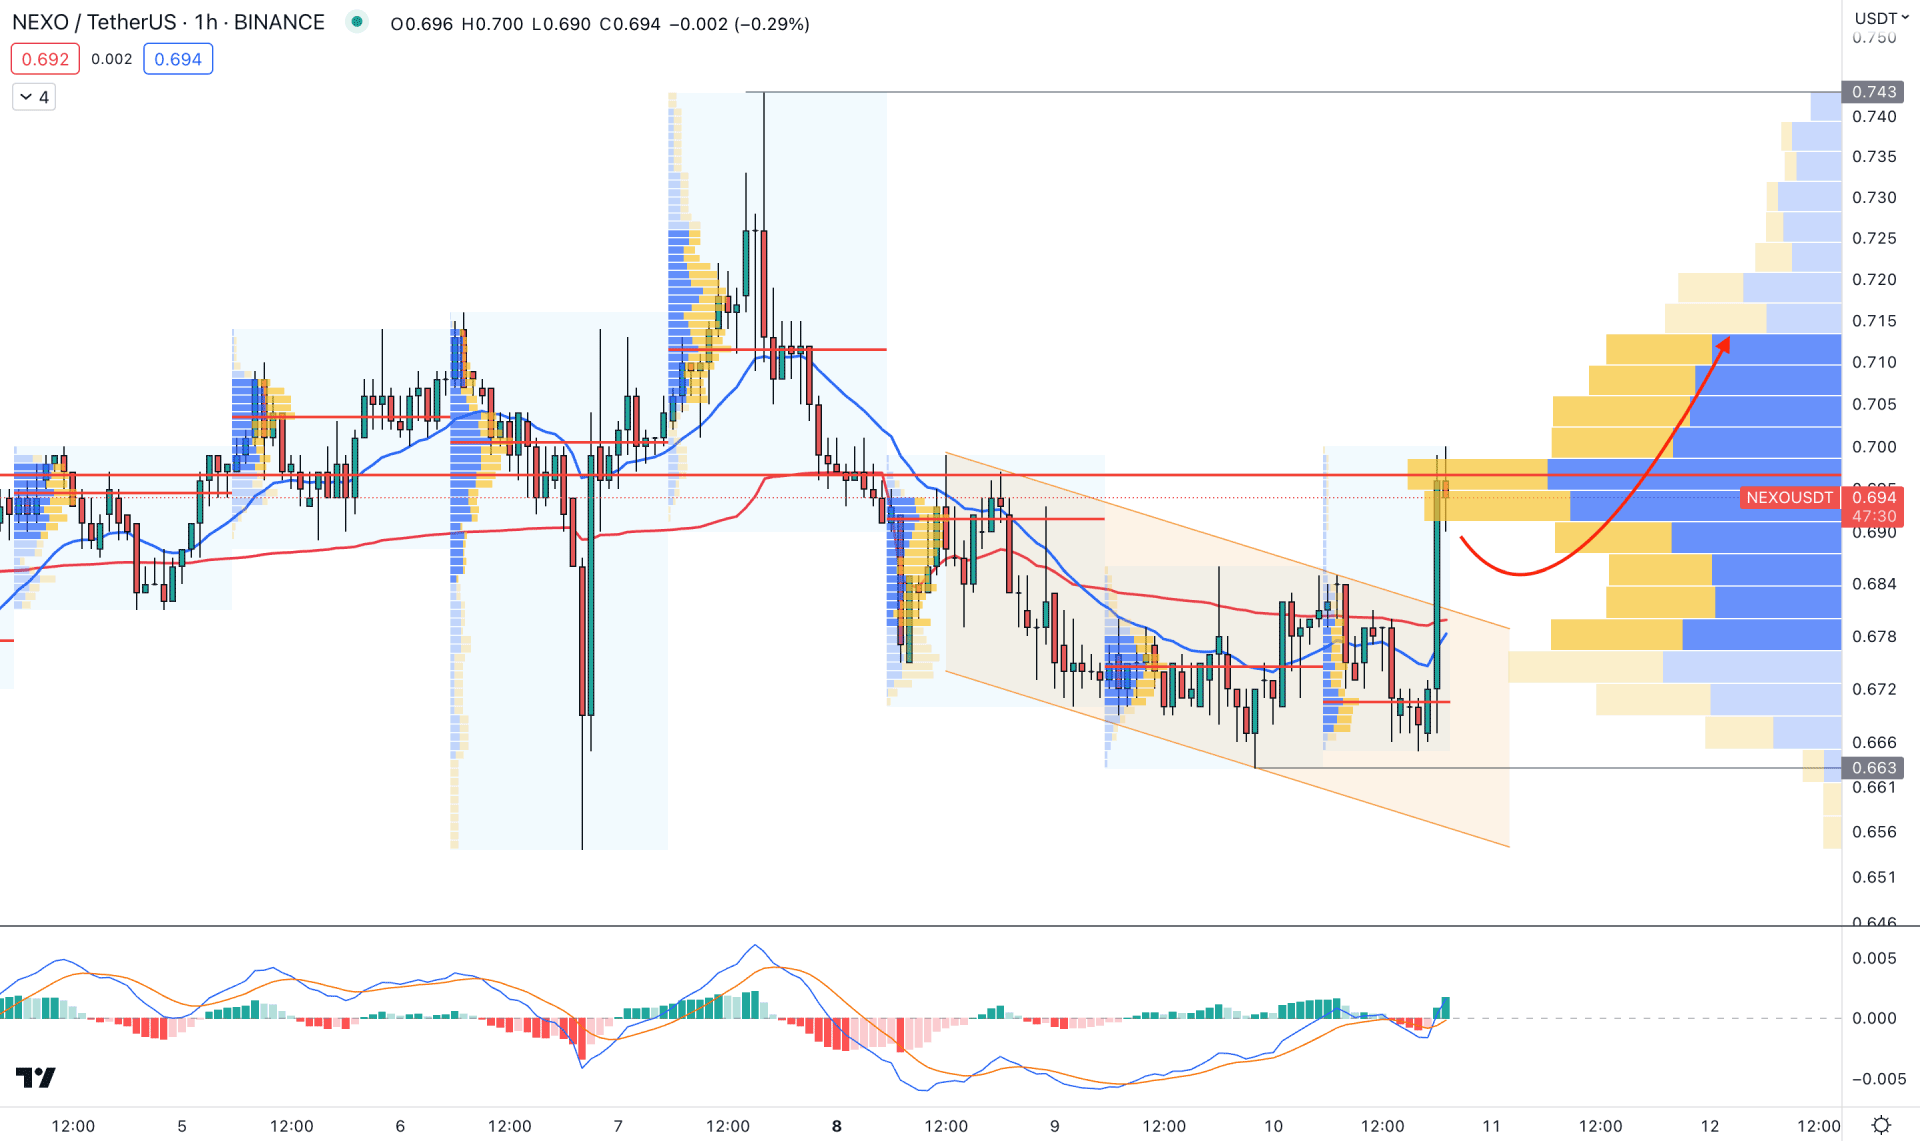
In the hourly chart, the current market structure is bullish, as the recent H1 candle shows a strong buying pressure from the descending channel breakout. However, the latest visible high volume level is above the current price, which needs to be violated before forming a stable trend.
In the main chart, the dynamic 20 Exponential Moving Average moved below the current price, with the weekly VWAP. Moreover, the MACD Histogram turned bullish by moving above the neutral line, with a bullish crossover on MACD EMA’s.
Based on the H1 structure, a new H1 candle above the 0.700 level could extend the buying pressure towards the 0.750 level.
Based on the current market structure, NEXO/USDT bulls need to wait for a valid range breakout before opening a long position. Investors should keep a close eye on the lower timeframe price action to find the most reliable area to buy from.