Published: October 15th, 2024
Netflix, Inc. (NFLX), the first well-known communication services business to release results this season, is expected to release its fiscal results on Thursday after the market closes.
According to an analyst from Deepwater Asset Management, Netflix shares have increased 142% as the Magnificent 7 got the industry standard for tech investments in January 2023, and the company's stock is currently trading close to it's all-time high.
According to him, the Magnificent 7 gained 244% during that time, while the group's gain was a more moderate 140% when Nvidia was not included.
The company's achievement with the password crackdown, which started in May 2023, caused the recovery observed over the last 12 months. According to a tech venture capitalist, this accelerated the company's expansion from 4% in the first three months of 2023 to 17% in the first six months of 2024.
Let's see the upcoming price direction of this stock from the NFLX technical analysis:

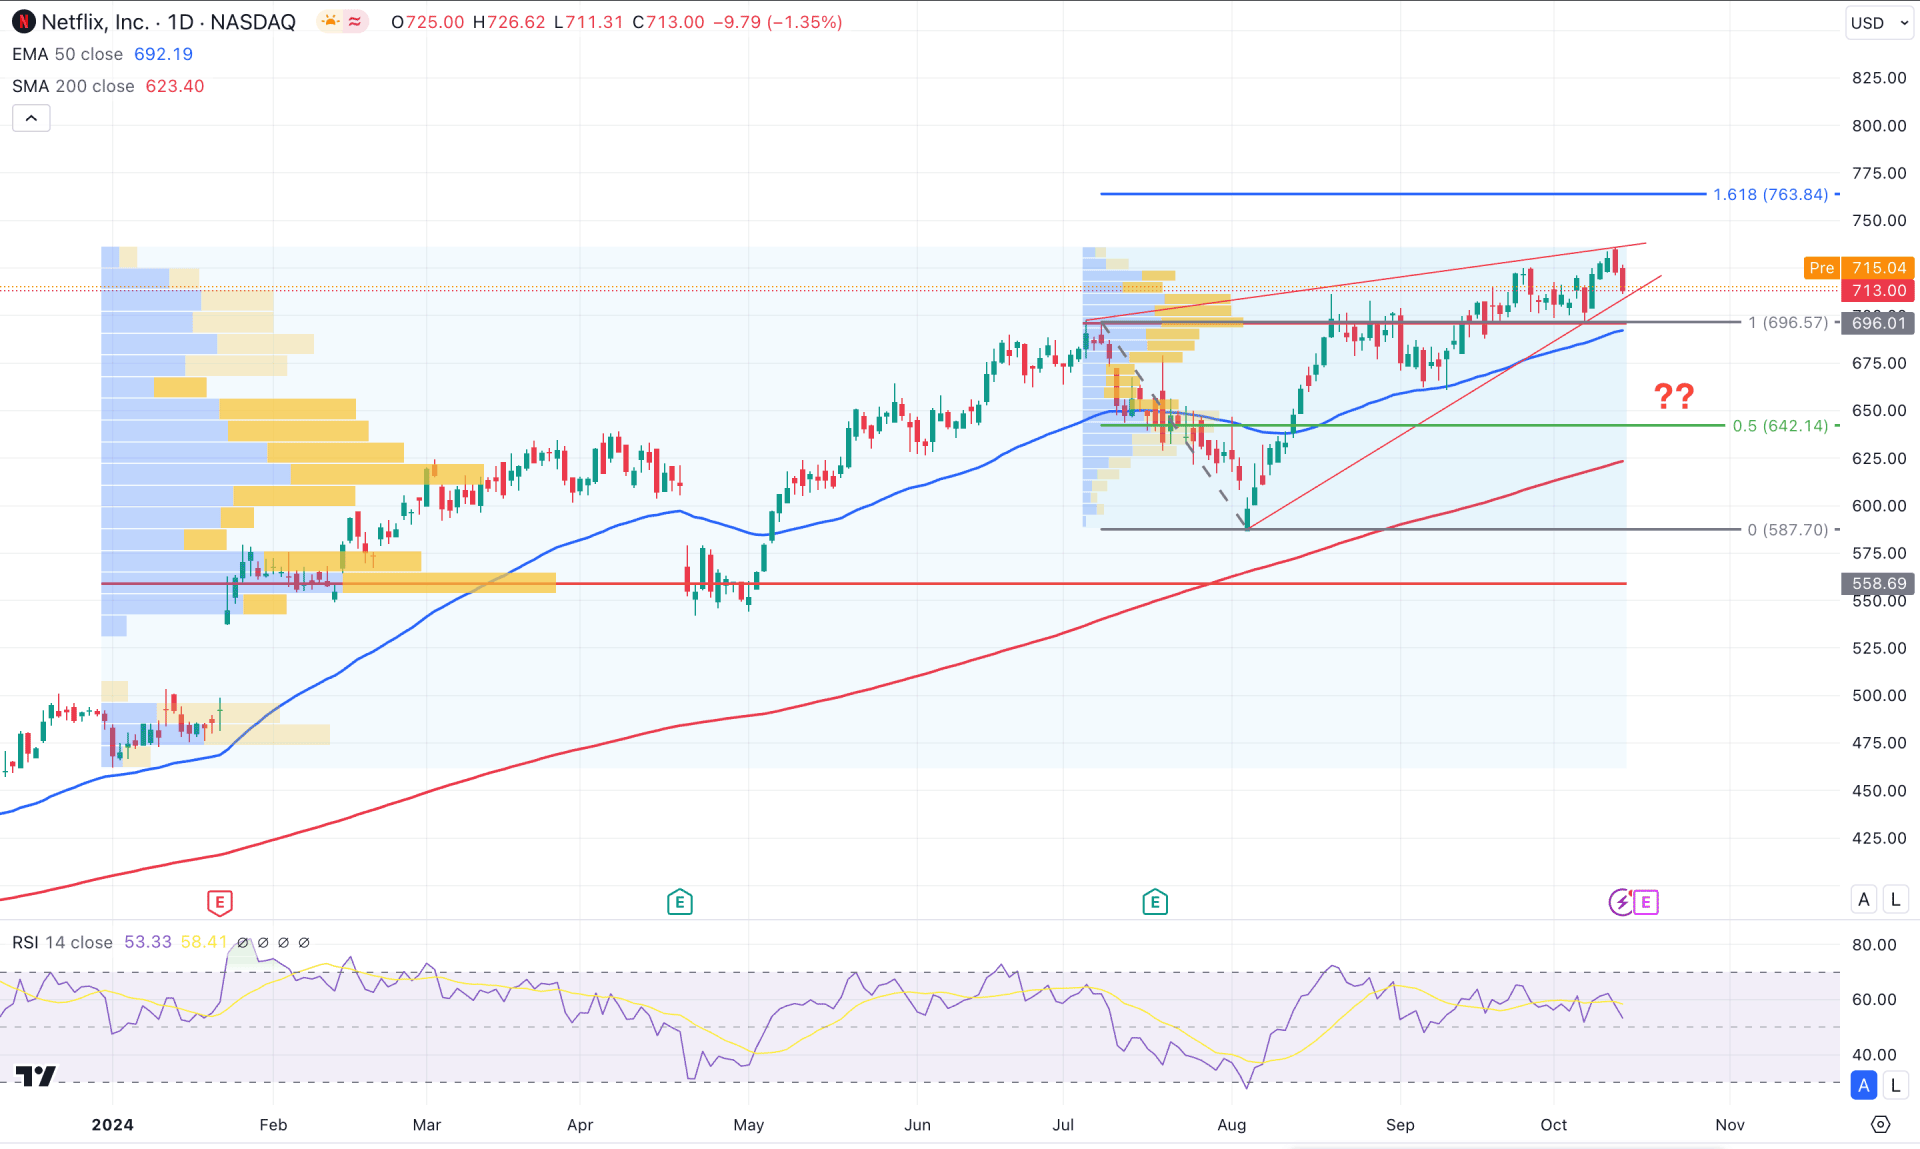
In the daily chart of NFLX, the broader market momentum is bullish as the current price is trading 52% higher than the yearly opening. Primarily, the ideal approach for this pair is to look for long trades only as long as no significant selling pressure comes from the top.
In the higher timeframe, the ongoing bullish continuation is seen from the engulfing pattern formation at the close of August 2024. However, the price failed to show sufficient buying pressure, as September has provided only 1.11% gains. In this context, investors should monitor how the sideways market is performing at an all-time high to gauge the future price.
In the volume structure, the buying pressure is visible, with the largest activity level since July 2024 at the 696.01 level. However, another high volume level since January 2024 is at the 558.69 level, which is below the major static support of 587.01. In this context, we may consider the buying pressure overextended in the long term, while short-term traders are still holding it for more gains.
The main price chart shows steady buying pressure from the 200-day SMA, while the 50-day Exponential Moving Average provides immediate support. However, the buying pressure above the July 2024 high signals a threat to bulls as the sideways momentum indicates a rising wedge pattern formation. In this context, a valid downside pressure from the wedge breakout could signal a potential downside pressure in the coming days.
Despite the ongoing buying pressure, the Relative Strength Index (RSI) shows a different story. Instead of moving beyond the 70.00 overbought zone, the current line hovers at the 50.00 area, suggesting a divergence.
Based on the daily market outlook of NFLX, investors should monitor how the price trades above the 50 day EMA line. A selling pressure with a daily candle below the 696.01 level could initiate a deeper discount towards the 642.01 support level.
On the other hand, a bullish continuation is potential, which might extend the buying pressure at the 763.84 Fibonacci Extension level, which might extend above the 800.00 psychological line.

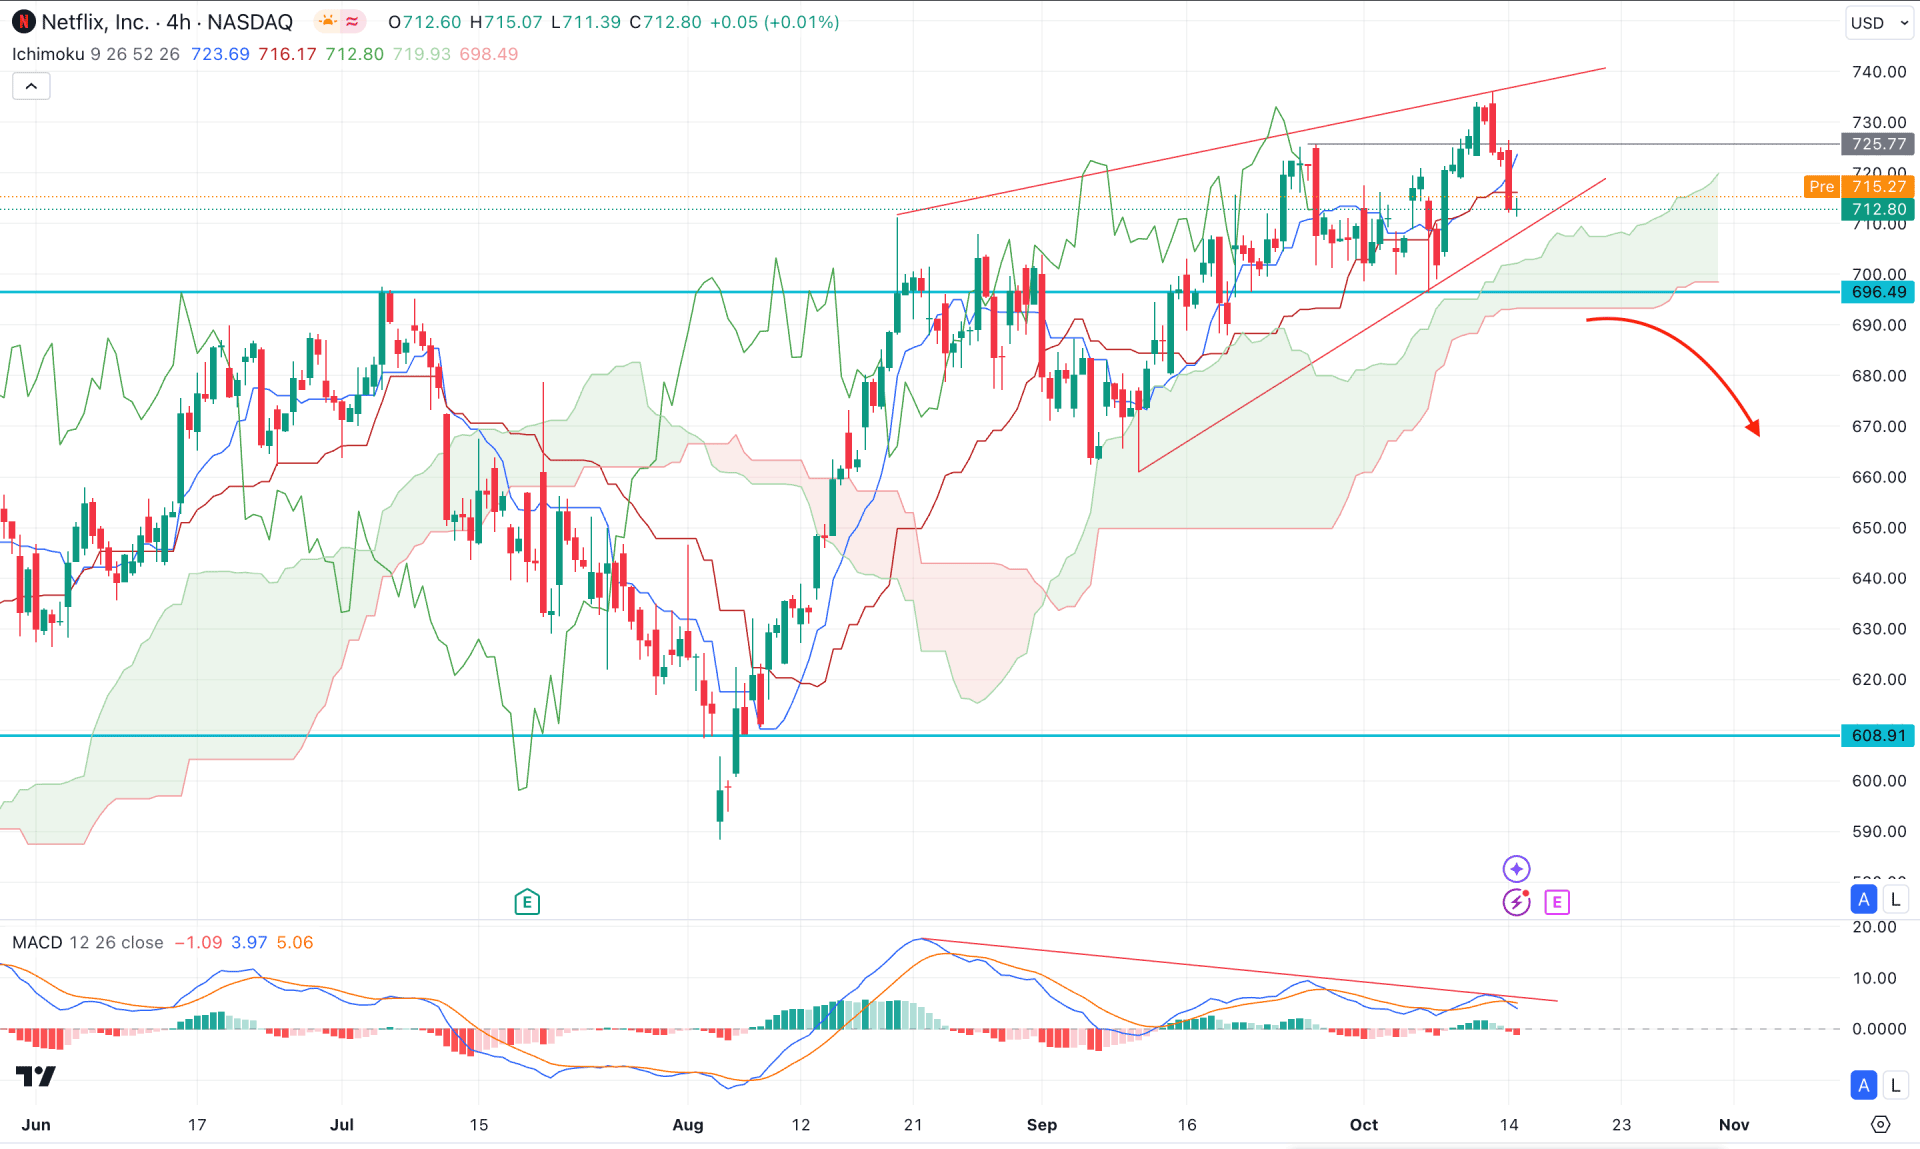
In the H4 timeframe, the recent price showed a bullish V-shape recovery, taking the price above the July 2024 high. However, the most recent price has become sideways, which signals a possible downward correction.
In the indicator window, the MACD Histogram remained sideways, while signal lines made a divergence from the main price chart. It is a primary sign of a potential trend reversal, which needs more clues from the upcoming price action.
Based on this outlook, the buying possibility is potent as long as the Ichimoku Kumo Cloud is protected. Any bullish reversal from the Rising Wedge support could extend the upward pressure above the 735.60 high.
However, an immediate selling pressure with a daily close below the 696.36 static support could be a challenging factor to bulls. In that case, the downside pressure might appear, taking the price below the 650.00 area.

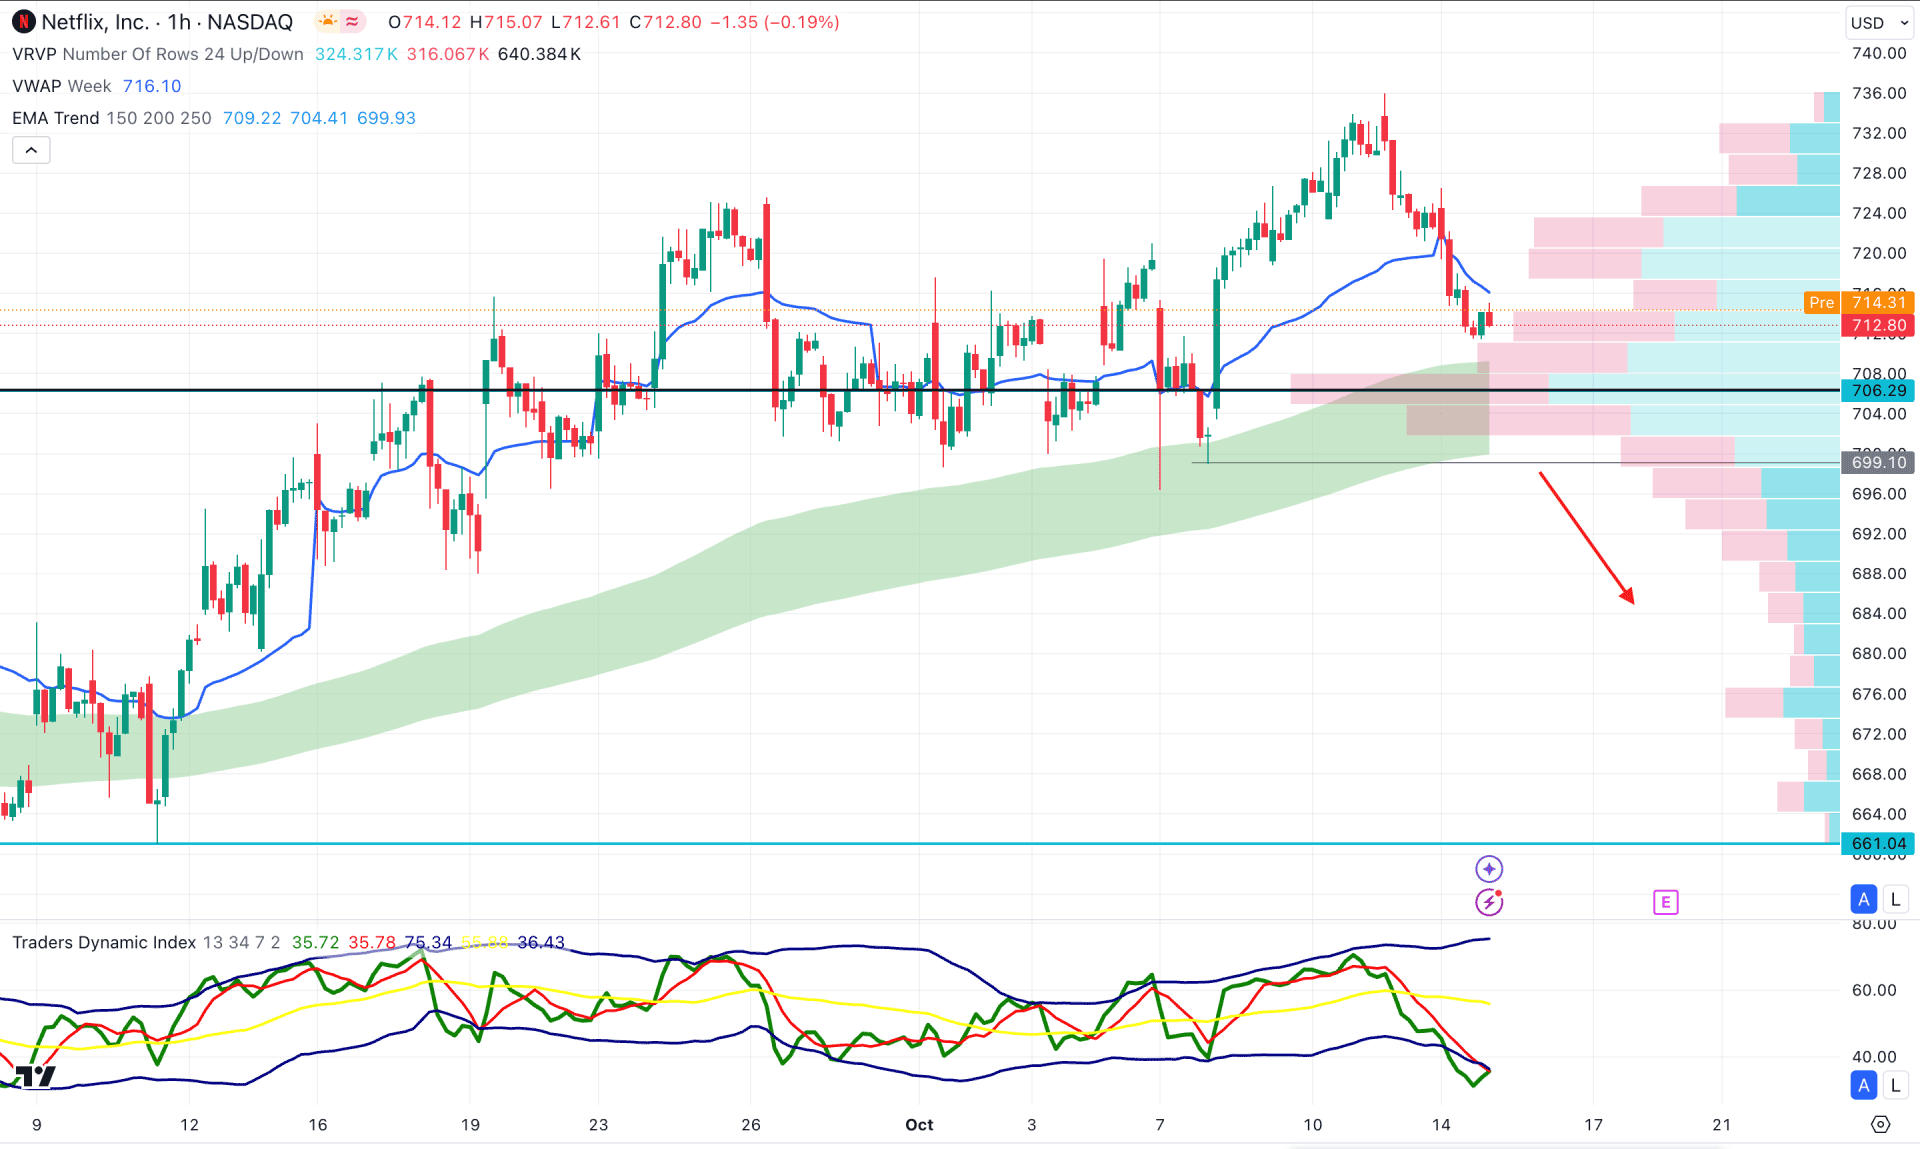
In the hourly chart of NFLX, a bullish liquidity sweep is present as the recent price showed an immediate reversal from the 723.80 high.
As a result, multiple hourly candles have formed below the weekly VWAP line, while the high volume level of 706.29 is the immediate support.
Based on this outlook, the oversold momentum from the Traders Dynamic Index, with the support from the EMA wave could signal a potential demand zone. A valid rebound from the wave zone is possible, while a stable consolidation below the high volume line could be a bearish opportunity.
As per the current market outlook, NFLX is more likely to form a downward pressure once the rising wedge is validated. The upcoming earnings report could be a crucial event where a downbeat earnings report could boost the selling pressure.