Published: September 28th, 2021
In the June quarter, the number of Netflix streaming subscribers increased by 1.54 million, beatings the Wall Street expectation of 1.15 million. However, Netflix stock moved down by 3.3% after releasing the news in July.
However, the situation has changed now as Q3 earnings are yet to release in October, and before that, Netflix stock is priced in. So now investors should focus on how the Q3 earnings come. In Q3, Netflix forecasted an increase of 3.5 new subscribers, blaming the post-Covid slowdown in users addition. Any better result would be a massive price driver for NFLX stock.
In the financial releases, Netflix reported $2.97 per share on sales of $7.34 in Q2. However, the analyst’s expectation was an earning of $3.18 a share from $7.32 sales. Although the company failed to beat the analyst’s expectation, the year-over-year earnings increased by 87%, with a surge in sales by 19%. The current projection for Q3 is to earn $2.55 a share against the sales of $7.48 billion. Before the earnings release, Netflix stock was growing higher by eliminating the Q2 loss. In that case, the bullish pressure may extend if the Q3 result shows a comeback.
Let’s see the upcoming price direction from the Netflix Stock [NFLX] technical analysis:

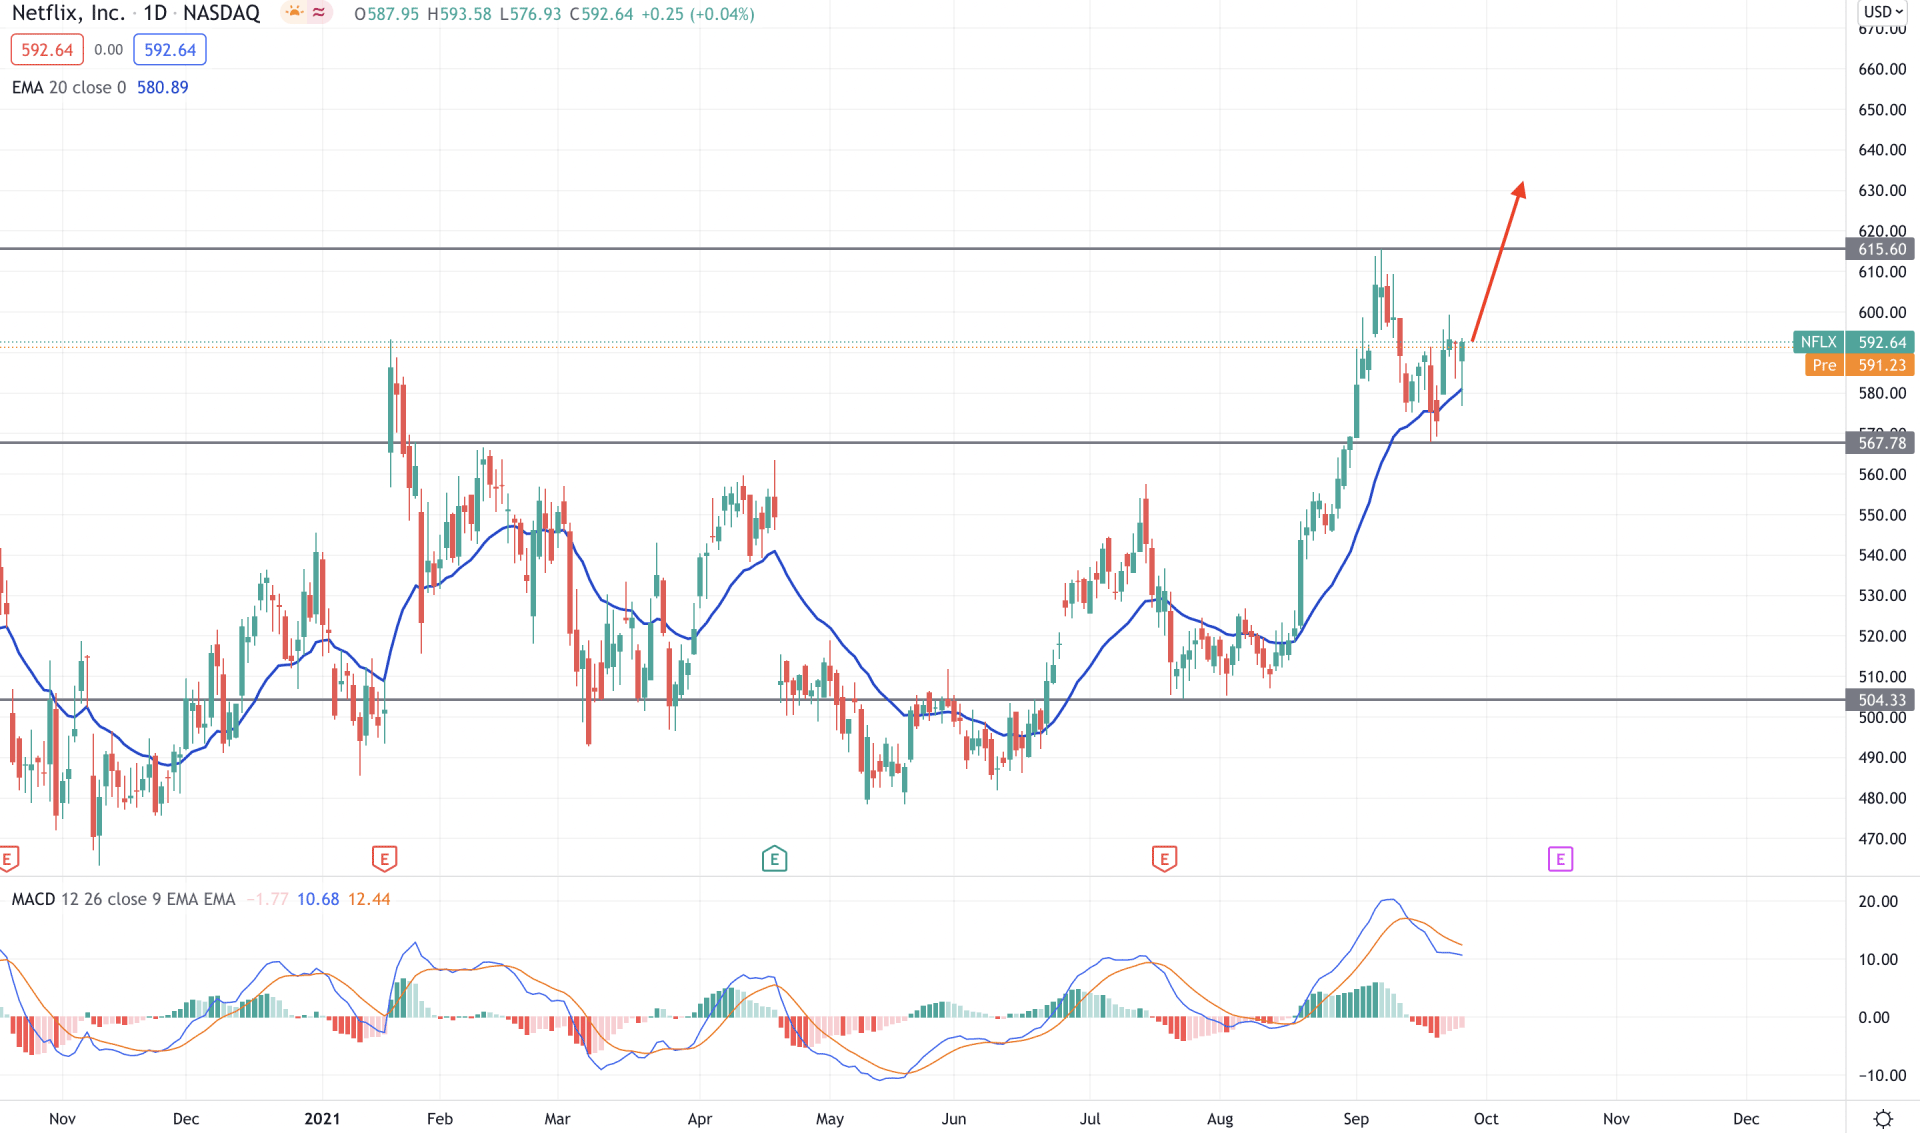
Netflix stock missed the Q2 earnings report that pushed the price from 549.64 to 478.88 but recovered successfully. Moreover, the price showed impressive bullish stability above the 504.33 event level and tested the new multi-year high at the 615.60 level.
The above image shows how the price is trading above the 567.78 event level with bullish rejection. Moreover, the price moved above the dynamic 20 EMA with a daily close, increasing the buying possibility for the coming days. Meanwhile, MACD Histogram is still bearish but making higher lows, pointing out that bearish momentum decreases.
In the daily context, the price is more likely to extend the bullish pressure until the daily candle is below the 567.78 event level with a bearish close. The buying possibility may move above the 615.60 level, making a new all-time high. Conversely, a bearish daily close below the 567.78 level may lower the price towards the 470.00 level.

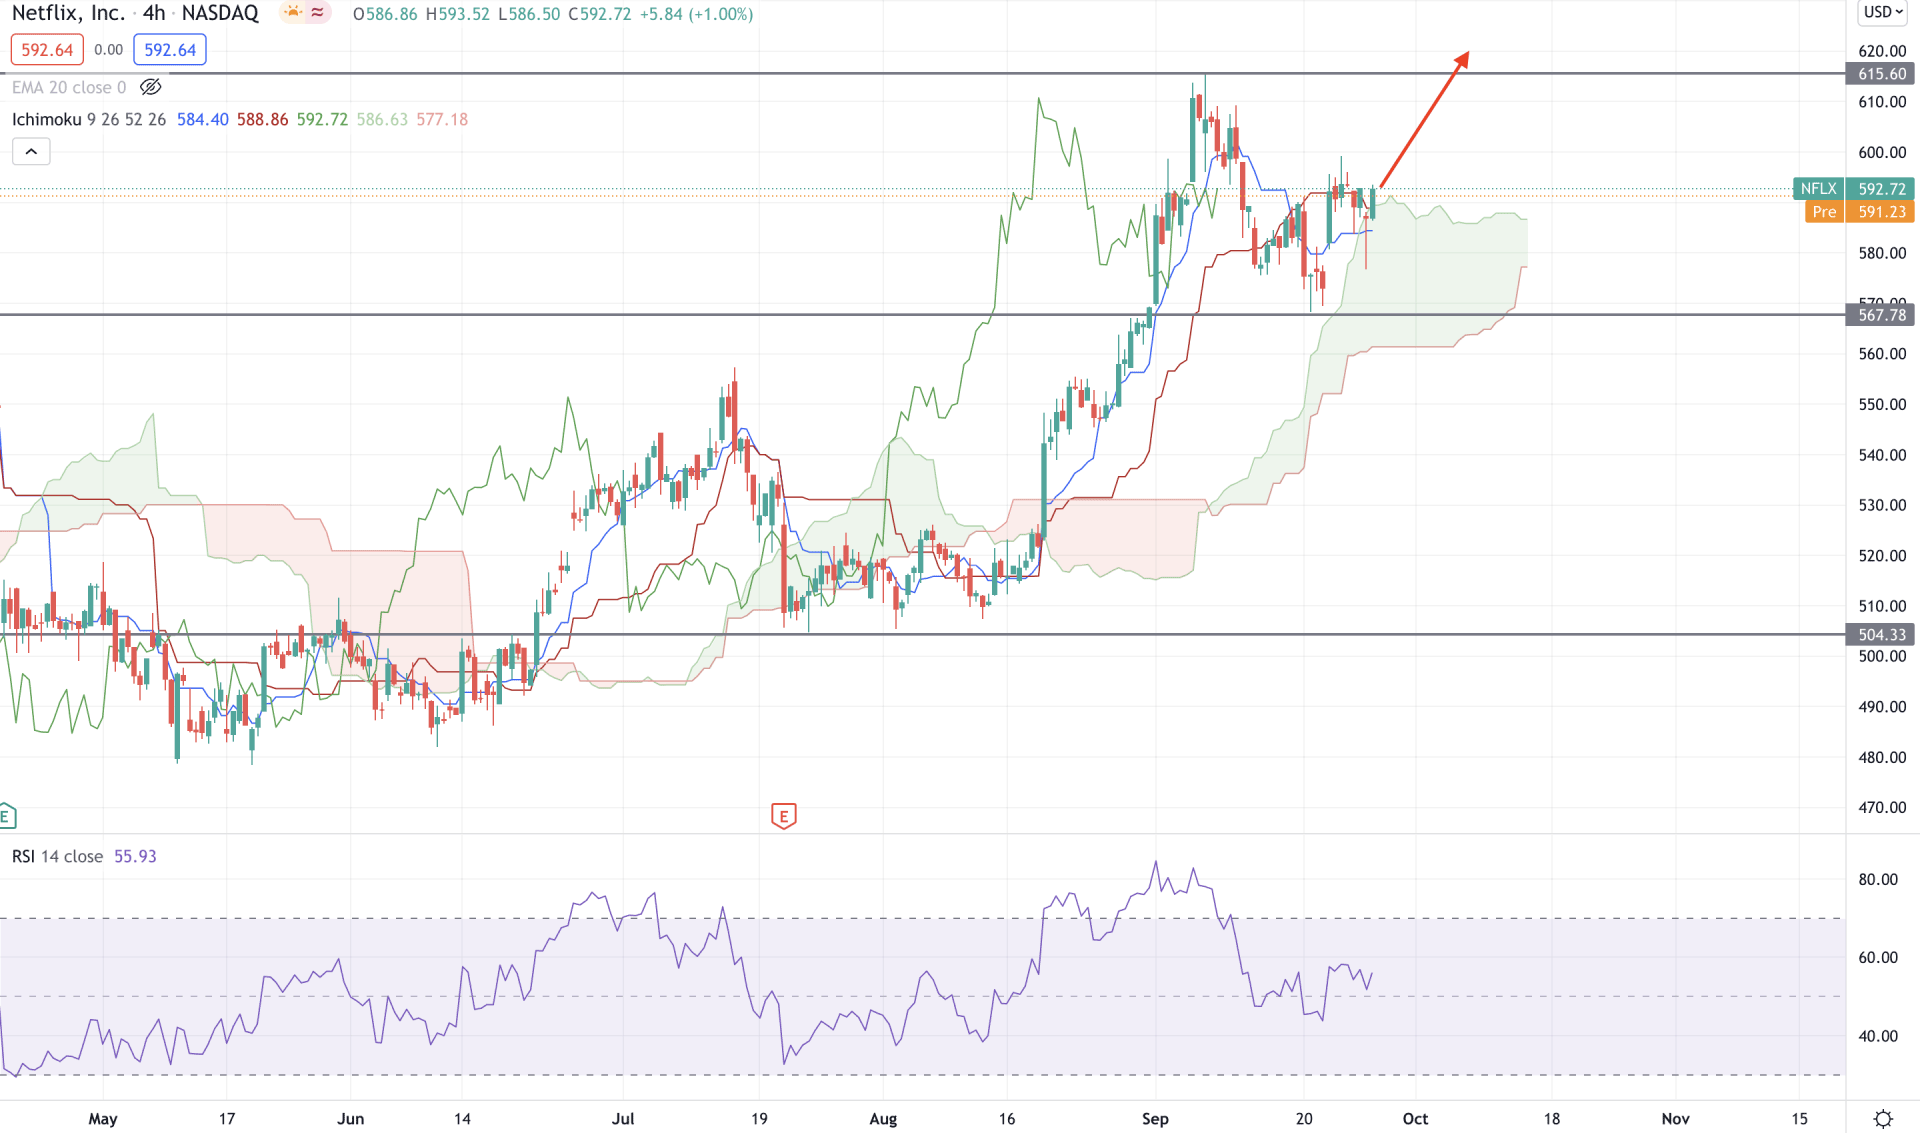
According to the Ichimoku Kinko Hyo, the price is moving with extreme bullish pressure as the bullish breakout above the Kumo Cloud on 16 August was impressive. As a result, the price moved higher and made a new all-time high at the 615.60 level. The Kumo Cloud is bullish where Senkou Span A and Senkou Span B are aiming higher while the Chikou Span is growing.
In the indicator window, RSI showed a recovery from the 50% level and currently aiming higher. However, as the RSI is at the 60 levels, it is more likely to move up towards the overbought level, increasing the buying possibility in the price.
Based on the price context, in the H4 chart, we can say that the price may grow higher from the current cloud support that may extend above the 615.60 level. On the other hand, bears should find the price below the 560.00 cloud support before relying on further bearish pressure.

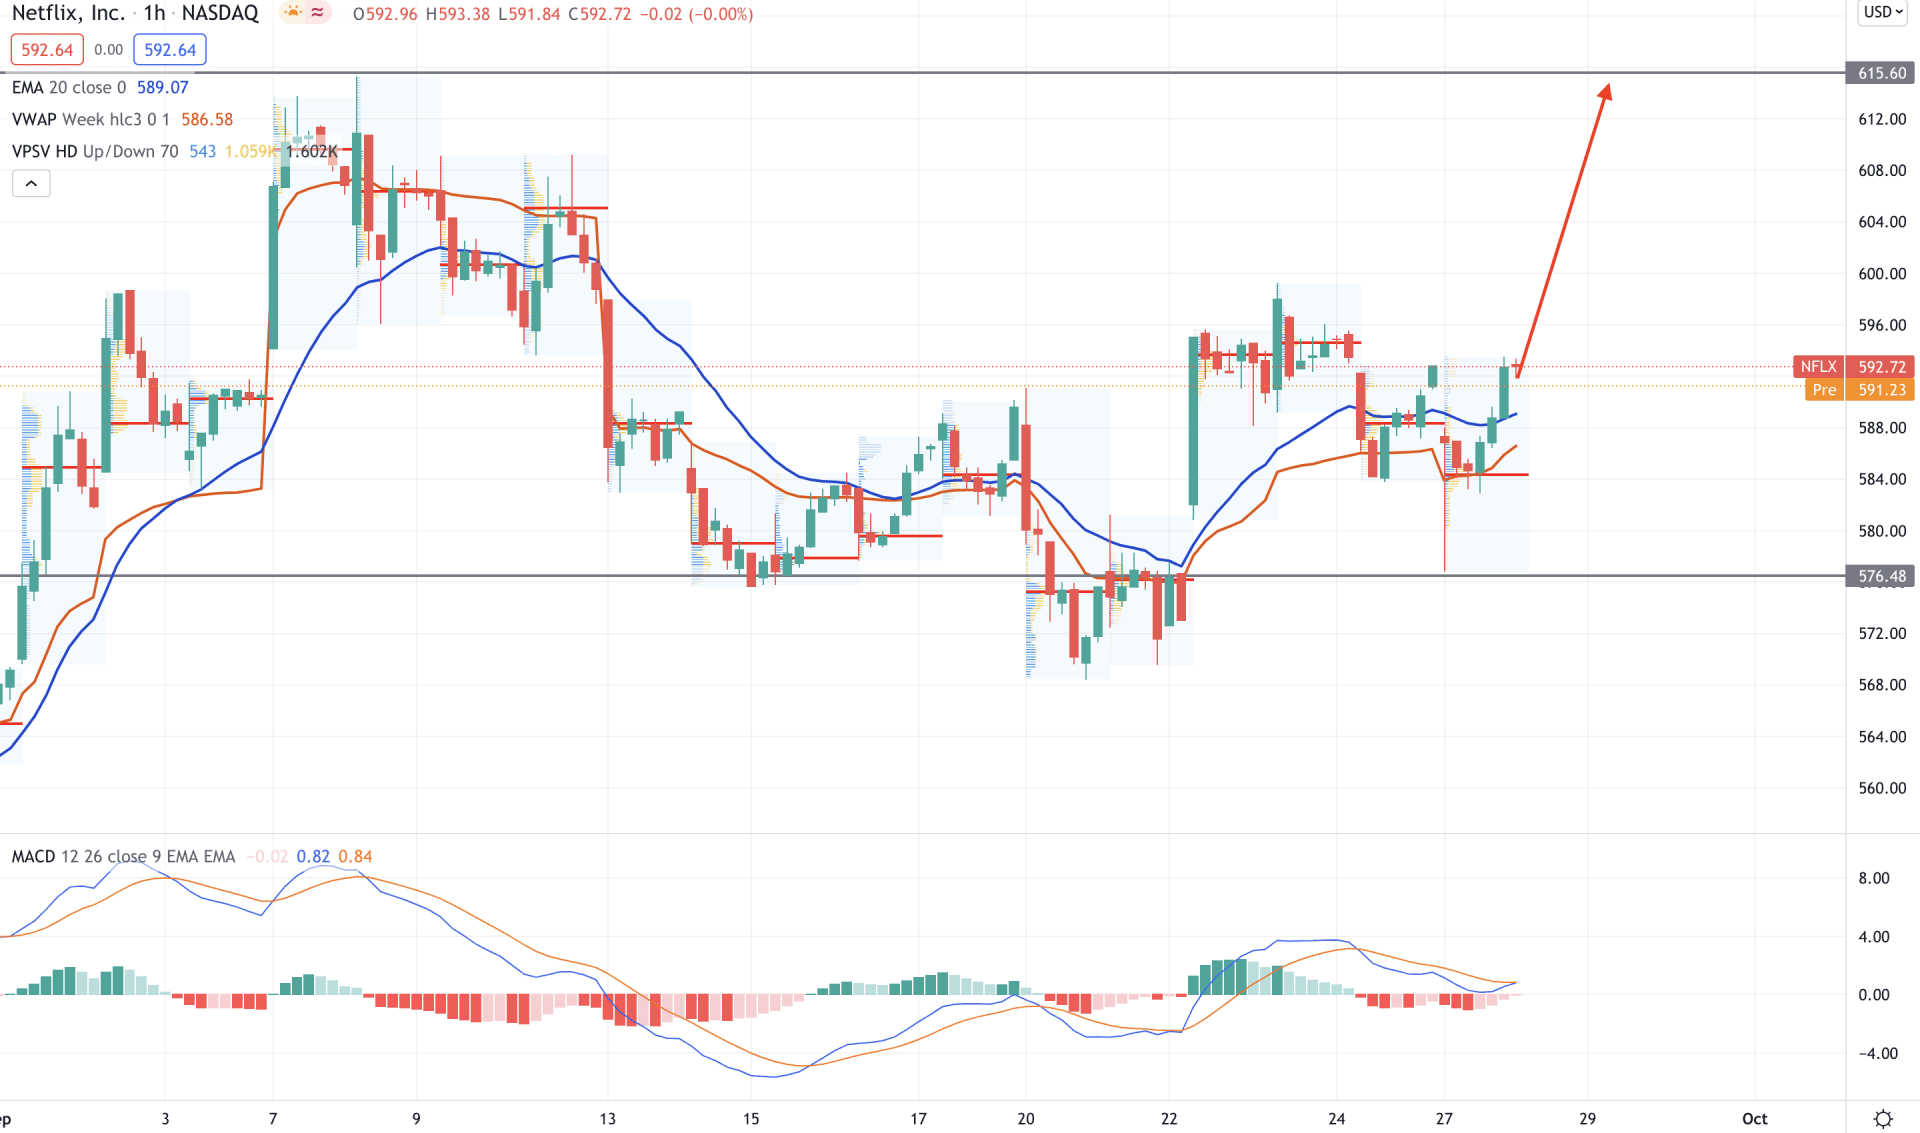
Netflix stock has shown a bullish recovery in the intraday chart as the price rejected the 576.48 intraday event level and moved above the dynamic 20 EMA. Therefore, as long as the price is trading above the 576.48 level, it may grow higher in the coming session. Moreover, the price moved above the intraday high volume level of 584.00, pointing out more bullishness.
The above image shows how the price is trading above the dynamic 20 EMA and weekly vwap with a bullish H1 close. Moreover, MACD Histogram moved to the zero level with an upcoming bullish possibility in the indicator window. Therefore, based on the H1 context, the price is more likely to move up and testing the 615.60 level. On the other hand, a bearish H1 close below the 578.48 level may invalidate the current sentiment and start a broader correction to the price.
As of the above discussion, we can say that the Netflix Stock [NFLX] has a higher possibility of moving up until the Q3 earnings report come. In that case, the price may break above the all-time high level of 615.60 level. Conversely, a break below the 560.00 level or bearish rejection from the 615.60 level may provide hints of upcoming selling pressure.