Published: October 25th, 2022
Netflix stock (NFLX) has seen an excellent rally after Q3 expectations beating with $3.10 per share earnings by 46%. Sales reached $7.9 billion, 6% up from the prior year beating revenue expectations barely. Netflix posted subscriber growth outside of beating both the bottom and top sides.
During Q3, Netflix added 2.41 million subscribers. The figure is more than double the expected 1.09 million subscribers and was a pleasure to investors. Netflix’s Asia-Pacific region added 1.43 million subscribers, accounting for the growing majority.
Wall Street saw the subscribers growth significantly as the company had shrinking subscriber growth for two consecutive quarters. Despite beating earnings expectations earlier in the year, this caused NFLX stock to decline forcefully. The company’s first decline in paying customers was losing 200k subscribers in Q1, followed by almost another 1 million subscribers losing in Q2.
In Q4, the final forecast of Netflix predicted to add 4.5 million subscribers. The company said its main focus would be revenue growth and priority moving forward rather than subscribers' data and guidance.
Let’s see the future price direction for Netflix stock from NFLX technical analysis:
Netflix stock (NFLX) shot higher, gaining 17% from the Q3 earnings sentiment, where several bullish indications about the stock came. Moreover, the upbeat data came after several weaker quarters, indicating an opportunity to join the bullish rally from the beginning. However, it is important to know what is happening in the broader market context, as the current buying pressure might be a correction from the long-term bearish rally.
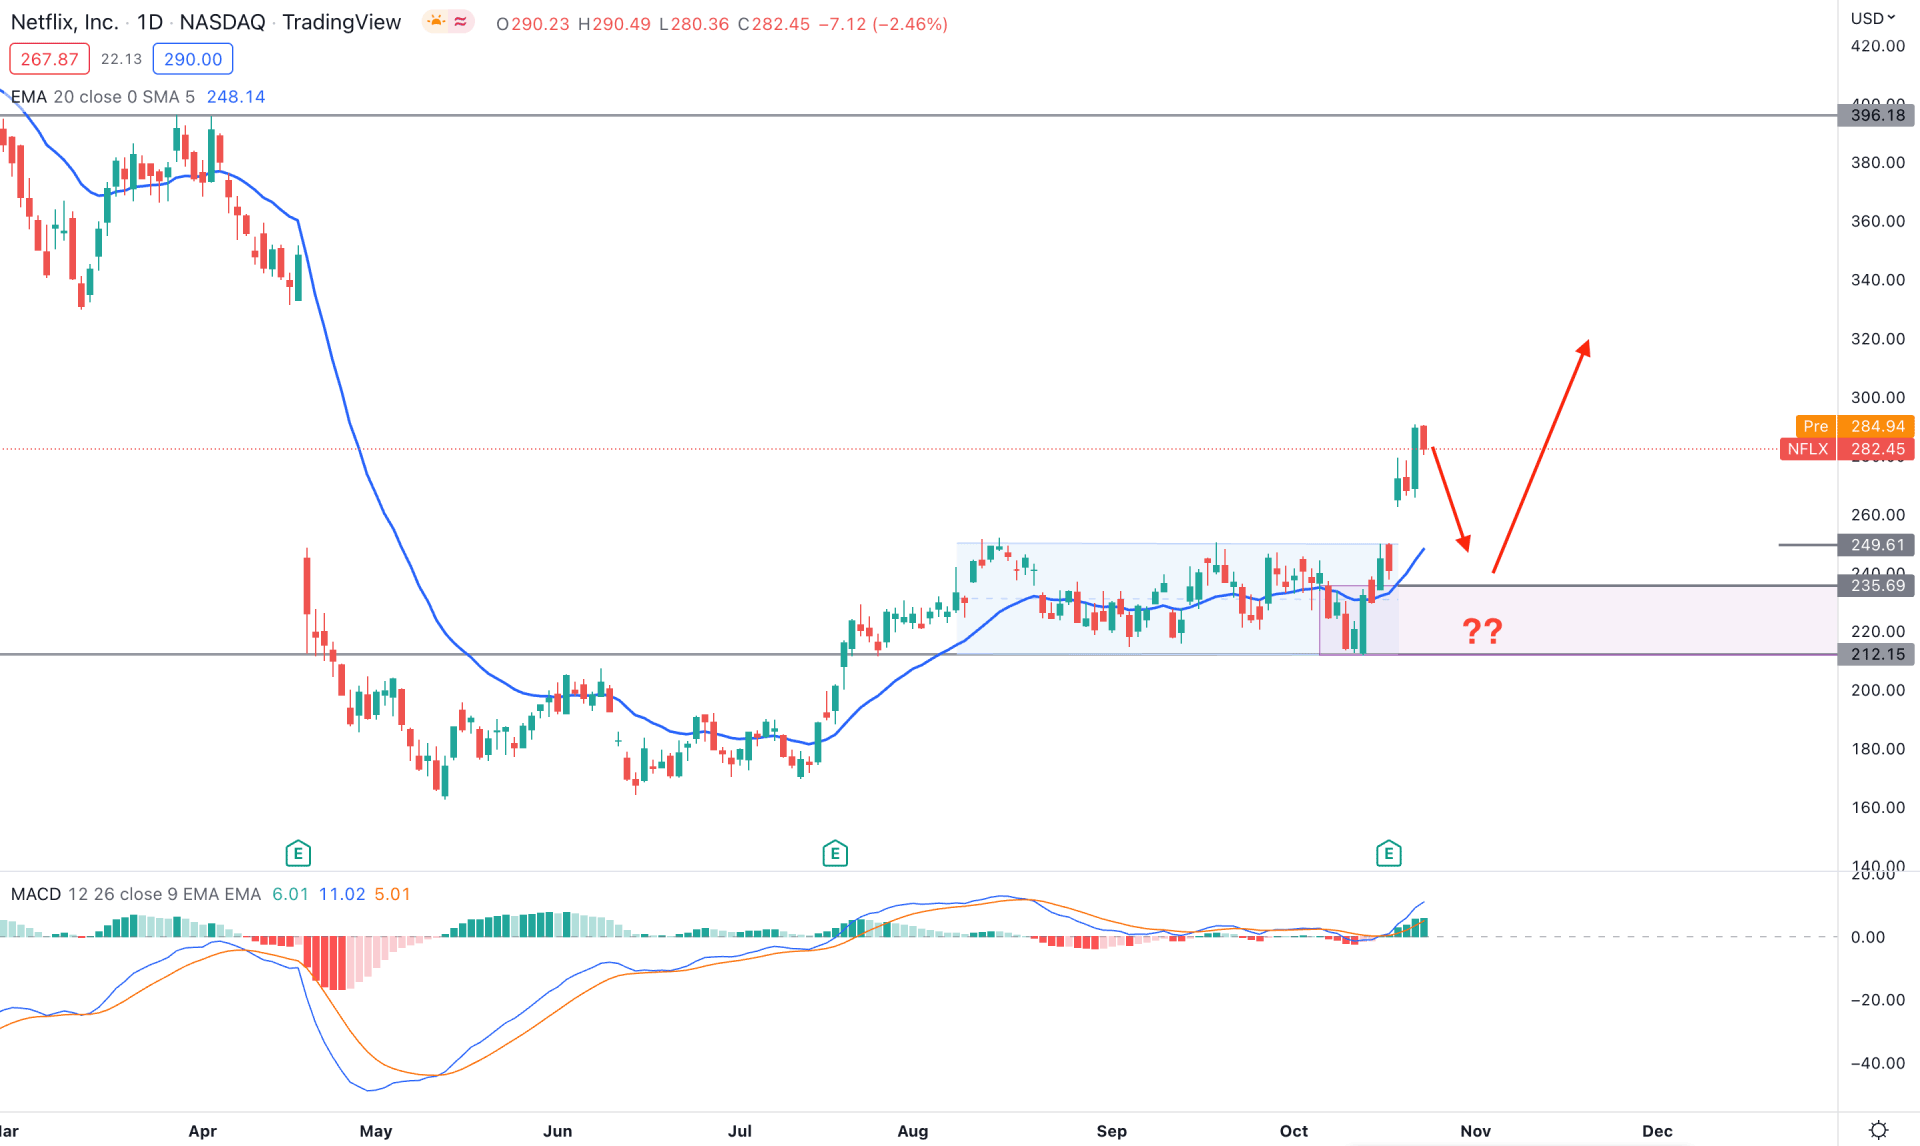
After the massive downside movement in April, the price became extremely corrective from May to July. During that time, the price barely made new lows and passed volatile trading days, which was the first indication of a bullish trend reversal.
Later on, the rectangle pattern formation above the 212.15 support level and making a new swing high of 289.09 level increased the possibility of a bull run in this instrument. Following the bullish rectangle pattern formation, investors should monitor how the price comes at the demand zone before showing buying pressure.
The dynamic 20-day Exponential Moving Average is below the price and indicates a minor bearish correction as a mean reversion. In the indicator window, the MACD Histogram is strong above the neutral line, where MACD lines are above it with a bullish indication.
Based on the daily structure, any bullish rejection from the 249.00 to 212.00 area could offer a bullish opportunity, targeting the 396.18 level as a primary target point. Moreover, breaking below the 200.00 mark would eliminate the bullish structure and lower the price in the coming days.
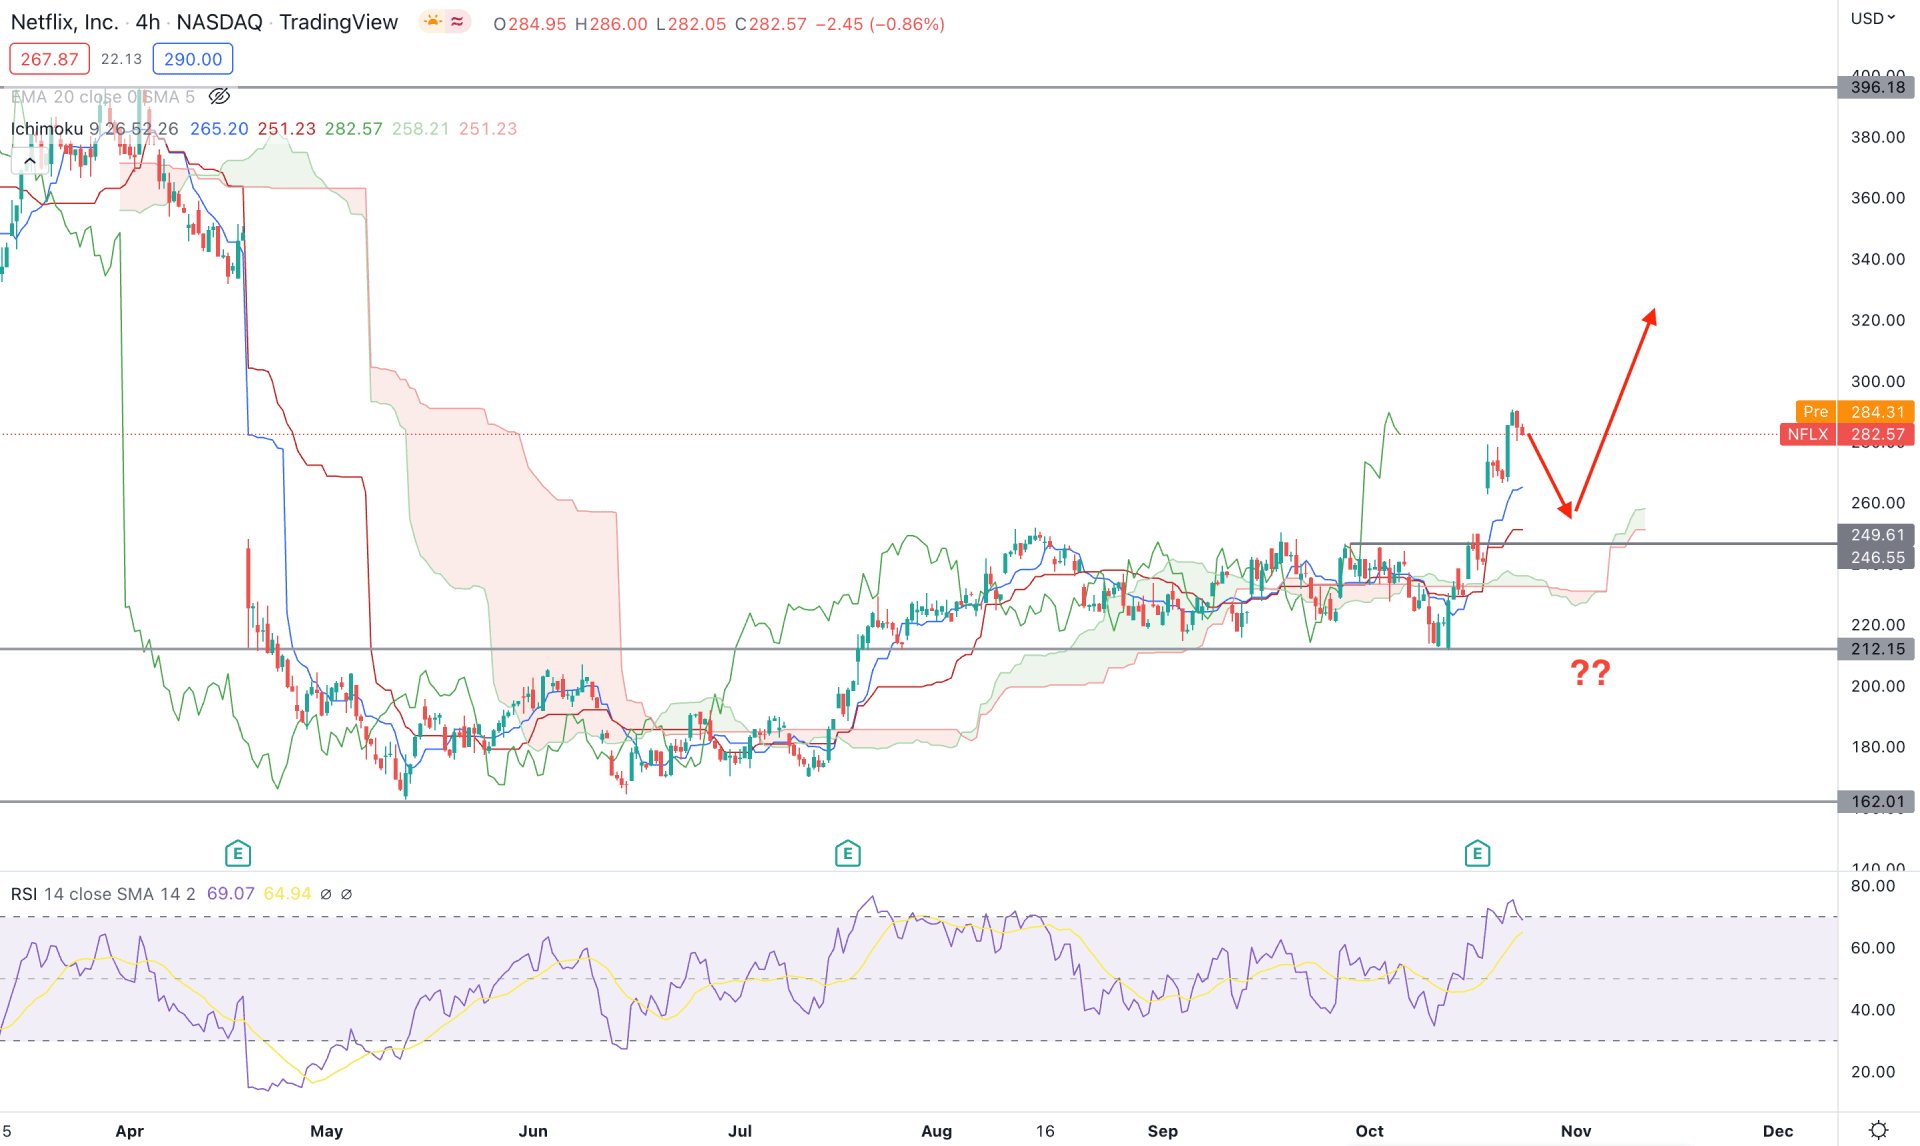
The buying pressure is clearly visible from the NFLX H4 chart, as the current price is trading above the Kumo Cloud after a long consolidation. Moreover, the price formed a bullish range breakout above the cloud area, which could provide confluence support to bulls.
The future cloud of the Ichimoku component shows a buying possibility as the Senkou Span A is above the Senkou Span B. Moreover, the current Lagging Span’s position is above the swing high of that area, which is a sign of buyers’ presence in the market.
The indicator window shows an extremely bullish market with pending minor corrections. The dynamic Tenkan Sen and Kijun Sen are also below the price, offering a bearish possibility as a mean reversion.
Based on the H4 structure, any bullish rejection from the dynamic Kijun Sen area could offer a long opportunity towards the 396.00 area. On the other hand, the 212.00 area could work as a significant barrier to bulls, as breaking below this level with a daily close might alter the current structure. In that case, the bearish sentiment could increase towards the 140.00 area.
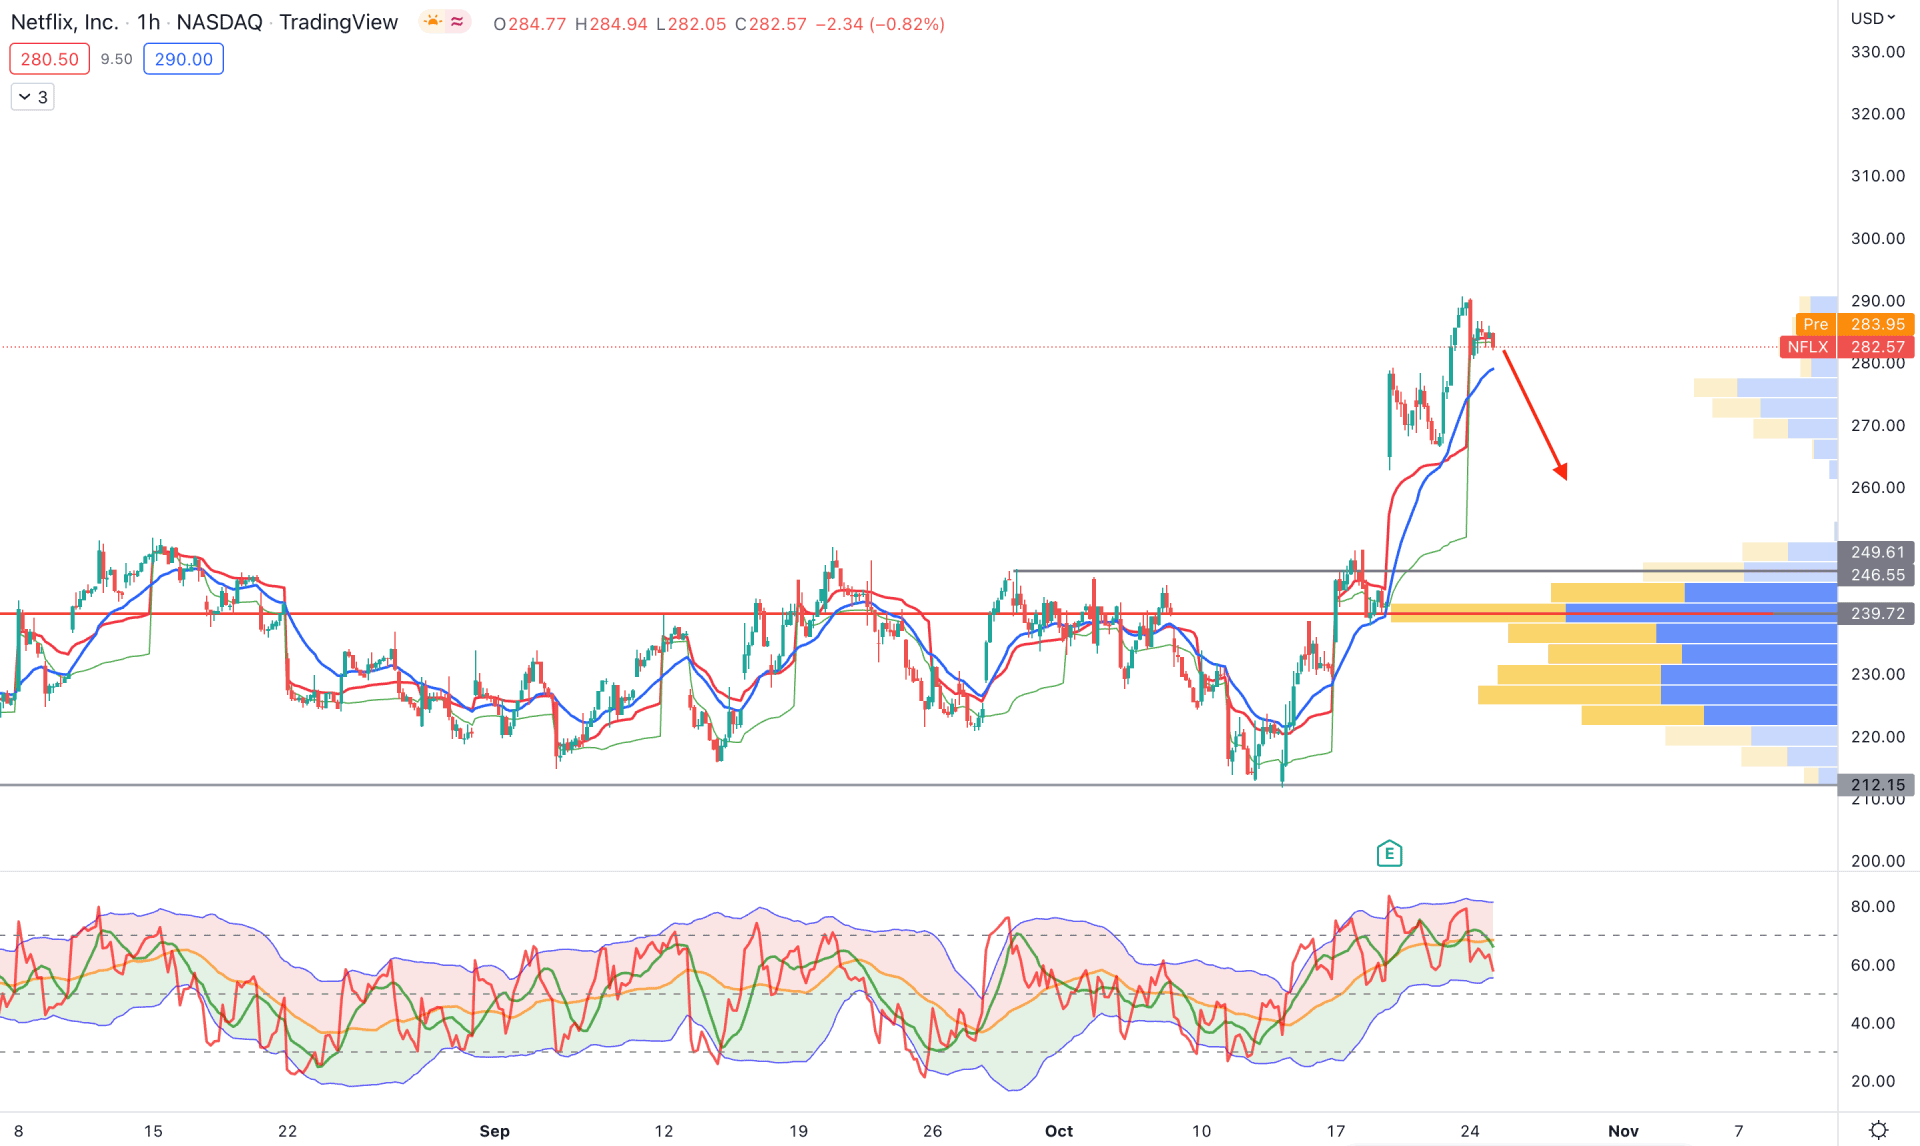
In the hourly chart, Netflix stock is already higher from the breakout point, which is a sign of a minor bearish possibility due to profit-taking.
On the other hand, the bullish momentum is solid as the current price is still above the 239.72 visible range high volume level. Therefore, as long as the price remains above the 239.00 level, the main aim is to look for bullish trade setups.
The 20 Exponential Moving Average and weekly VWAP are close to the price, whereas a bearish H1 candle below these levels could increase the short opportunity. In the indicator window, the TDI level is above the 50% area, signaling a broader bullish outlook.
Based on the current market outlook, the upside possibility in this pair is solid as it is backed by the same momentum in the higher timeframe. However, a minor correction and bullish rejection from 249.61 to 239.72 might offer a bullish opportunity towards the 330.00 area.
Based on the current market structure, NFLX has a higher possibility of showing buying pressure in the coming days. Investors should closely monitor how the price reacts after reaching the near-term bottom point.


