Published: February 28th, 2024
Following a two-year absence, the Bitcoin price has recently surpassed $50,000, reigniting investor interest in the cryptocurrency industry and driving the value of assets such as Nervos' CKB token. Since the latter half of 2023, the cryptocurrency market as a whole has been optimistic, owing in part to the approval of spot bitcoin ETFs, the impending bitcoin halving cycle, and the anticipation surrounding Ethereum 2.0.
Nevertheless, the momentum gained by the CKB token since September 2023 cannot be exclusively ascribed to external influences. As its primary value proposition, insiders within Nervos emphasize the blockchain's emphasis on modularity and interoperability.
Nervos Network is an open-source protocol suite and blockchain infrastructure designed to facilitate decentralized applications and cryptocurrencies.
Nervos's fundamental purpose is to address the scalability issue that plagues the majority of blockchain platforms. The stratified architecture of the project consists of two distinct layers: the CKB layer is responsible for scaling and processing high transaction volumes, while the secondary layer guarantees maximum security and decentralization.
The foundation of the blockchain is the native token, CKB (Common Knowledge Byte), which represents the computational resources and storage space it contains. CKB fulfills multiple functions, such as facilitating the payment of transaction fees, staking rewards, and block rewards.
Let's see the upcoming price direction of this coin from the CKB/USDT technical analysis:
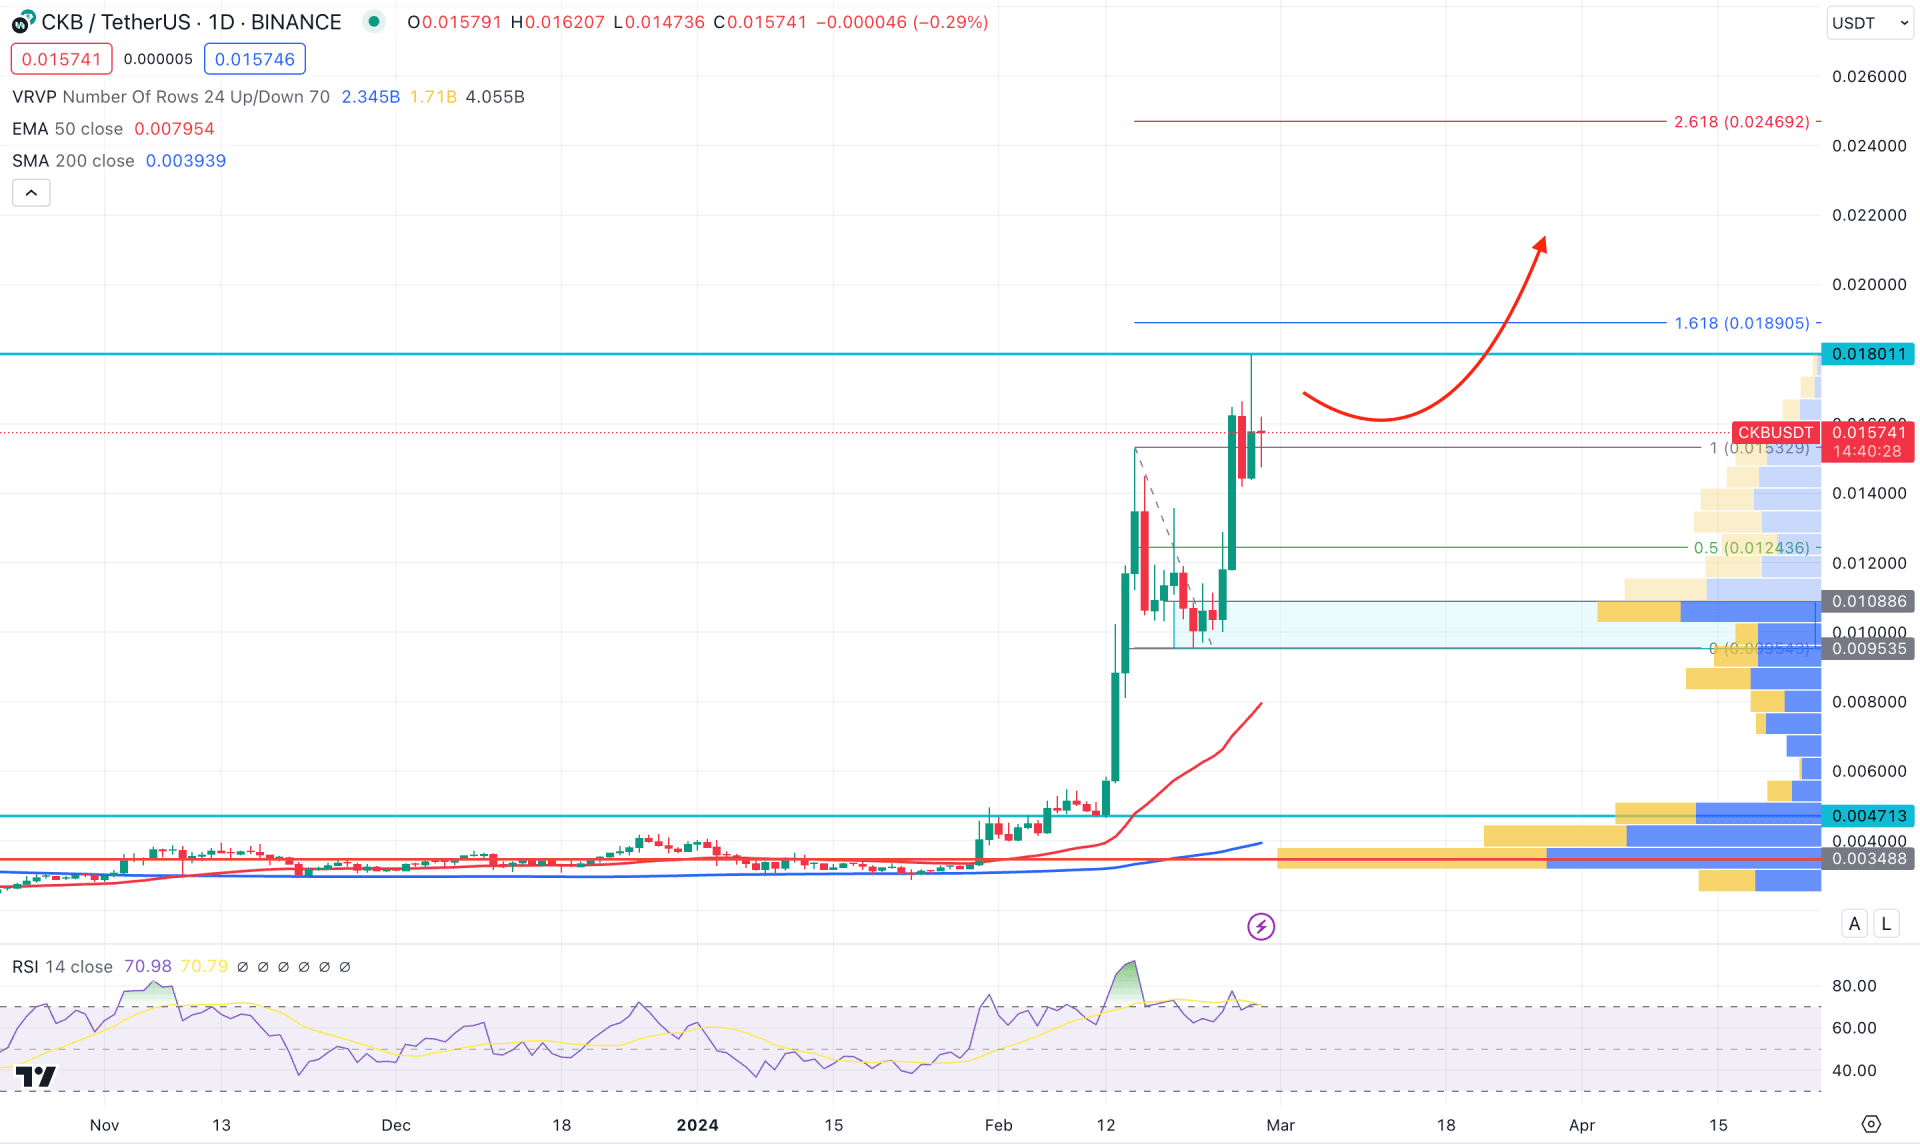
In the daily chart of CKB/USDT, an ongoing bullish impulsive wave is visible, where the current price trades at the multi-year high. Also, the buying pressure is supported by the broader crypto market, where the recent market cap shows a significant money flow to the industry.
Looking at the higher timeframe, a strong bullish candle is visible on the monthly chart, where the current candle closed as a bullish range breakout. However, the monthly decease period has come, and investors should closely monitor how the candle closes. In the weekly chart, the price is overextended from the range breakout, indicating a sufficient downside possibility as a correction.
In the volume structure, a significant downside correction is visible as the current high activity level is marked at the 0.0030 level, which is marginally lower. On the other hand, no new high significant activity is visible at the current swing, except the 0.0108 to 0.0095 zone.
In the daily timeframe, a bullish rally-base-rally formation is seen where the bottom of the latest base is the 0.0953 level. The dynamic 50-day EMA has an upward slope below this line, which supports the buying pressure as a confluence bullish factor. Moreover, the dynamic 200-day SMA is still below the 0.0047 level, which is working as a major support.
As of now, the current price is extremely bullish, with the latest peak at the 0.0180 level. However, the Relative Strength Index (RSI) has failed to follow the trend, creating a potential divergence.
Based on the current daily outlook of CKB/USDT, investors should be skeptical of anticipating the price from the current zone as a potential pump-and-dump scheme could eliminate the gain. In that case, the ongoing divergence with the RSI with a strong bearish daily close below the 0.0124 level could be a strong bearish opportunity, targeting the 0.0080 level.
On the bullish side, a corrective downside pressure is potential, which might result in a bullish reversal from the near-term price area. The first bullish attempt might come from the 0.0108 to 0.0095 zone, from where a strong bullish reversal might open a trend trading opportunity, targeting the 0.0200 psychological level. However, an immediate bullish continuation with a daily candle above the 0.0180 level might offer an aggressive long opportunity without any correction.
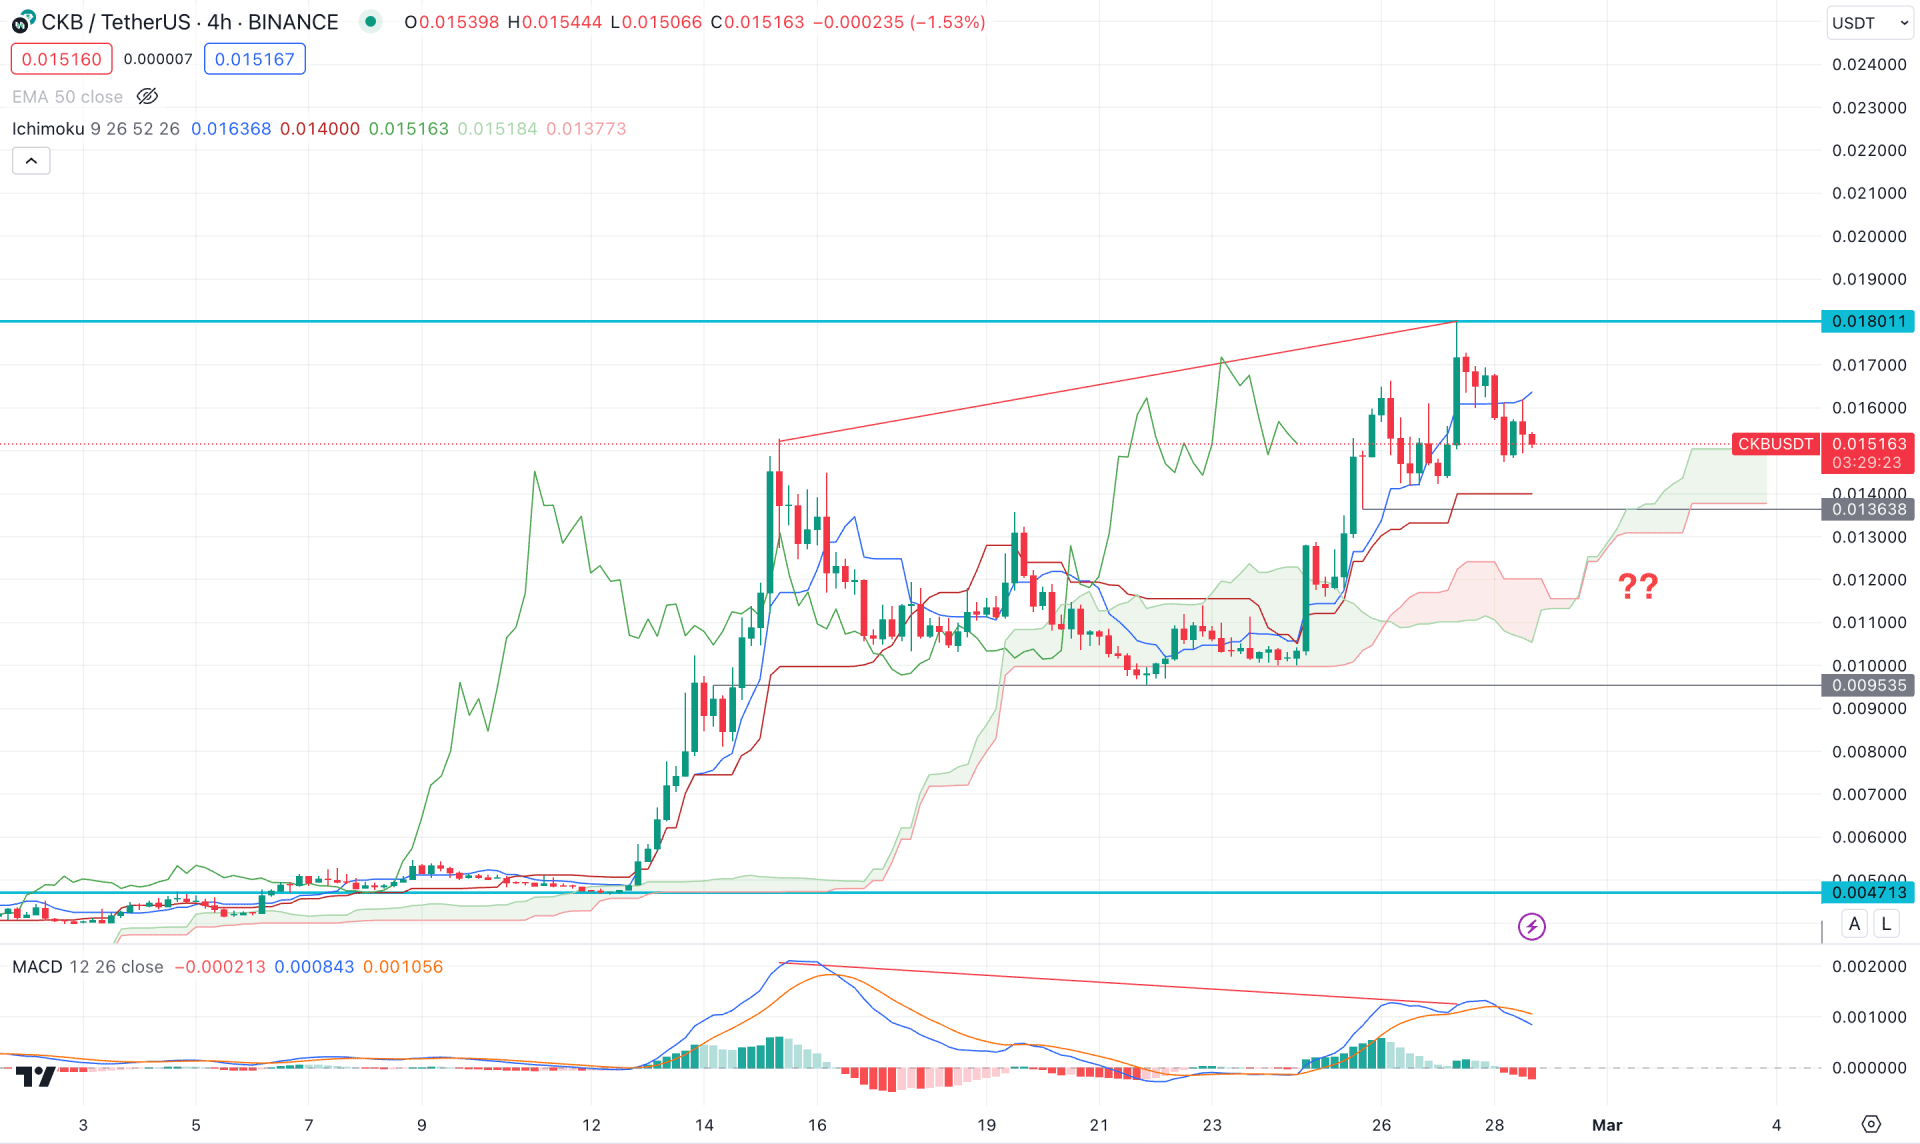
In the H4 timeframe, a MACD divergence is present, where the recent price went sideways above the Ichimoku Kumo Cloud. Although the future cloud is solid with a bullish Senkou Span A, the recent price moved below the dynamic Tenkan Sen line.
The secondary window suggests a downside correction as the Histogram turned red by moving below the neutral line.
Based on the daily market outlook, a sufficient downside correction might come after having a valid H4 candle below the dynamic Kijun Sen level. However, the long-term bullish trend is still intact, and a solid reversal from the 0.0136 to 0.0100 area could resume the momentum. A bearish continuation with a candle close below the 0.0136 level would open a bearish opportunity, targeting the 0.0047 level.
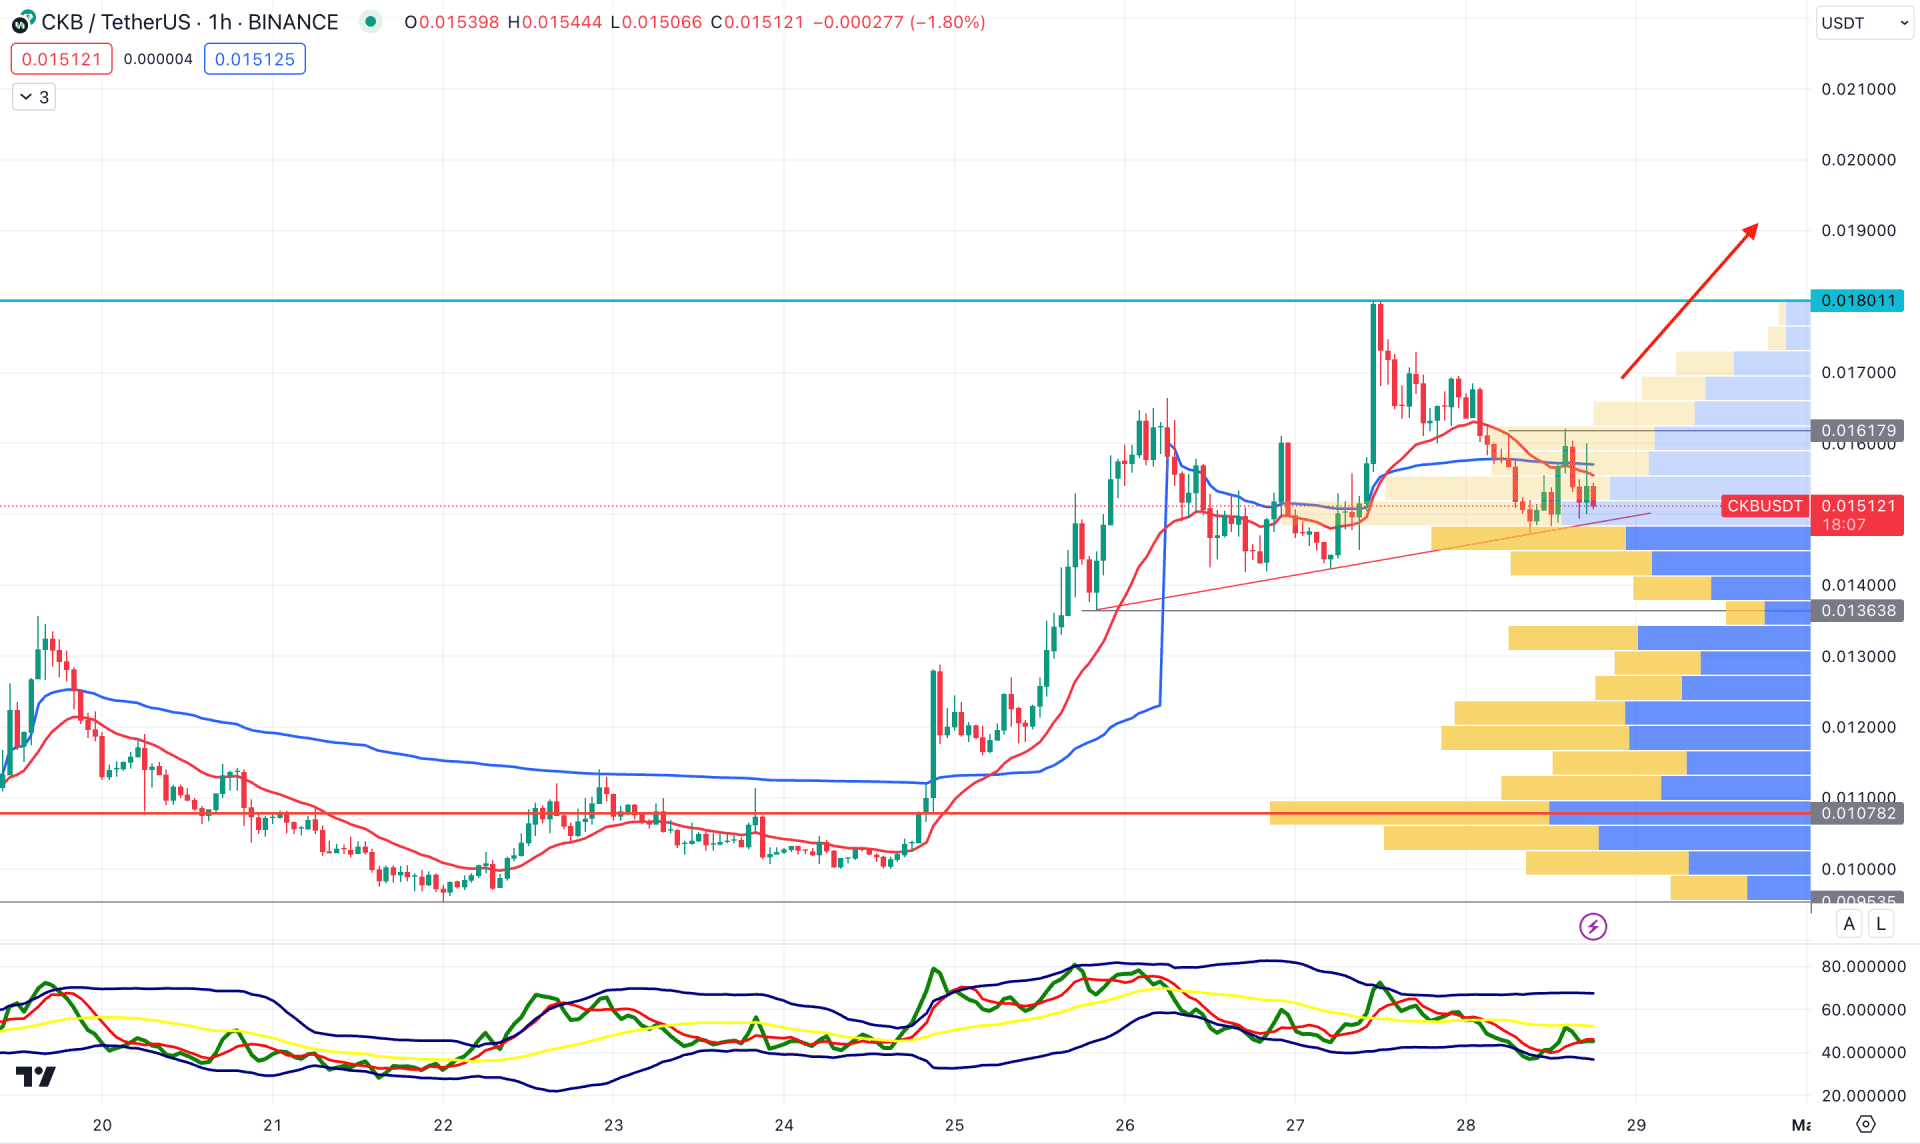
In the hourly time frame, the recent price trades sideways at the trendline support, suggesting a downside pressure to grab the liquidity below the recent swing low. Moreover, a bearish crossover is visible among dynamic lines, where the 20 EMA is above the current price.
In the secondary window, the Traders Dynamic Index (TDI) is below the 50.00 neutral line, suggesting an ongoing selling pressure, while the visible range high volume level is at the 0.01017 level.
Based on this outlook, liquidity sweep from the trend line and a bullish reversal from 0.0145 to 0.0135 zone could be a long opportunity, targeting the 0.0200 level.
Based on the current market outlook, CKB/USDT needs to consolidate in the current area before offering another long opportunity. On the other hand, a bearish continuation is possible, as shown in the hourly chart, but it needs a solid breakout below near-term levels.


