
Published: February 22nd, 2022
NEAR protocol is a layer one blockchain designed for community-run cloud blockchain where the system can eliminate all limitations like transaction speed and low interoperability. NEAR/USDT has become a reliable investment opportunity as the price completed its 2020 bull run, where investors have already experienced a 1000% price surge. However, the recovery from 20.59 swing high and the breach of 11.72 key support level raised a question regarding the effectiveness of the token’s bull run.
NEAR protocol has a strong position for DApps developers due to its user-friendly platform. In this network, NEAR uses human-readable account names, unlike cryptographic formulas. It also introduces a solution to the scaling problem using its self-consensus Doomslug mechanism. Therefore, the recent surge in decentralized finance and DApps opened an opportunity of having another bull run in NEAR/USDT price.
The current circulating supply of NEAR protocol is 64% or 638,887,279.00 NEAR against the max supply of 1,000,000,000. Recently, the 24 hours trading volume of this token showed a 40% increase to $552,390,913 that grabbed massive traders' attention.
Let’s see the upcoming price direction from the NEAR/USDT technical analysis:
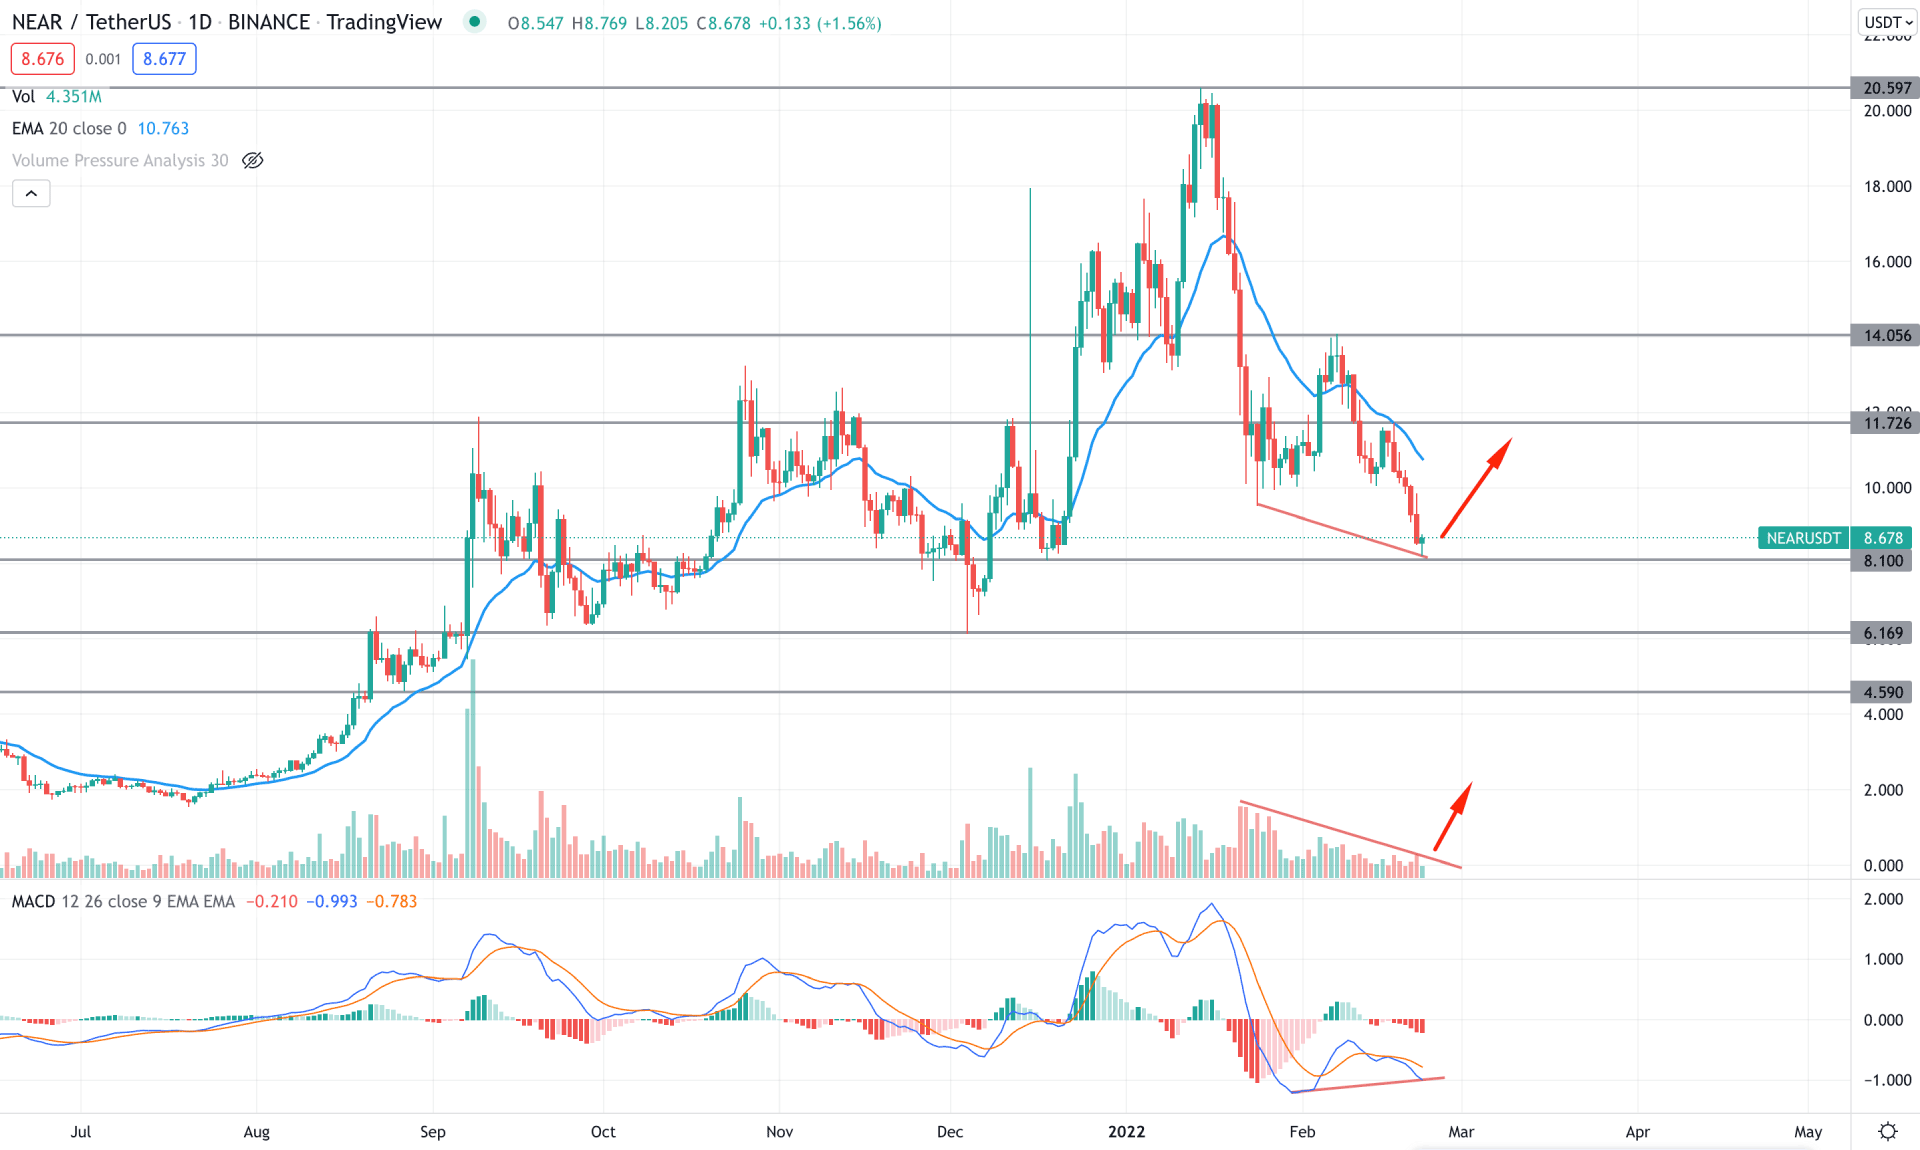
In the NEAR/USDT daily chart, the price showed a massive selling pressure from the current all-time high level where the buyers’ failure to breach the 14.00 level opened a strong selling opportunity. On the other hand, the selling pressure from the 14.00 level almost reached the 8.10 key support level with multiple bullish indications. In that case, investors should closely monitor how the price trades at the 8.50- 7.80 area from where a strong bullish candlestick might change the current market momentum.
The above image shows how the price trades above the 8.10 level where the daily candle is yet to close. Meanwhile, in the indicator window, the MACD Histogram already showed a divergence where MACD lines have failed to make a new low following the price trend. On the other hand, the gap between the price and dynamic 20 EMA opened a bullish opportunity as a mean reversion where a volume breakout is needed.
Based on the daily structure, any strong bullish reversal candle from 8.20 to 7.80 area would open a long opportunity towards the dynamic 20 EMA in the coming days. On the other hand, a break below the 8.00 level with a strong bearish daily close might open another buying opportunity from the 6.16 support level.
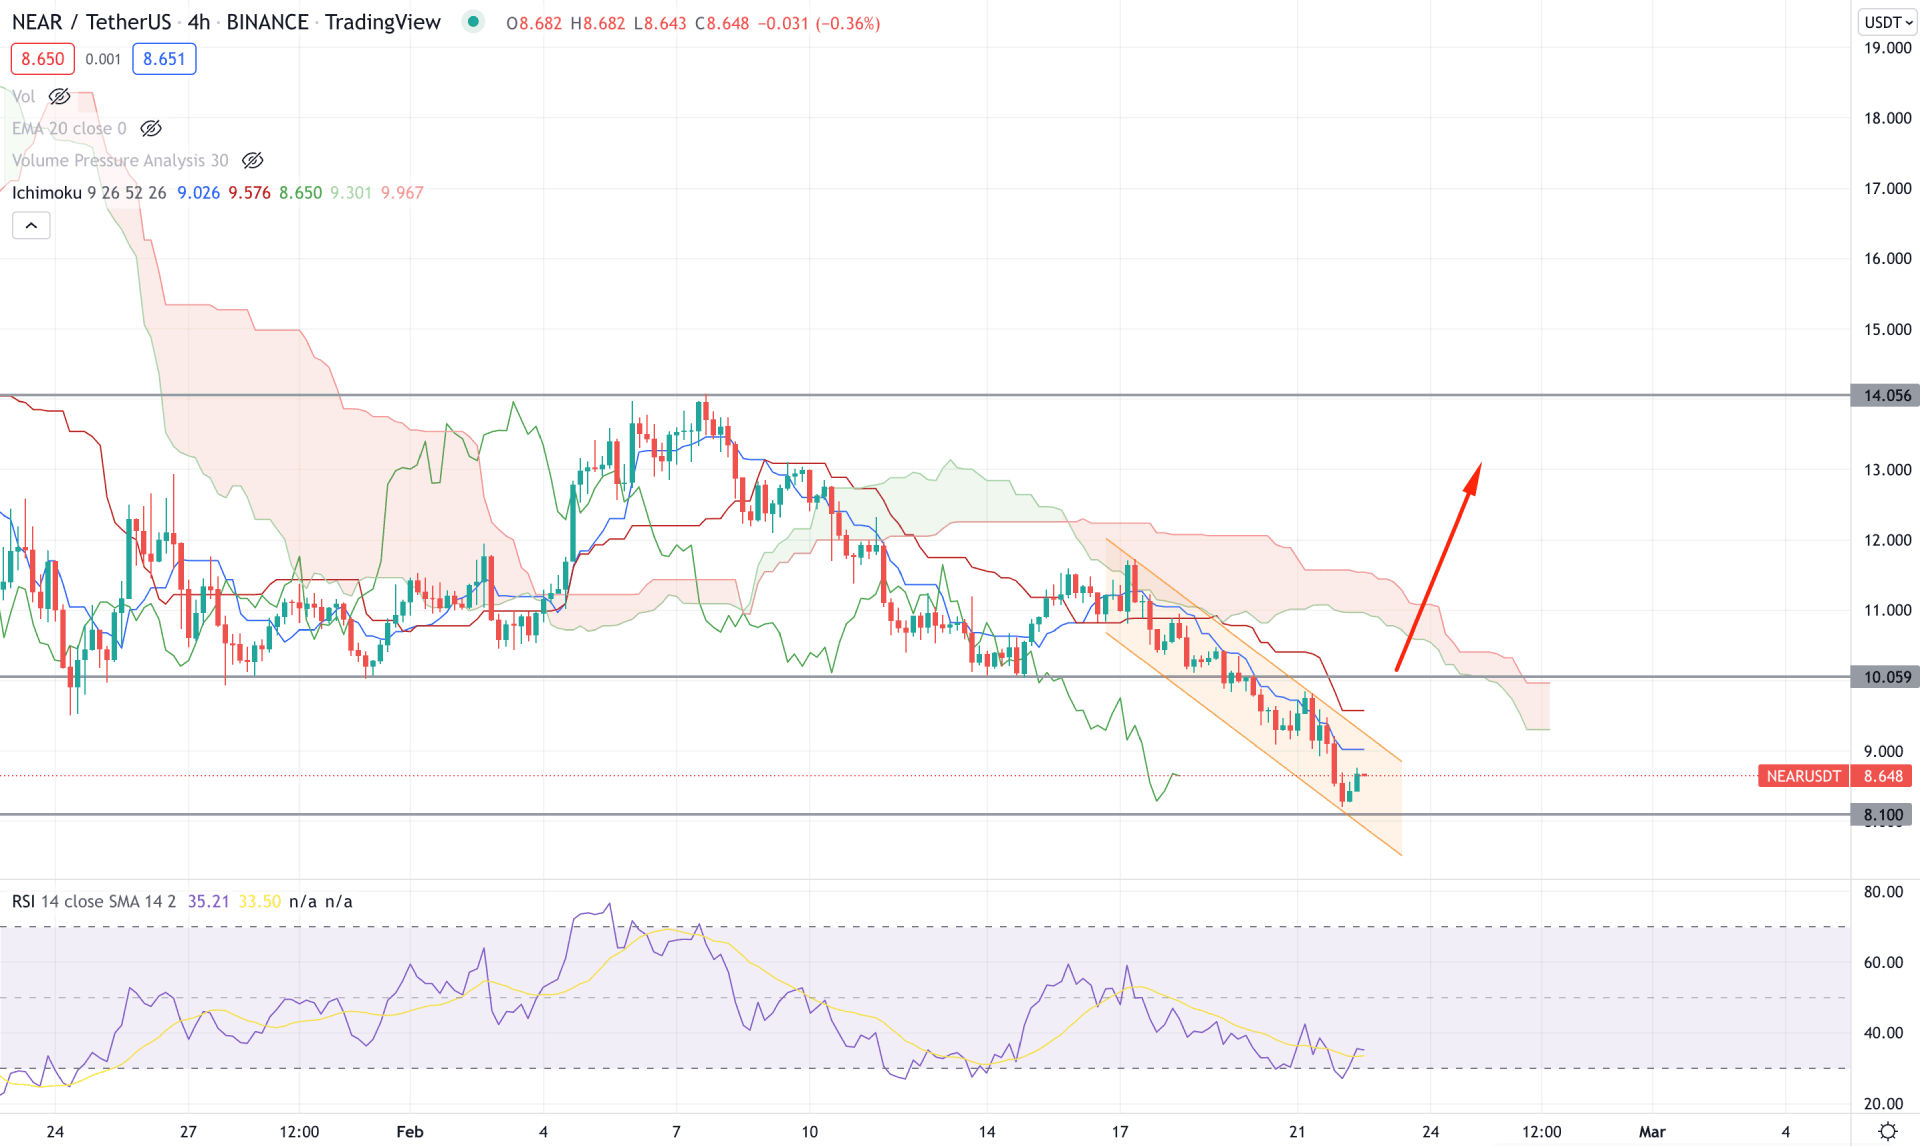
According to the Ichimoku Cloud, NEAR/USDT is trading within a bearish pressure where the recent selling pressure from Cloud resistance came within a bearish channel. Meanwhile, the Senkou Span B is above the Senkou Span A in the future cloud, indicating bears are in control over the price. In that case, investors should closely monitor how the price reacts on the 10.05 resistance level from where the current bearish trend may extend.
The above image shows how the price remained corrective below the dynamic Kijun Sen while the RSI is at the oversold 30 area. In that case, any rebound in RSI above 50 level with an H4 close above the Kijun Sen may raise a question regarding the continuation of the current bearish trend.
In that case, a bullish H4 candle above the 10.05 support level may increase the buying possibility towards the 14.00 area. On the other hand, if bears find the price discounted by forming a bearish rejection at 10.00 level with an H4 close below the Kijun Sen, it may reach the 6.60 level.
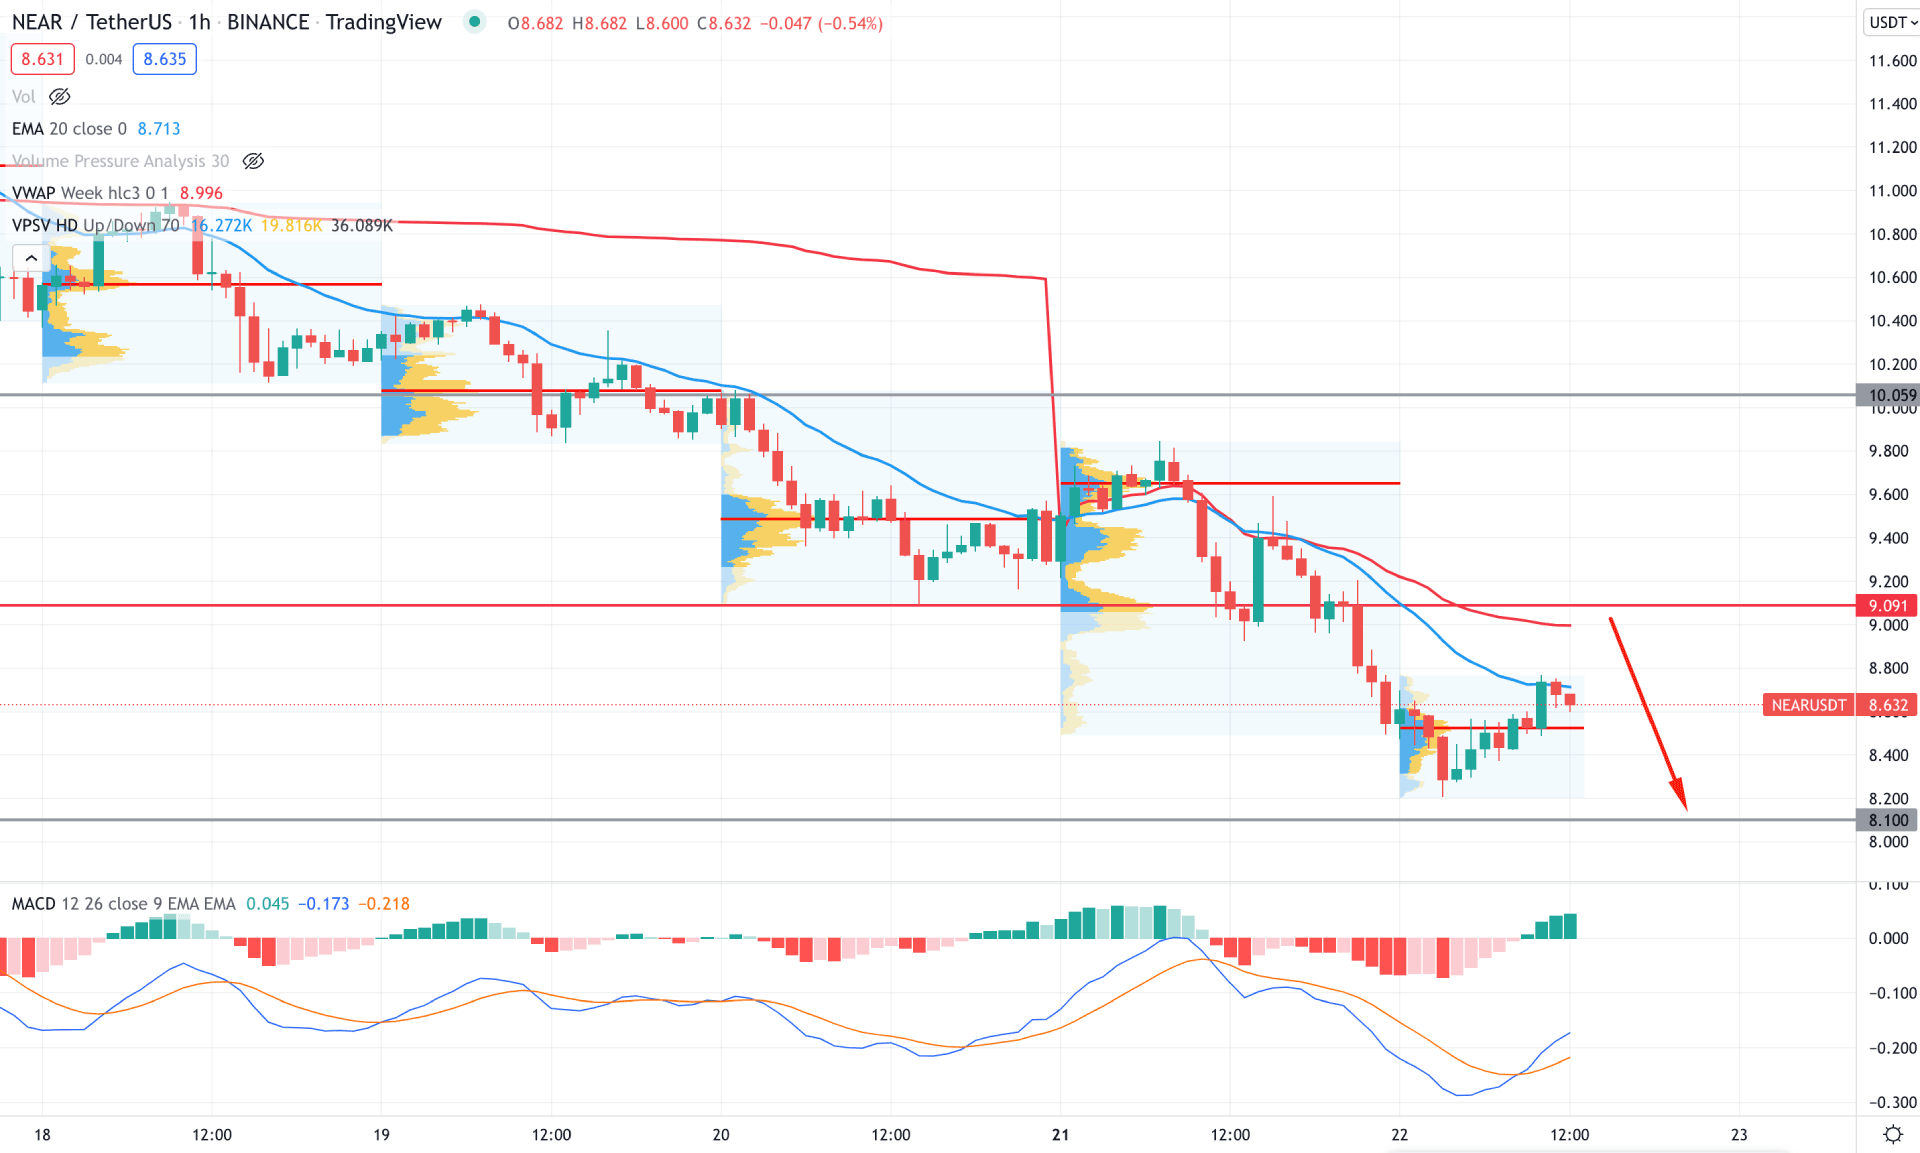
In the intraday chart, NEAR/USDT is trading within a strong selling pressure where the current price faces a bearish pressure from the dynamic 20 EMA. However, the most recent high volume level is below the price that raised a question regarding the effectiveness of the existing selling pressure.
The above image shows how the price trades at dynamic 20 EMA while the MACD Histogram turned bullish. Moreover, dynamic weekly VWAP and 20 EMA are above the price and working as dynamic resistances.
In that case, investors should closely monitor how the price trades at the 9.09 resistance level, where any bearish rejection might increase the selling pressure towards the 6.00 area. On the other hand, a strong bullish breakout above the 9.09 level would indicate a bullish structure break where the ultimate target would be towards the 14.00 area.
As per the current market context, NEAR/USDT bulls should remain cautious about the current price action at the 8.10 support level. Therefore, the ideal bullish approach is to wait for a strong bullish rejection with the volume support from the 8.10 level to find the price at 14.00 in the coming days.


