Published: May 19th, 2026
Following a sudden 25% weekly gain spurred by increased speculation about AI technology and commentary related to Arthur Hayes, NEAR Protocol is quickly emerging as one of the most popular AI-based narratives in the cryptocurrency market. As traders placed NEAR as a possible leader in the developing AI-agent economy, the token saw an additional increase in the most recent session.
Following community conversations that emphasized Hayes' optimistic thesis regarding privacy-focused systems, NEAR's aims and AI-native blockchain execution, and market attention grew. Concurrently, the rally gained momentum as ecosystem activity increased, cross-chain volume rose, and a revived technical breakout signal emerged.
Based on community-driven conversations, privacy-focused design, and AI infrastructure, these are potentially significant long-term growth drivers for the protocol. As traders sought more robust, fundamentally driven AI bets that went beyond short-term meme speculation, the story swiftly spread through the cryptocurrency markets.
Market participants contend that as AI systems evolve from basic content-creation tools into independent digital entities capable of executing blockchain transactions, this infrastructure may someday become crucial. A bullish mood was also reinforced by additional data from the ecosystem. According to community studies disseminated across cryptocurrency marketplaces, NEAR Intents is currently processing billions of cross-chain transactions, and system activity and fee generation are still growing.
Let's see the investment opportunity in this coin from the NEAR/USDT technical analysis:
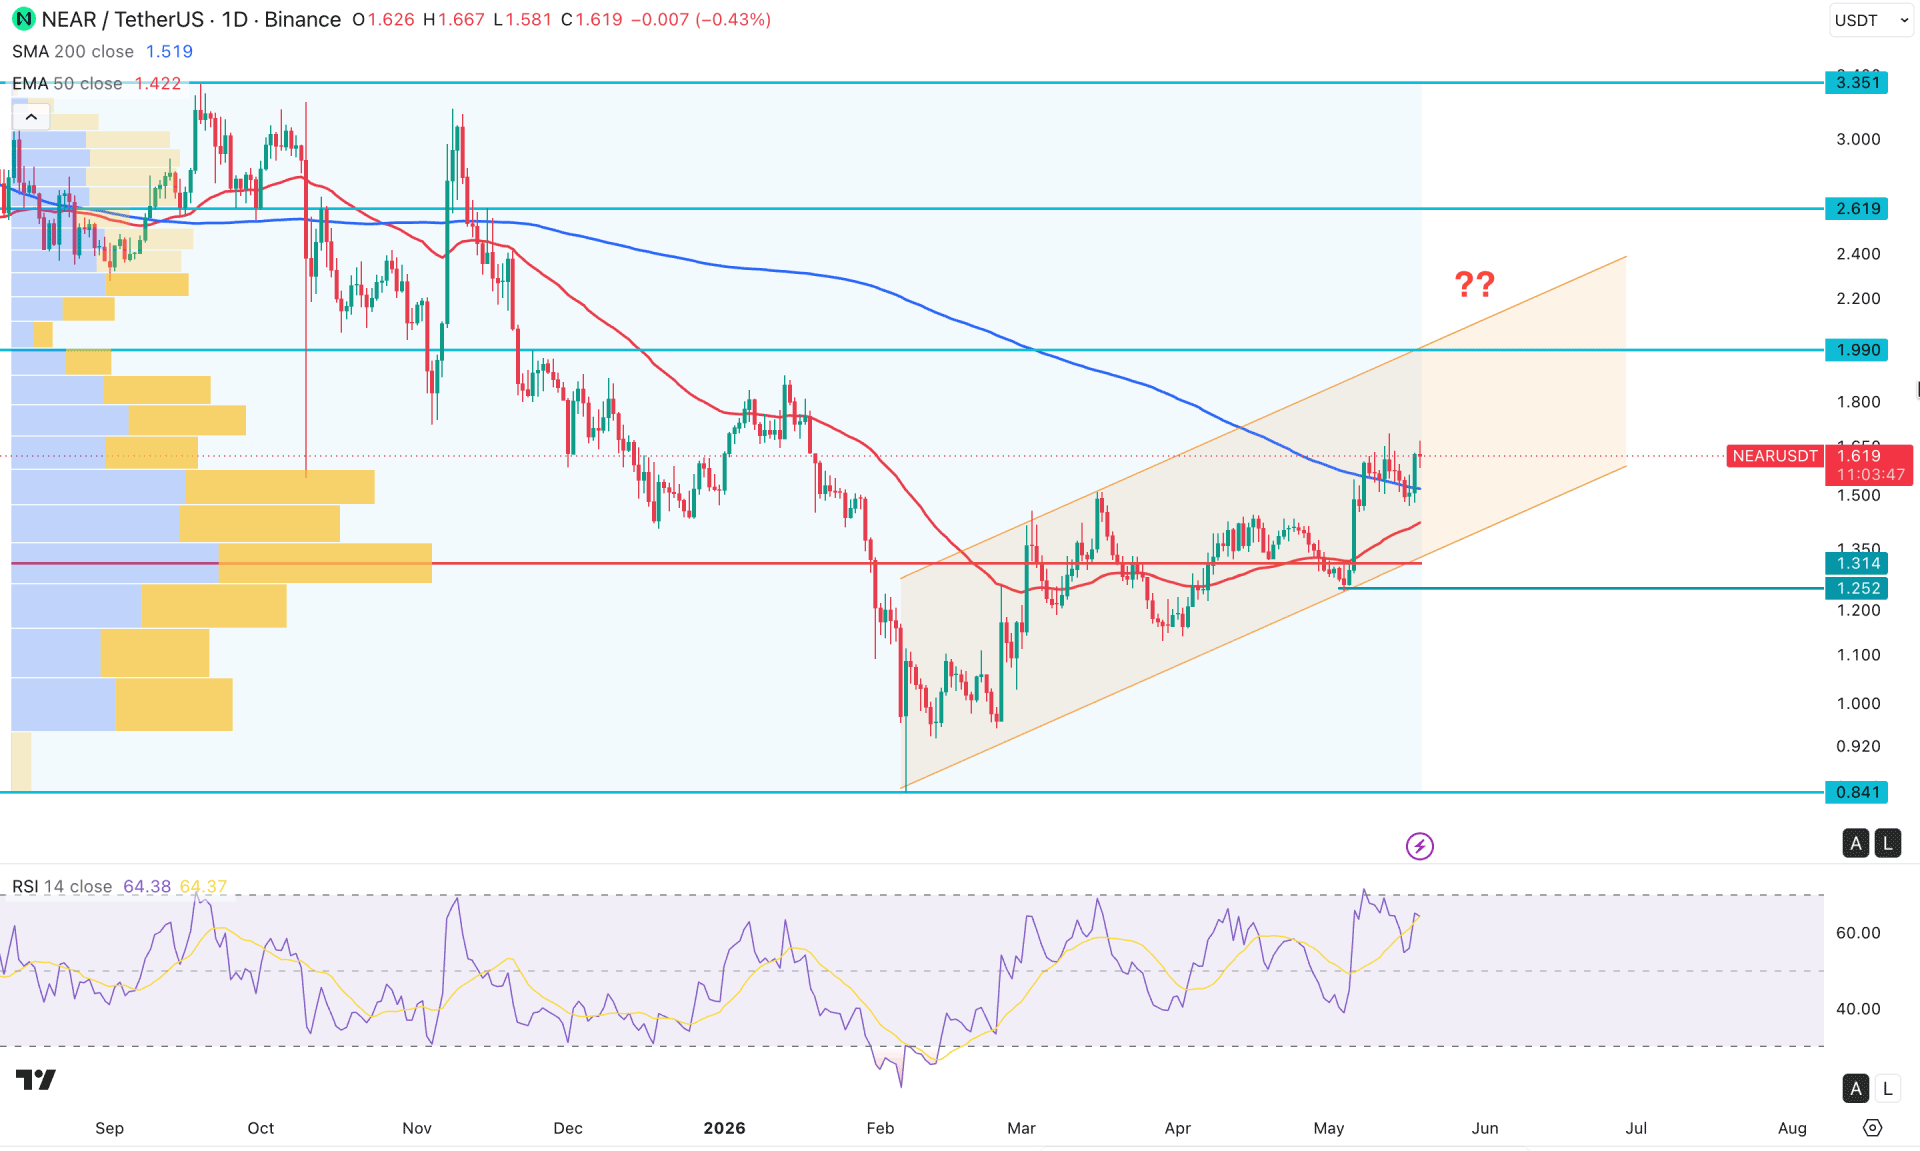
In the daily timeframe, NEAR/USDT is trading within a sideways bullish trend backed by a bullish impulsive wave. In the current context, a pullback is yet to form, creating a short-term bullish opportunity. However, more confirmation is needed before anticipating a bullish trend reversal.
In the higher timeframe, the recent buying pressure in the monthly timeframe suggests a long-term HODLing opportunity, as the price met a significant low below the October 2023 bottom, signaling a massive sell-side liquidity sweep. As the price aimed higher by creating multiple monthly bullish candles, it is a sign of a bullish trend continuation. However, the weekly timeframe is still sideways, as the buying pressure from the bottom remains within an ascending channel.
In terms of trading volume, the recent bullish activity is valid, as the most active level since August 2025 is at the 1.314 level, which is below the current price. Moreover, an impulsive buying pressure is seen from the high-volume support line, which is now working as a confluence of pressure.
In the main price chart, the 50-day EMA has a bullish slope from the high-volume level, suggesting there is strong buying pressure. Moreover, the price tried to face selling pressure from the 200 SMA, but after multiple attempts, a strong bullish candle above the resistance line is visible.
In the Relative Strength Index, the current line oscillates between the 50 and 70 areas, signaling buying momentum in the main price chart. The trend formation is also confirmed by the average directional index indicator, which is currently at the 34.22 level after having a bullish rebound from the 21.00 area.
Based on the daily market outlook, the primary aim of this pair is to look for long trades only as long as the price remains above the 200 SMA. The resistance level is marked at 1.990, which is a crucial level to watch.
On the other hand, the ascending channel is likely to have resistance at the 1.990 and 2.3300 areas, from where selling pressure could emerge. In that case, a bearish reversal candle from the 1.990 level with a break below the 200-day SMA could offer a short-term opportunity, and the ultimate target would be to test the 0.841 key support level.
However, overcoming the 2.61 key resistance line could invalidate this opportunity and open the room for moving toward the 3.351 area.
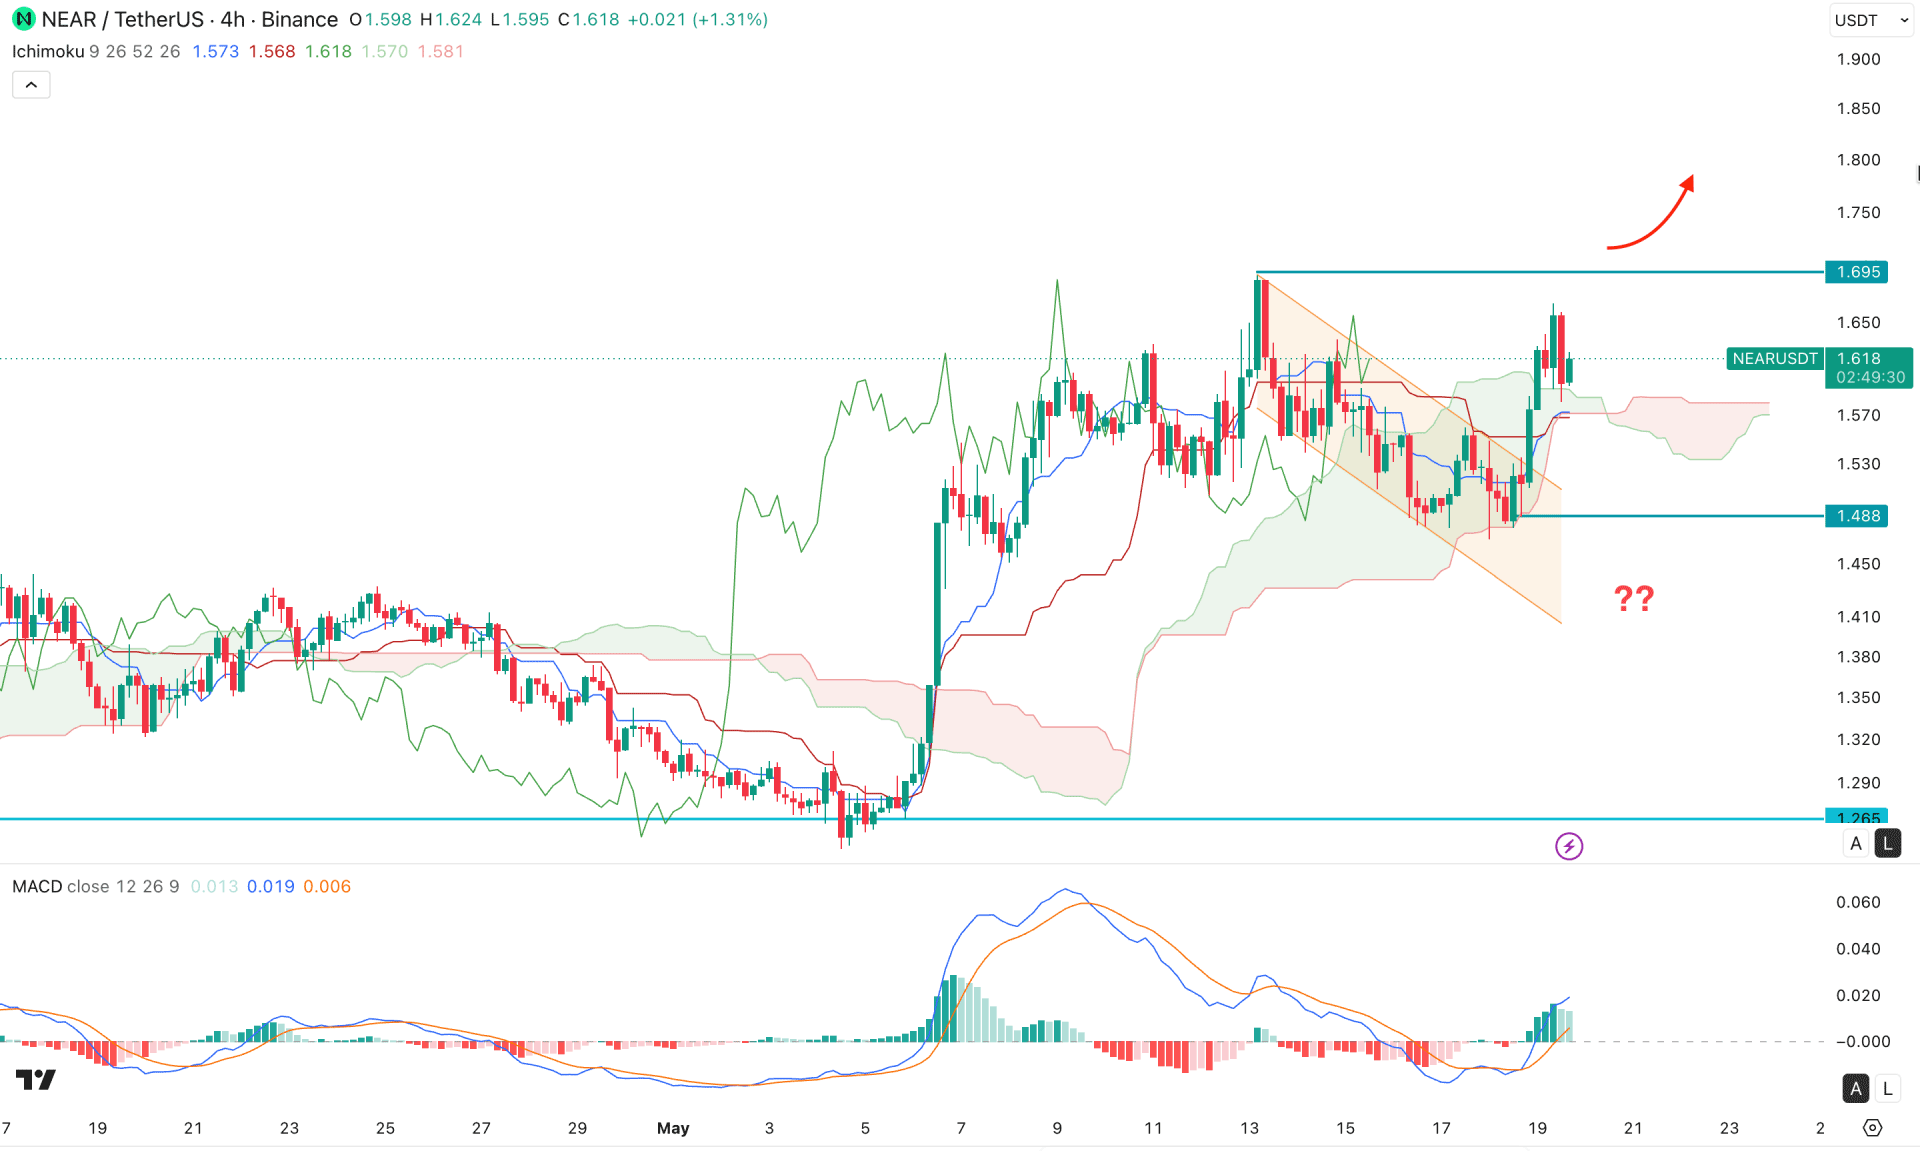
In the NEAR/USDT 4-hour timeframe, a massive bullish impulsive wave is seen, creating a potential breakout above the Kumo cloud area before making multiple higher highs. Moreover, the most recent price showed a valid retest of the cloud support before forming a descending channel breakout. Primarily, the price is trading above the cloud support area, from where a bullish continuation is possible.
In the future cloud, both lines are pointing upwards, suggesting a weaker bearish momentum with possible bullish opportunities.
In the secondary indicator window, a valid bullish bottom formation and rebound are seen from the MACD signal line, with multiple vertical lines above the neutral level in the histogram area.
Based on this outlook, a minor correction toward the Kumo cloud support area could increase the long opportunity. In that case, the 1.488 bottom could be a crucial level to watch, as a break below this line would invalidate the long opportunity at any time.
On the bullish side, the immediate resistance is located at 1.69511, and overcoming this line could extend the buying pressure to the 1.833 Fibonacci Extension level.
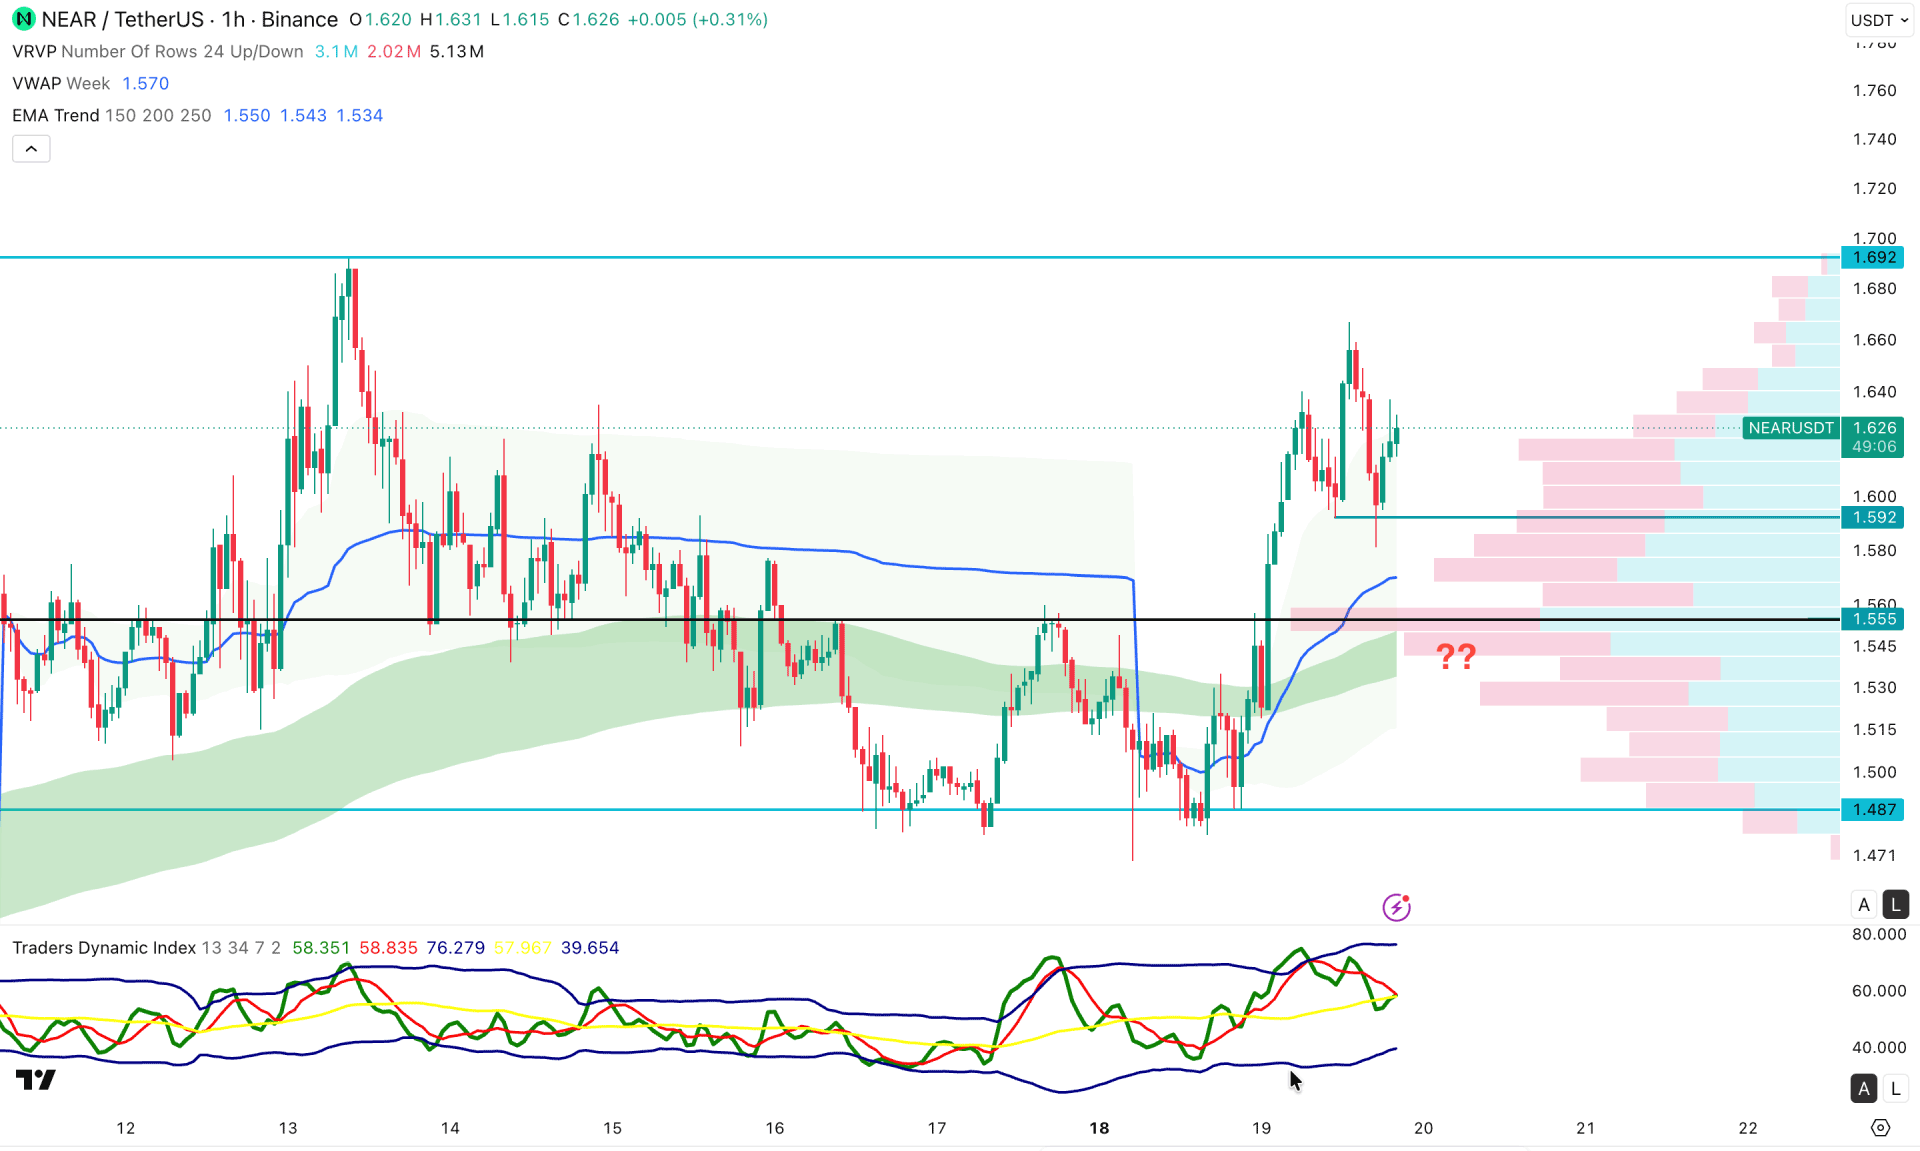
In the hourly timeframe, NEAR/USDT is trading within an impulsive bullish pressure as the price aims higher from a potential range-bound phase. As a result, a new swing high is formed.
In the main price chart, the high-volume line is below the current price and is working as support, while the weekly VWAP is having a bullish crossover with the high-volume level, signaling strong buying pressure.
In the secondary indicator window, the Traders Dynamic Index is hovering above the 50.00 neutral point. The gap with the bullish peak area has expanded, creating a bullish opportunity.
Based on this outlook, we may consider the bullish possibility as valid as long as the price remains above the 1.555 high-volume line. Moreover, a bullish continuation with an hourly candle above the 1.6900 level could open the room for moving beyond the 1.8000 area.
On the other hand, the price is already trading in the premium zone, from where a considerable downside correction is pending. A failure to hold the price above the intraday high-volume support could be a strong bearish factor.
Based on the overall market outlook, NEAR/USDT is trading within an extreme bearish zone, from where buying pressure is possible. The daily price is within an ascending channel, where the near-term resistance would be the crucial area to watch. Before opening a long position, a valid bullish breakout is needed to avoid unexpected liquidity hunts.


