
Published: May 21st, 2026
As the extreme heat gripping the Mid-Atlantic area is predicted to lessen, US natural gas prices increased to $3.000 a MMBtu on Thursday, following sliding 3.5% in the prior session.
Following exceptionally high temperatures earlier this week, milder weather is forecast for the long Memorial Day weekend and the following week, which should reduce petrol consumption.
Additionally, due to seasonal maintenance at facilities like Freeport LNG and Golden Pass, flows to significant US LNG export operations have decreased from an annual total of 18.8 bcfd in April to about 17.0 bcfd thus far in May. The storage data, which is anticipated to reveal a close to normal injection of 96 Bcf for the previous week, is currently awaited by market participants.
In other news, it is said that three US LNG ships will make their first exports to China since February 2025 in June.
The prospect of the Strait of Hormuz remaining closed for the near future is favorable for nat-gas since it will reduce supplies from the Middle East and possibly increase US nat-gas shipments to compensate for the shortage.
The prospect of restricted global LNG supplies provides some medium-term support for nat-gas prices. Qatar claimed "extensive damage" to Ras Laffan Industrial City, the biggest natural gas export facility in the world, on March 19.
According to Qatar, it will take 3 to 5 years to rebuild the 17% of Ras Laffan's LNG ability to export that was damaged by the Iranian attacks. Reducing the Ras Laffan plant's capacity could increase US nat-gas exports because it supplies around 20% of the world's liquefied natural gas.
Additionally, the blockade of the Strait of Hormuz as a result of the Iranian conflict has severely reduced the supply of natural gas to Europe and Asia.
Let's see the complete outlook of this instrument from the NG multi-timeframe analysis:
In the daily timeframe, Natural Gas (NG) price has reached a multi week low and formed a bullish rebound, creating a valid bottom. As the bullish price action is seen from a record low price, it might work as an investment opportunity from a discounted price zone.
Looking at the higher timeframe, the monthly candle suggests a possible rebound as no new low is visible below the April 2020 low. Instead, the price rebounded higher and moved above the monthly flip zone. In that case, a monthly close above the 2.900 level could work as a solid bullish rebound possibility.
The weekly timeframe is also bullish as a strong weekly candle appears after three weeks of consolidation. Although the price is aiming higher, some minor downside correction could happen before following the major market trend.
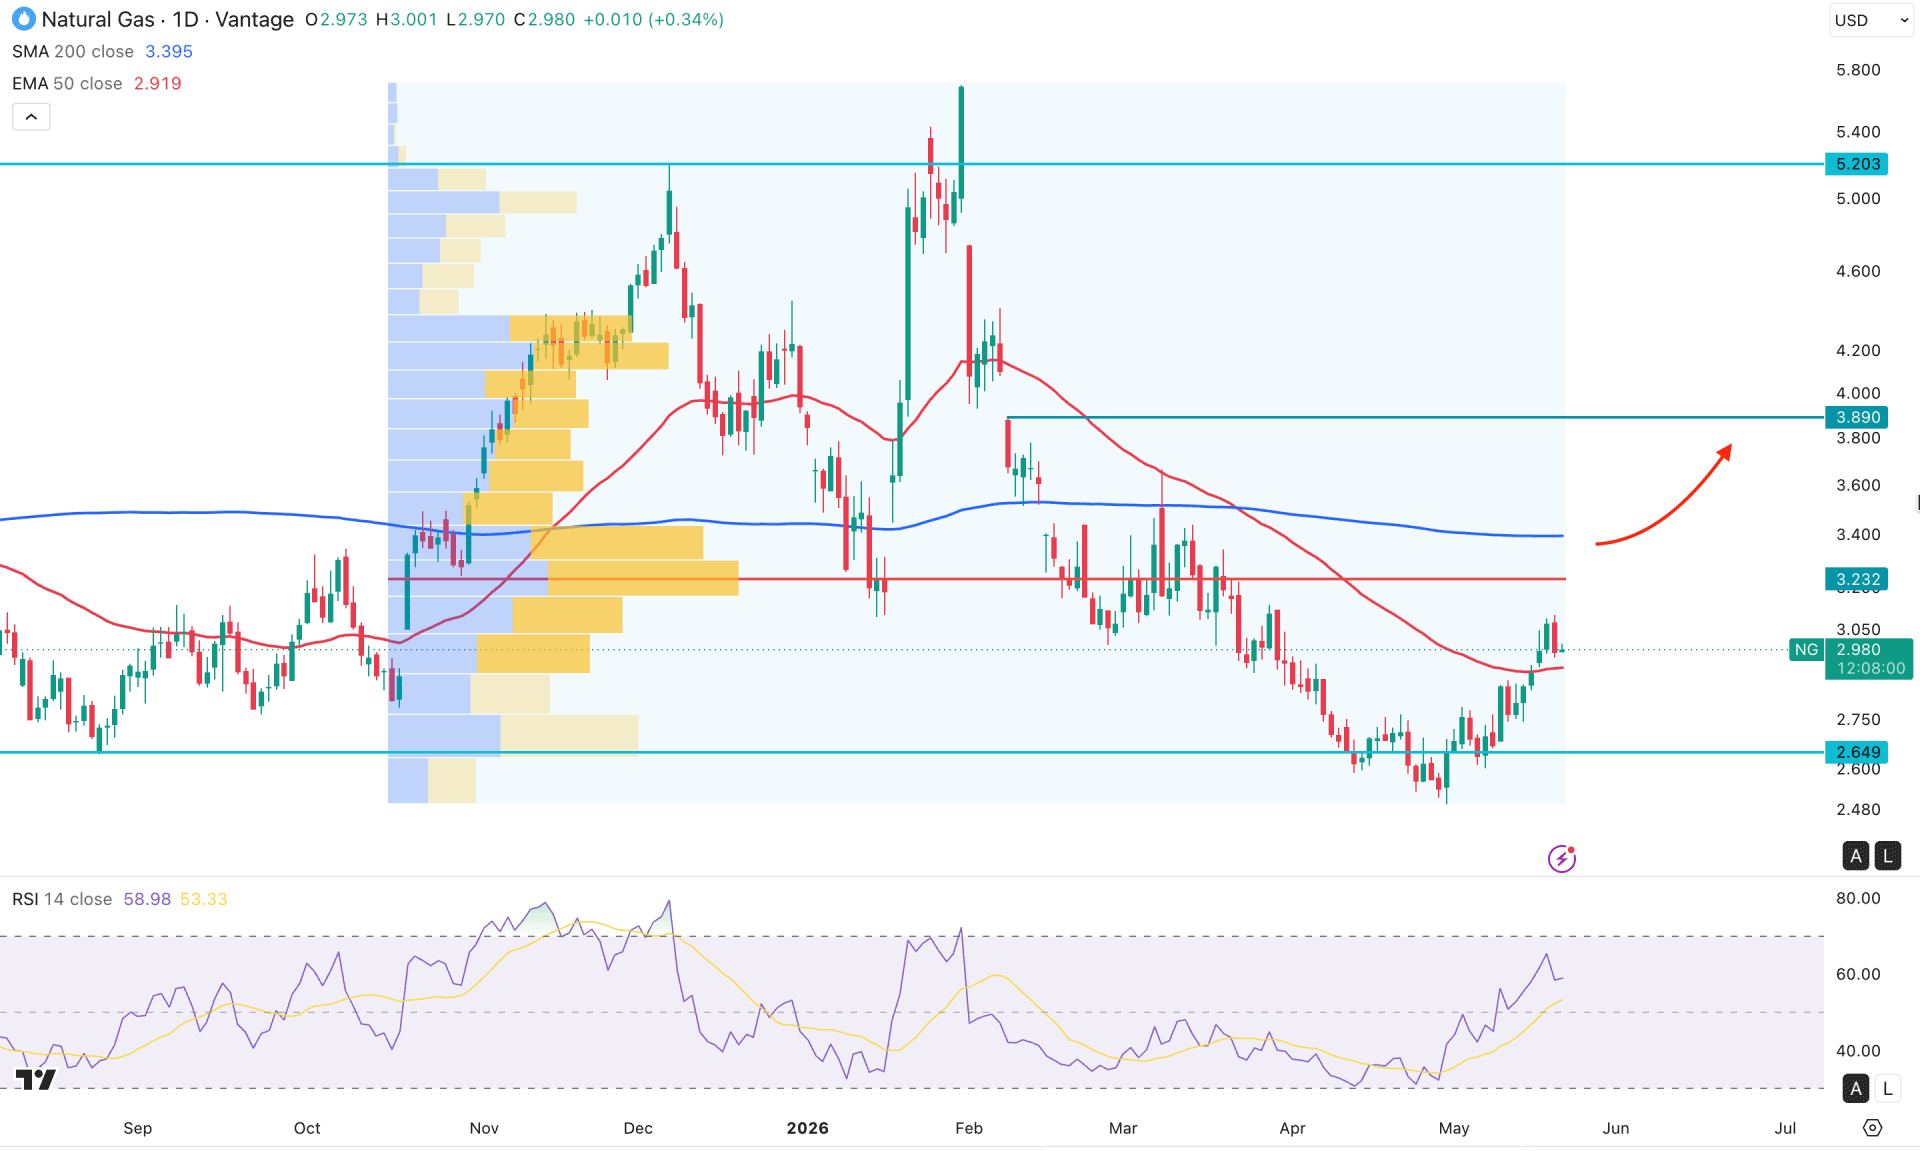
In terms of volume, the price is still trading in the sellers' zone as the largest activity level since October 2025 is at the 3.232 level, which is just above the current price. Primarily, the price is trading below this crucial high volume line, and investors should closely monitor how the price reacts after reaching that level.
In the main price chart, the 50 day EMA and 200 SMA are both heading downward as crucial resistance. Although the price is at a valid bottom, a proper trend continuation opportunity might come after overcoming this dynamic resistance with a valid daily close.
In the indicator window, the Relative Strength Index is hovering between 50 and 30 levels, signaling an ongoing bearish pressure. Overcoming 50.00 could open the room for moving to the 70.00 overbought area.
Based on the current market structure, the NG price has a higher possibility of aiming higher as a significant liquidity grab is visible below the 8-week low. Although the long-term bullish opportunity is valid, a medium and short-term trend continuation needs a proper price action above the 3.23 high volume line. On the bullish side, the immediate resistance to look at is the 3.890 level, and overcoming this line could open the room for moving to the 5.200 area.
On the other hand, the 50-day EMA and high volume resistance at 3.232 could limit the buying pressure at any time. In that case, a failure to overcome this line with a valid rejection candle could increase the possibility of making a new swing low below the 2.493 area.
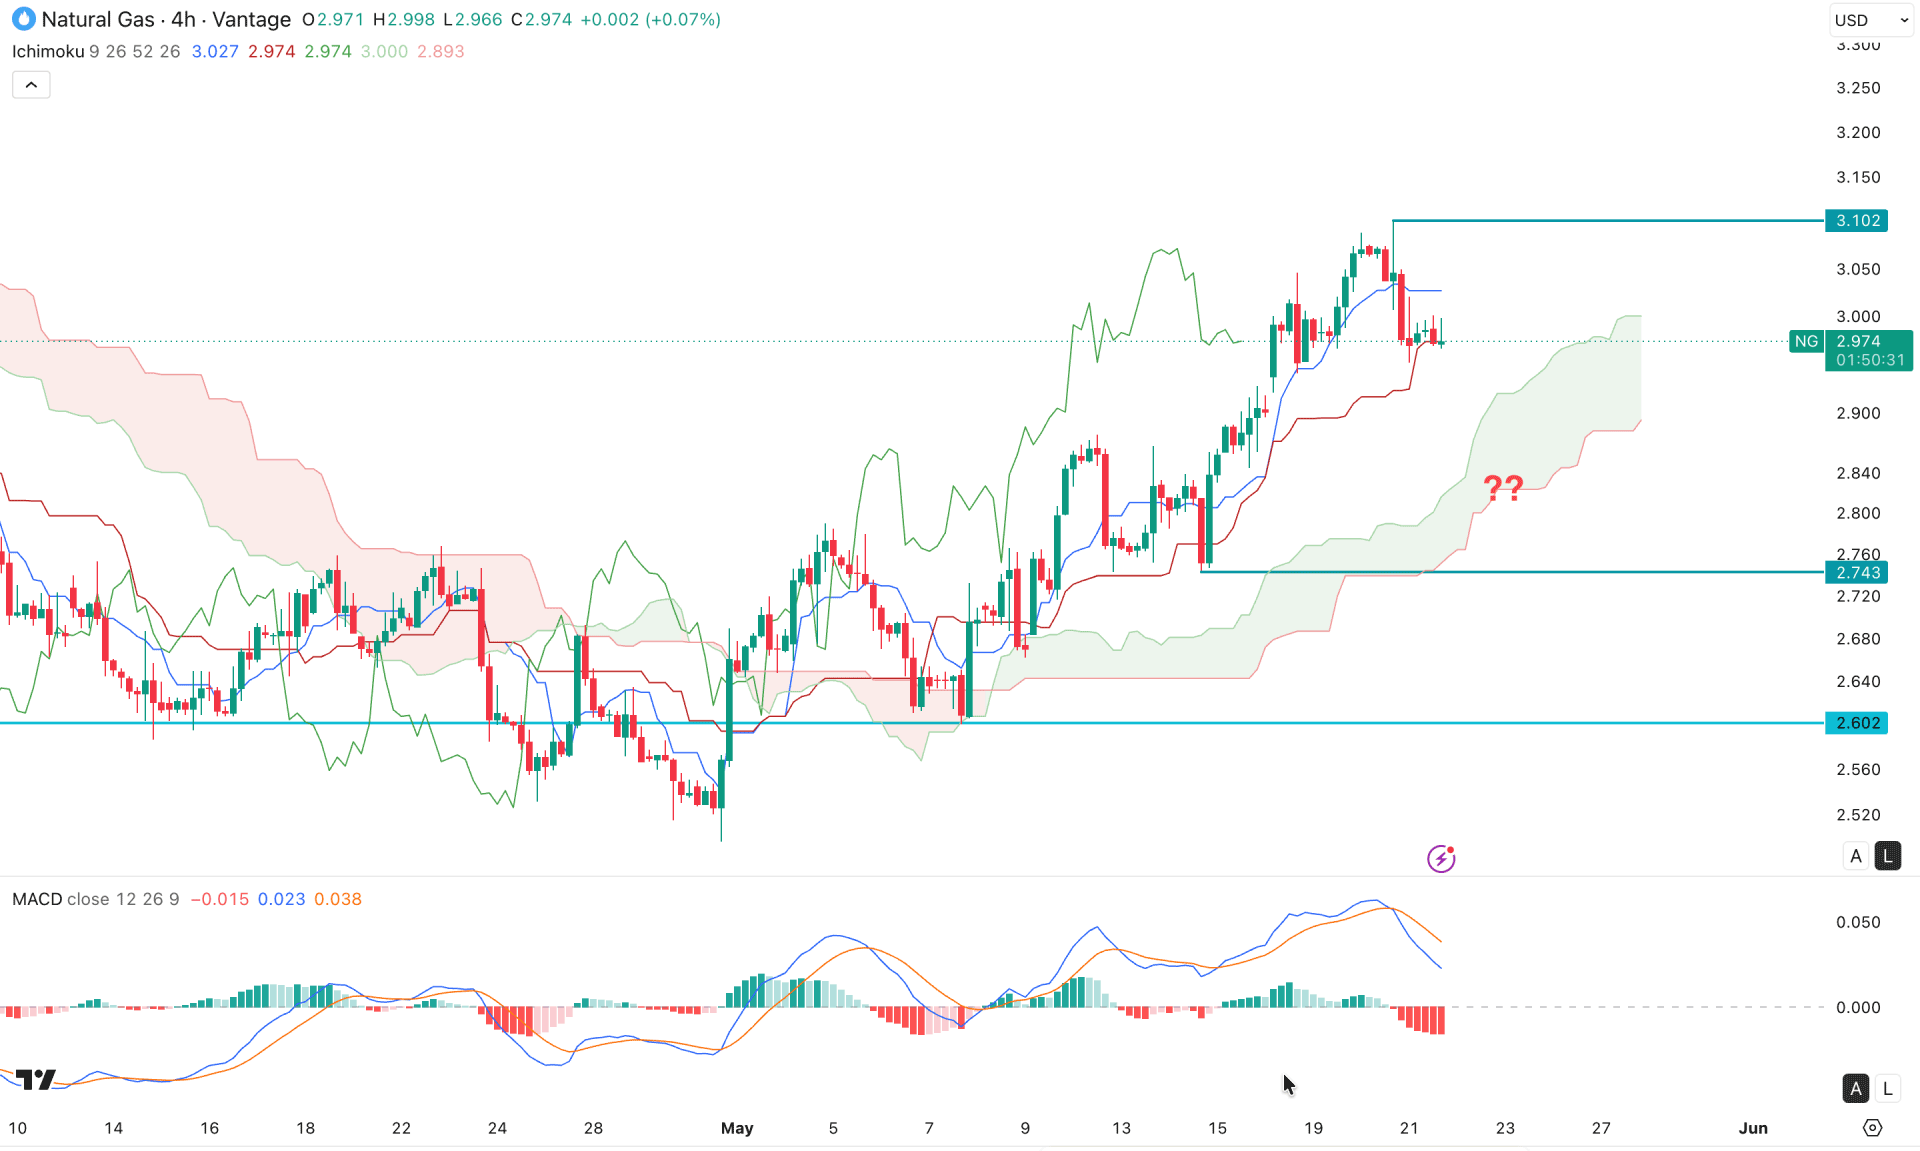
In the H4 timeframe, NG is trading within a bullish wave where the existing market momentum is above the cloud support. Moreover, the future cloud is solid for considering a bullish trend continuation as both lines are heading upward almost parallel.
In the secondary indicator window, a bearish correction possibility is seen from the bearish crossover in the signal line, where the histogram remains below the neutral line for a considerable time.
Based on the four hour market outlook, the price is facing a challenge after creating a swing high at the 3.102 level as it rebounded to the Kijun Sen support. In that case, a failure to hold the price at the 2.939 support level could increase the possibility of testing the 2.743 level.
However, the secondary support is located at the cloud area for a bullish rebound, and a recovery above the dynamic area could invalidate the bear opportunity and open the room for moving beyond the 3.20 level.
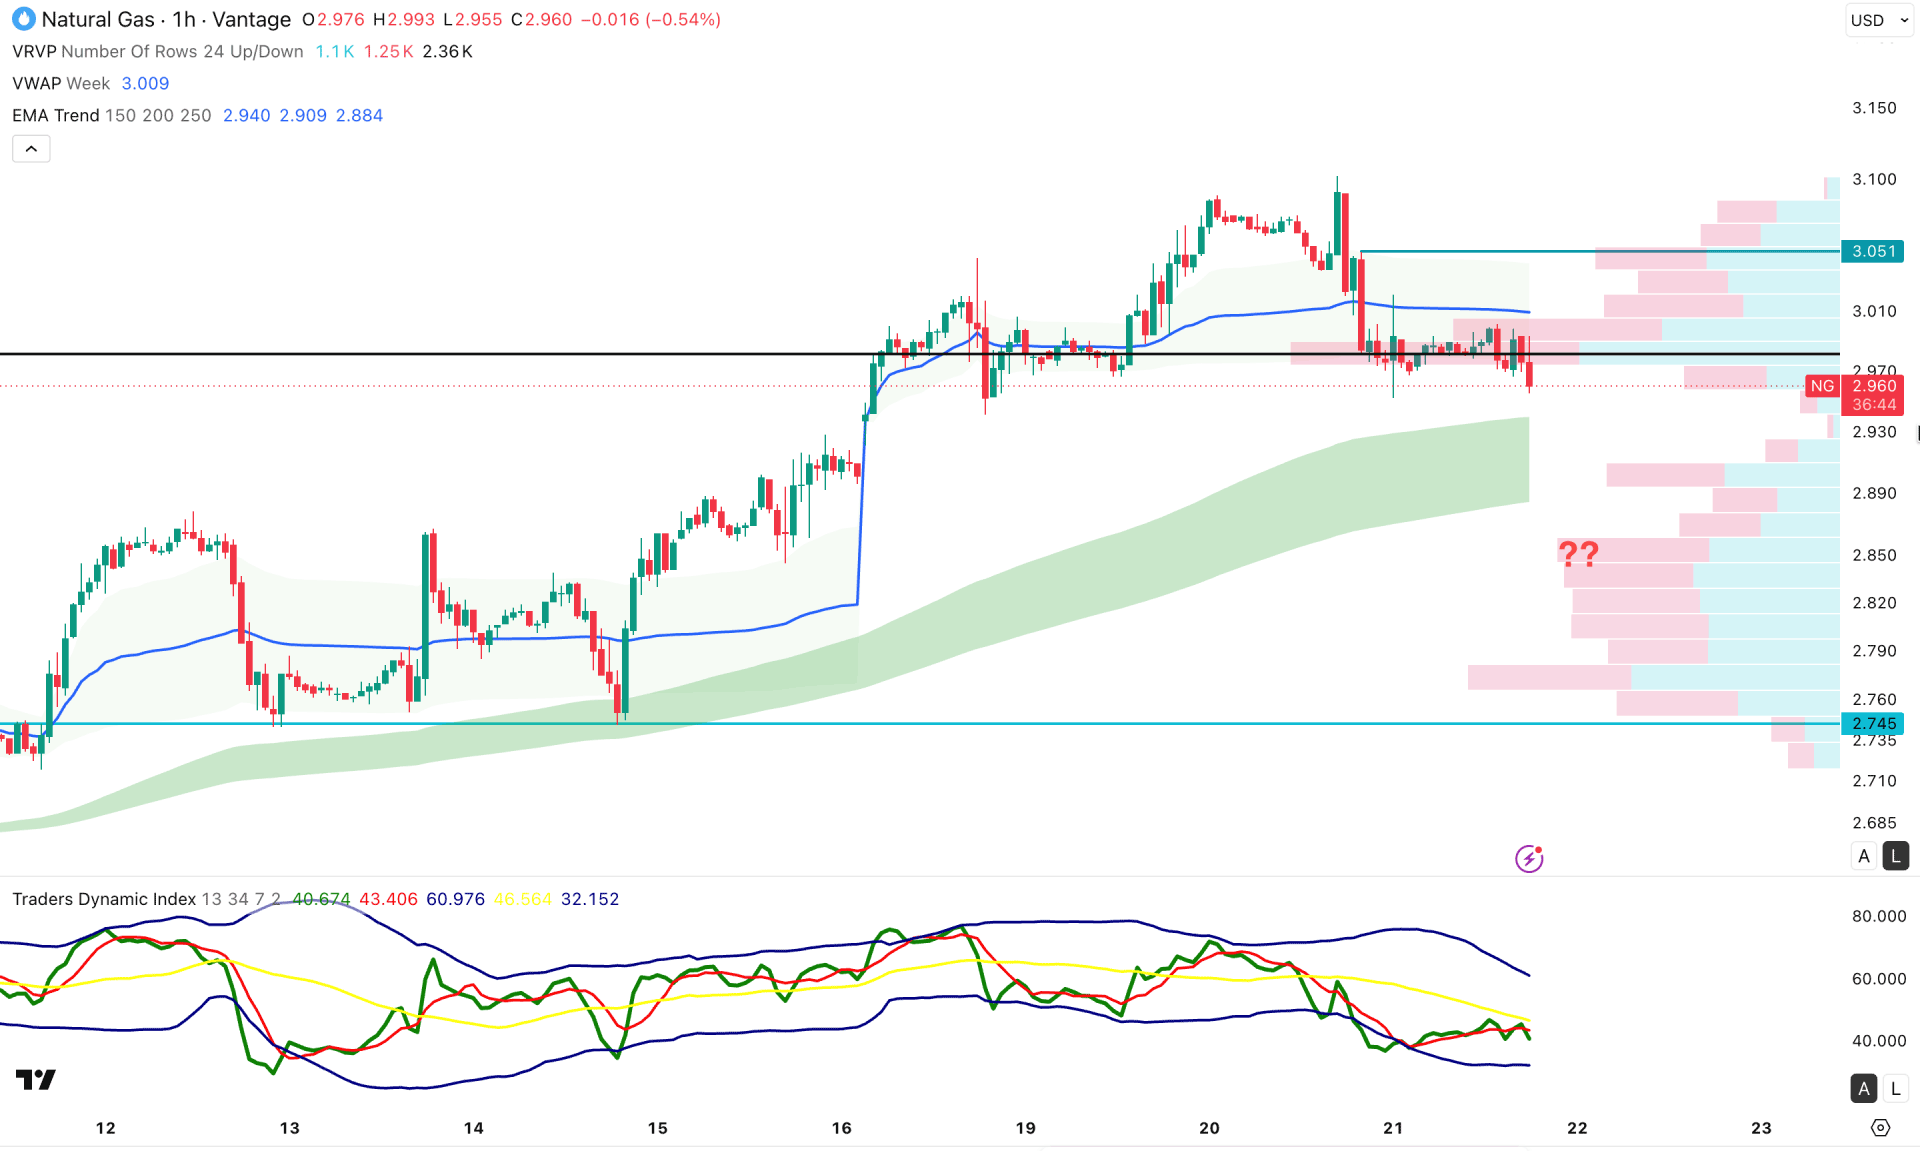
In the hourly timeframe, the NG price is trading within bearish pressure as the most recent price is having a bearish range breakout after taking multiple liquidity from the top. As a result, an hourly bearish signal is visible from the intraday high volume line, while the weekly volume profile remains above the structure as a resistance.
On the other hand, the EMA wave is below the current price and working as an immediate support that is a crucial barrier for sellers. The indicator window shows a similar structure where the Traders dynamic index is below the 50.00 neutral point with a downward slope.
Based on the overall hourly market structure, the price is likely to create a new swing low and find liquidity at the EMA wave area. In that case, before taking any long entry, additional attention is needed.
As per the overall market structure, NG is trading at a crucial bottom from where a long-term bullish trend might form. However, the price action is still bearish below crucial dynamic lines that need additional attention to open a long position in the lower timeframe.


