
Published: May 18th, 2023
On Wednesday, natural gas futures in the US declined, signaling the first daily decline in four days. This decline was influenced by a larger-than-anticipated increase in gas inventories.
Gas futures for June delivery settled at $2.35 per million British thermal units at 10:13 a.m. EDT on the New York Mercantile Exchange, down 1%. Due to milder weather forecasts, prices increased by 2.5% earlier in the session.
According to estimates from 12 analysts surveyed by Reuters, U.S. utilities likely added 107 billion cubic feet (bcf) of gas to storage in the week ending May 12. During the same week last year, the increase was 87 bcf, while the average injection over the five-year period from 2018 to 2022 was 91 bcf.
According to Refinitiv data, the next two weeks are anticipated to have more cooling-degree days, indicating an increase in natural gas demand. The expected number of cooling-degree days exceeds the 30-year average of 95. Another projection shows that the U.S. gas demand, including exports, could decrease from 92.8 billion cubic feet per day (bcfd) this week to 89.8 bcfd the following week.
Should you buy Natural Gas now? Let’s see the complete outlook from the Natural Gas (NG) technical analysis:
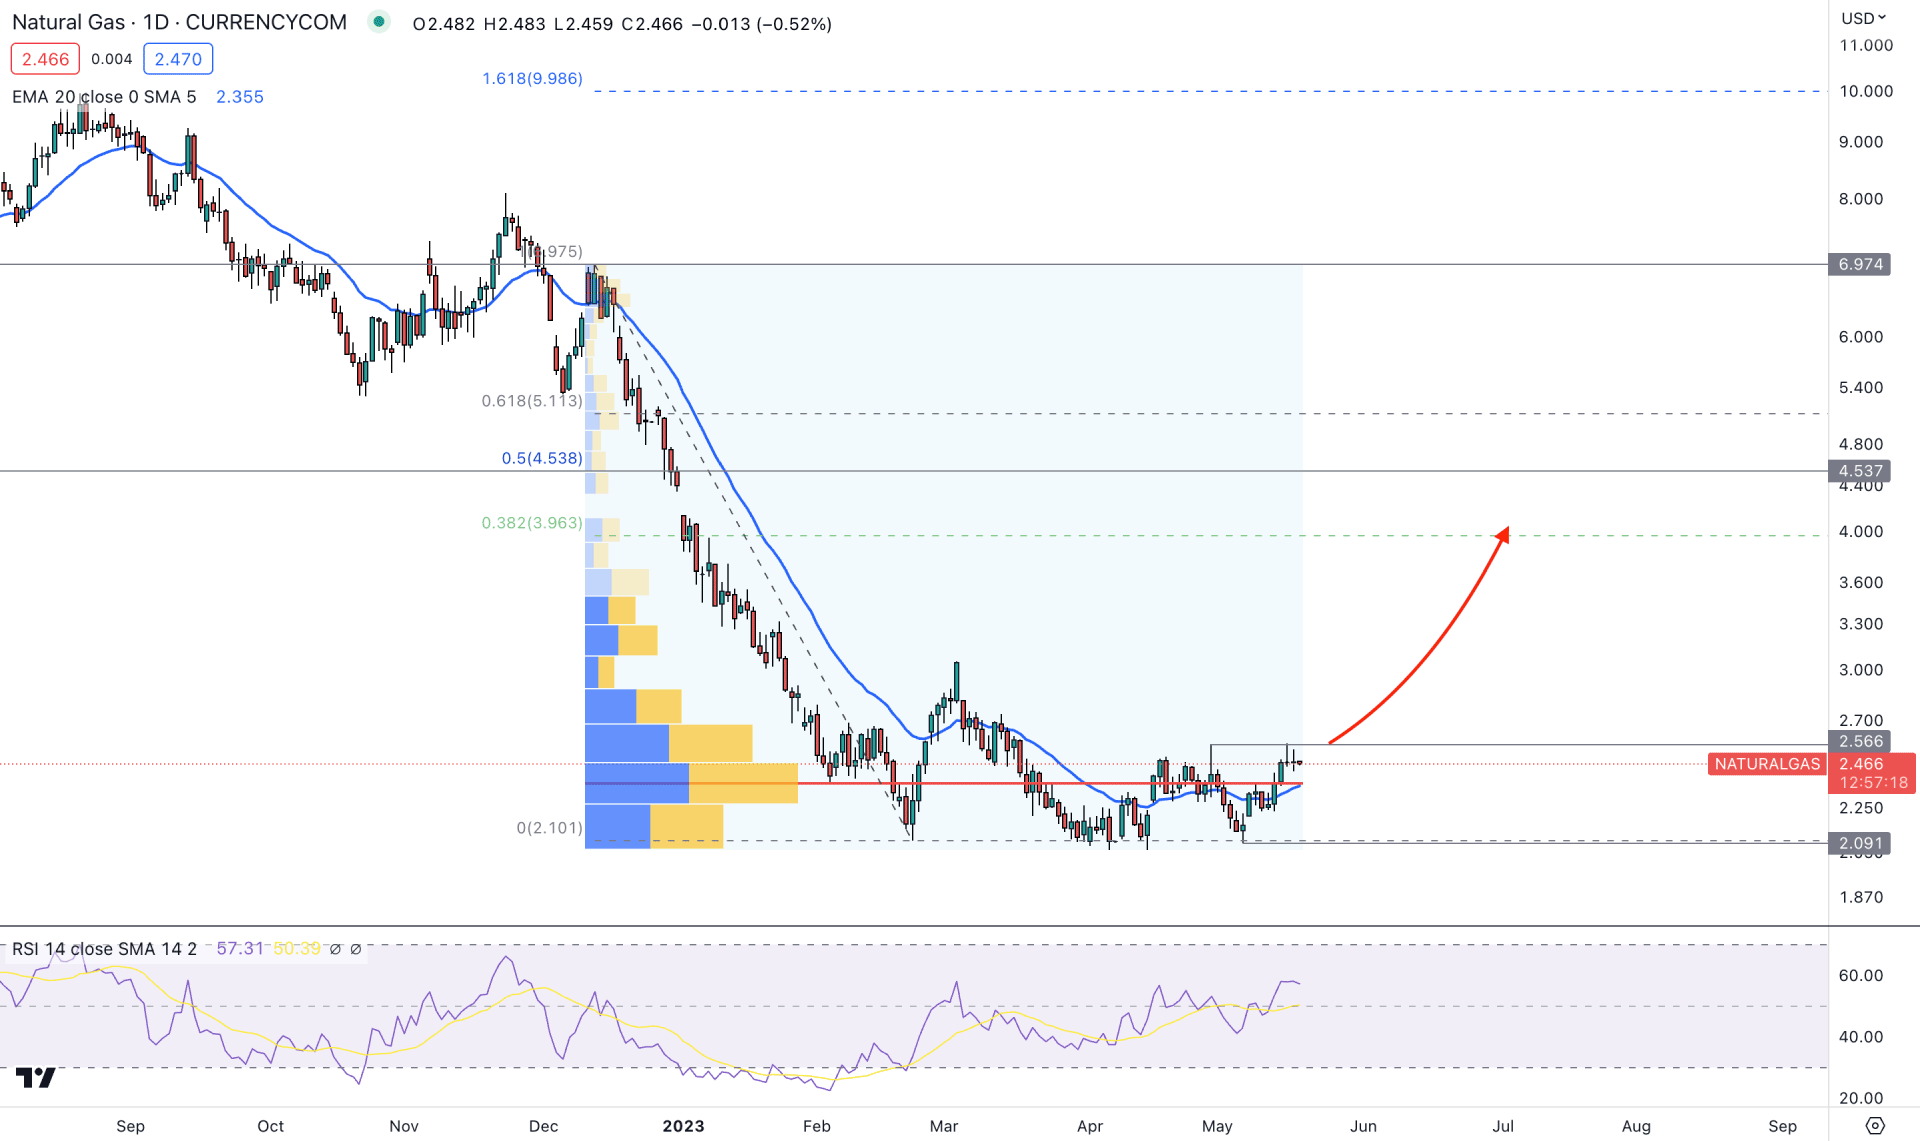
In the daily chart, the natural gas price trades sideways after a strong downward momentum. Also, the latest consolidation is a sign that investors are building orders, which usually happens before a sharp price movement.
In the higher timeframe price action, the upside pressure is supported as the latest monthly chart shows a strong bullish candle in April 2023. The running candle is trying to make a new high with a long wick on the downside.
Coming to the daily price chart- the highest trading volume level since the November 2022 peak is below the current price, which is signaling a buyer's presence in the market. In any consolidation, a bullish break with a big change in volume indicates a sharp price change, and there is no exception for natural gas.
As per the high volume level, the bullish pressure is potent as long as the price trades above the 2.372 level with a daily candle close.
The dynamic 20-day Exponential Moving Average shows an early buy signal as the current price is trading above it. Also, the Relative Strength Index shows an upward pressure, where the primary target is to test the 70% overbought level.
Based on the daily price outlook of Natural Gas, a bullish break above the 2.573 resistance level would create a strong bullish opportunity in this instrument, where the ultimate target is to test the 4.537 key resistance level.
The downside pressure is valid until the bullish break of structure appears, where a downside pressure below the 2.372 high volume level, could extend the bearish momentum in the coming days.
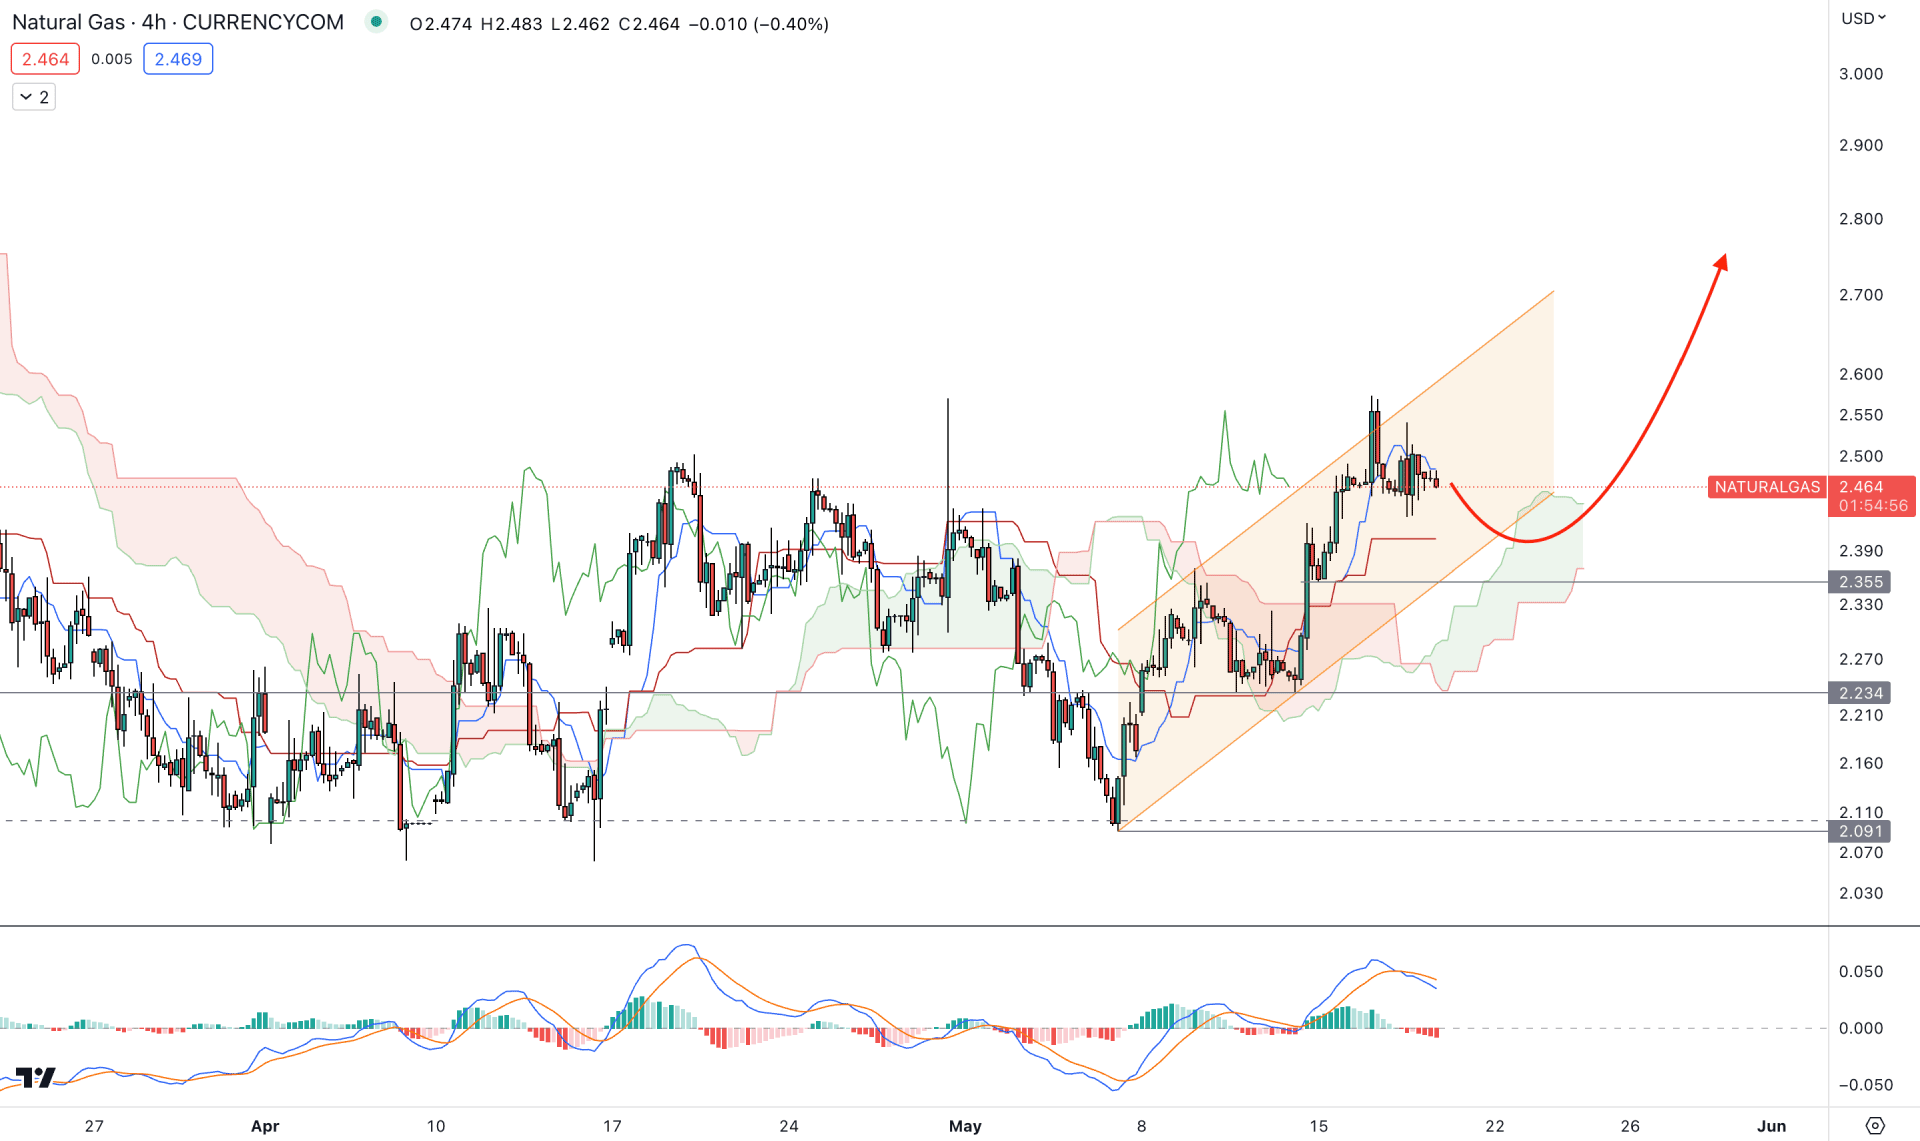
In the H4 timeframe, a bullish trend continuation opportunity is present as the current price trades above the Ichimoku Kumo cloud zone. Moreover, the dynamic Tenkan Sen and Kijun Sen support bulls, which may extend the current range towards the 2.800 level.
In the future cloud, the Senkou Span A is above B; even a bearish MACD Histogram is present in the indicator window.
Based on the H4 structure, bulls may extend the momentum if any strong rejection comes from the dynamic Kijun Sen level. The primary price target of this structure is to test the 2.800 key resistance level.
On the other hand, breaking below the 2.234 level would invalidate the bullish possibility and open room for reaching the 2.000 psychological level.
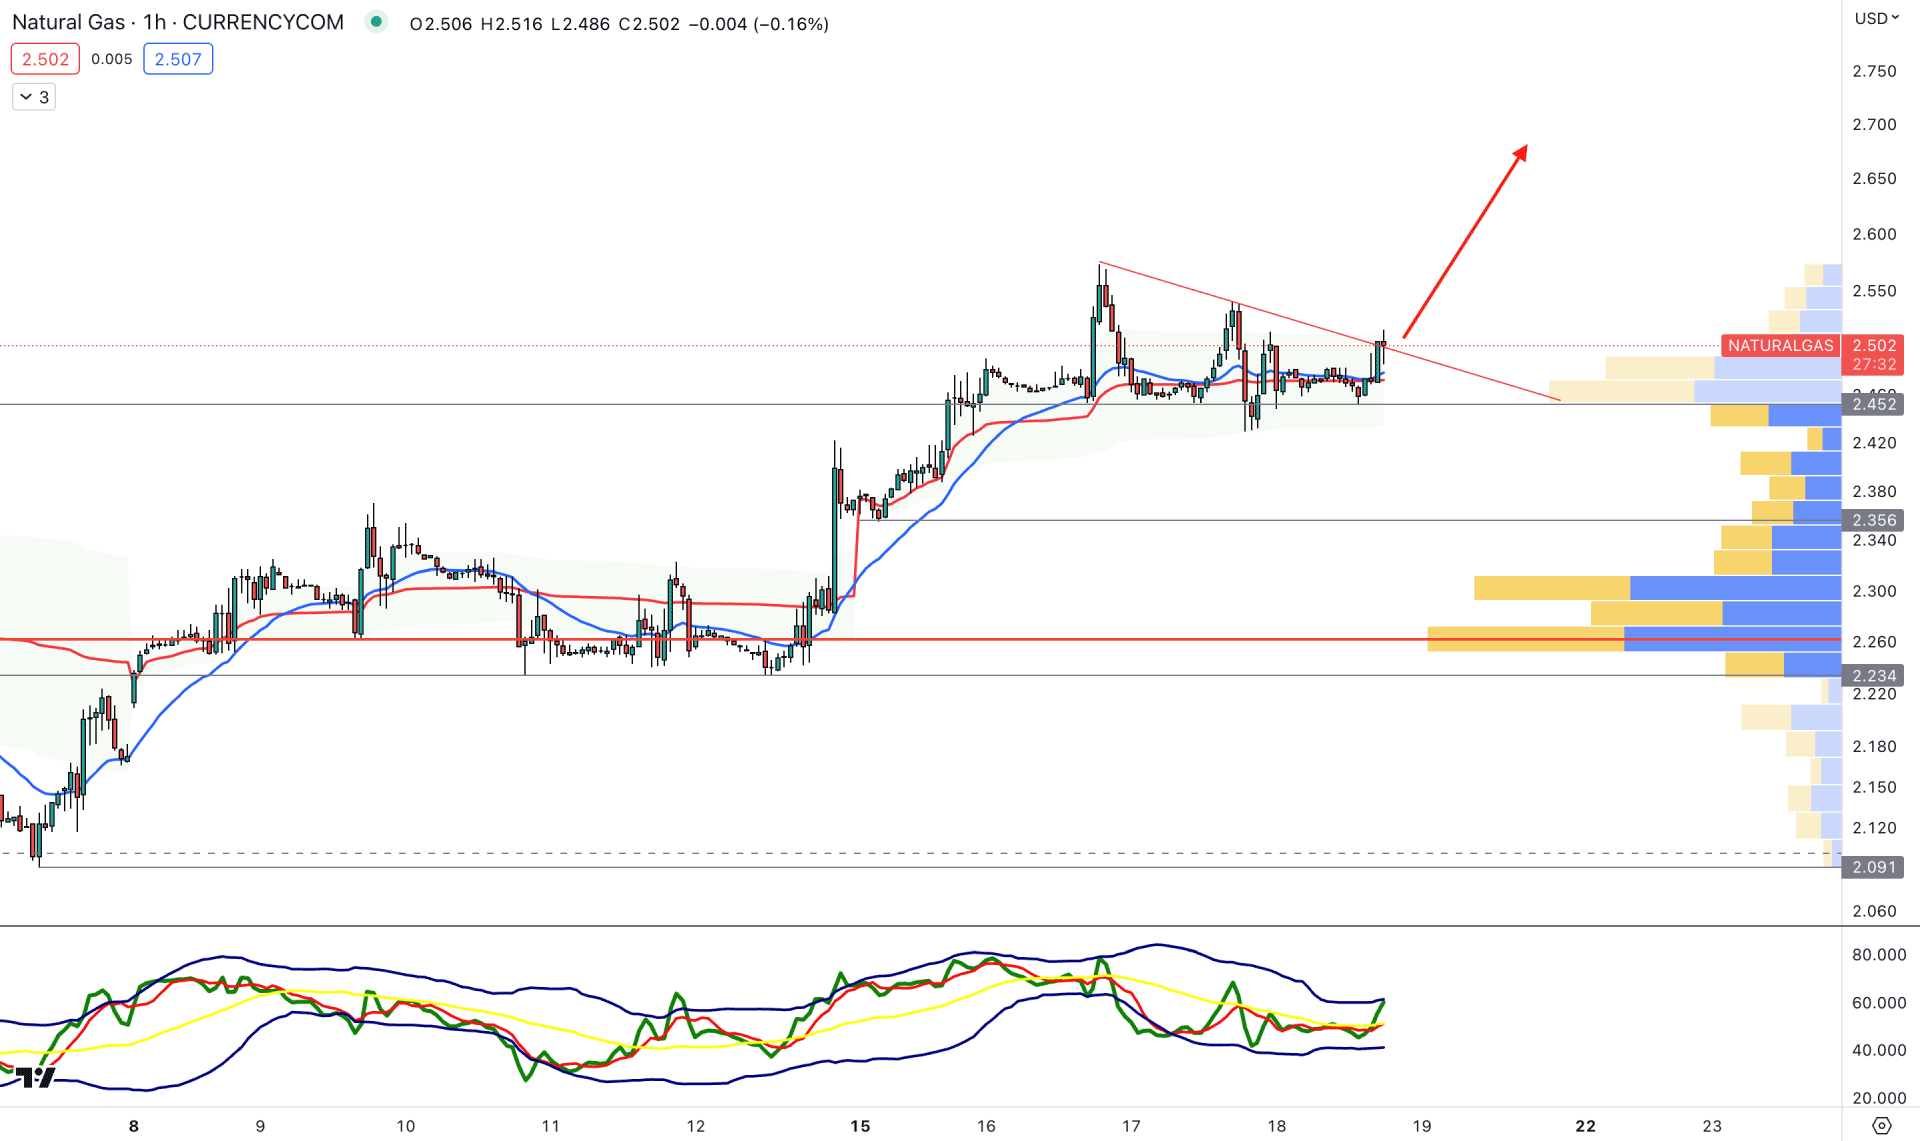
In the hourly chart, a trendline breakout from the current price level could offer an immediate buying opportunity in the Natural Gas (NG) price.
The dynamic 20 EMA and weekly VWAP are closer to the price, working as support levels. Moreover, the visible range high volume level is 10% down from the current price, working as an ultimate barrier to bulls.
Based on this structure, a bullish trend continuation opportunity is present in the H1 chart, where the ultimate target is to test the 2.800 level.
On the other hand, a deeper discount is possible if the H1 candle closes below the 2.450 level, but breaking below the 2.259 high volume level could lower the price in the coming hours.
The investment approach to buy this asset is to focus on loading positions from the current zone as a strong upside pressure towards the 4.80 level could provide at least a 2X return. However, the best approach is to read the price action carefully and open buy orders with a minimal stop loss from near-term support levels.


