
Published: January 8th, 2026
After reaching a multi-month bottom, natural gas contracts are slightly rising at the halfway point. Price activity indicates that position squaring and short-covering are occurring ahead of the U.S. Energy Information Administration (EIA) data release.
As traders expressed some comfort that winter might return to its typical cold-weather patterns, colder nighttime weather forecasts have also contributed to the early gains. Overnight, weather models increased three to ten HDDs. The great news, though, is that forecasts managed to maintain the late January cold.
Natural gas supplies were plentiful as of December 26, with inventories down 1.1% year over year and up 1.7% over their five-year seasonal average.
In contrast to the five-year seasonal norm of 73% complete for this period of the year, the gas reserve in Europe was 60% occupied as of January 4.
Let's see the full outlook from the NG technical analysis:

In the daily chart of NG, the recent price action shows a massive sell-off from the record high, triggered by a significant fundamental event. As the price has now reached a discounted zone, investors may begin positioning for a potential bull run at any time.
On the higher timeframe, the monthly chart suggests strong selling pressure from the 2025 high, forming a bearish engulfing candlestick. However, the price is still trading below the December 2025 low, from where a valid rebound is required before anticipating a bullish continuation. The weekly timeframe also reflects sustained bearish pressure, as the price has declined for four consecutive weeks. Since no significant bottom has formed on the weekly chart, investors may need to wait for further confirmation.
In terms of volume, buyers remain relatively favored, as the largest activity level since April 2025 stands at 3.3967, which is acting as immediate support.
On the main price chart, extended selling pressure has pushed the price below the 200-day SMA, which could be an alarming sign for buyers. A decisive bullish rebound above the 200-day SMA would signal sell-side liquidity sweep from the dynamic support zone.
Moreover, the price is trading below the middle Bollinger Band, while the most recent price action tested the lower Bollinger Band, which is currently acting as strong support.
In the secondary indicator window, the Relative Strength Index (RSI) is hovering below the 50.00 neutral level but has not yet reached the 30.00 oversold zone. A potential bullish divergence is forming, as the price failed to create a new low while the RSI showed relative strength.
Based on the overall market structure, investors may wait for further confirmation of a bullish rebound from the current price area. A bullish daily close above the 200-day SMA could push the price higher toward the middle Bollinger Band. A sustained move above the 4.0000 psychological level could further extend bullish momentum toward the 5.4953 swing high.
On the other hand, failure to maintain buying pressure above the 4.0000 level could pose a challenge for buyers. In that scenario, a bearish daily close below the 3.3967 high-volume level could extend selling pressure toward the 2.6283 support zone.
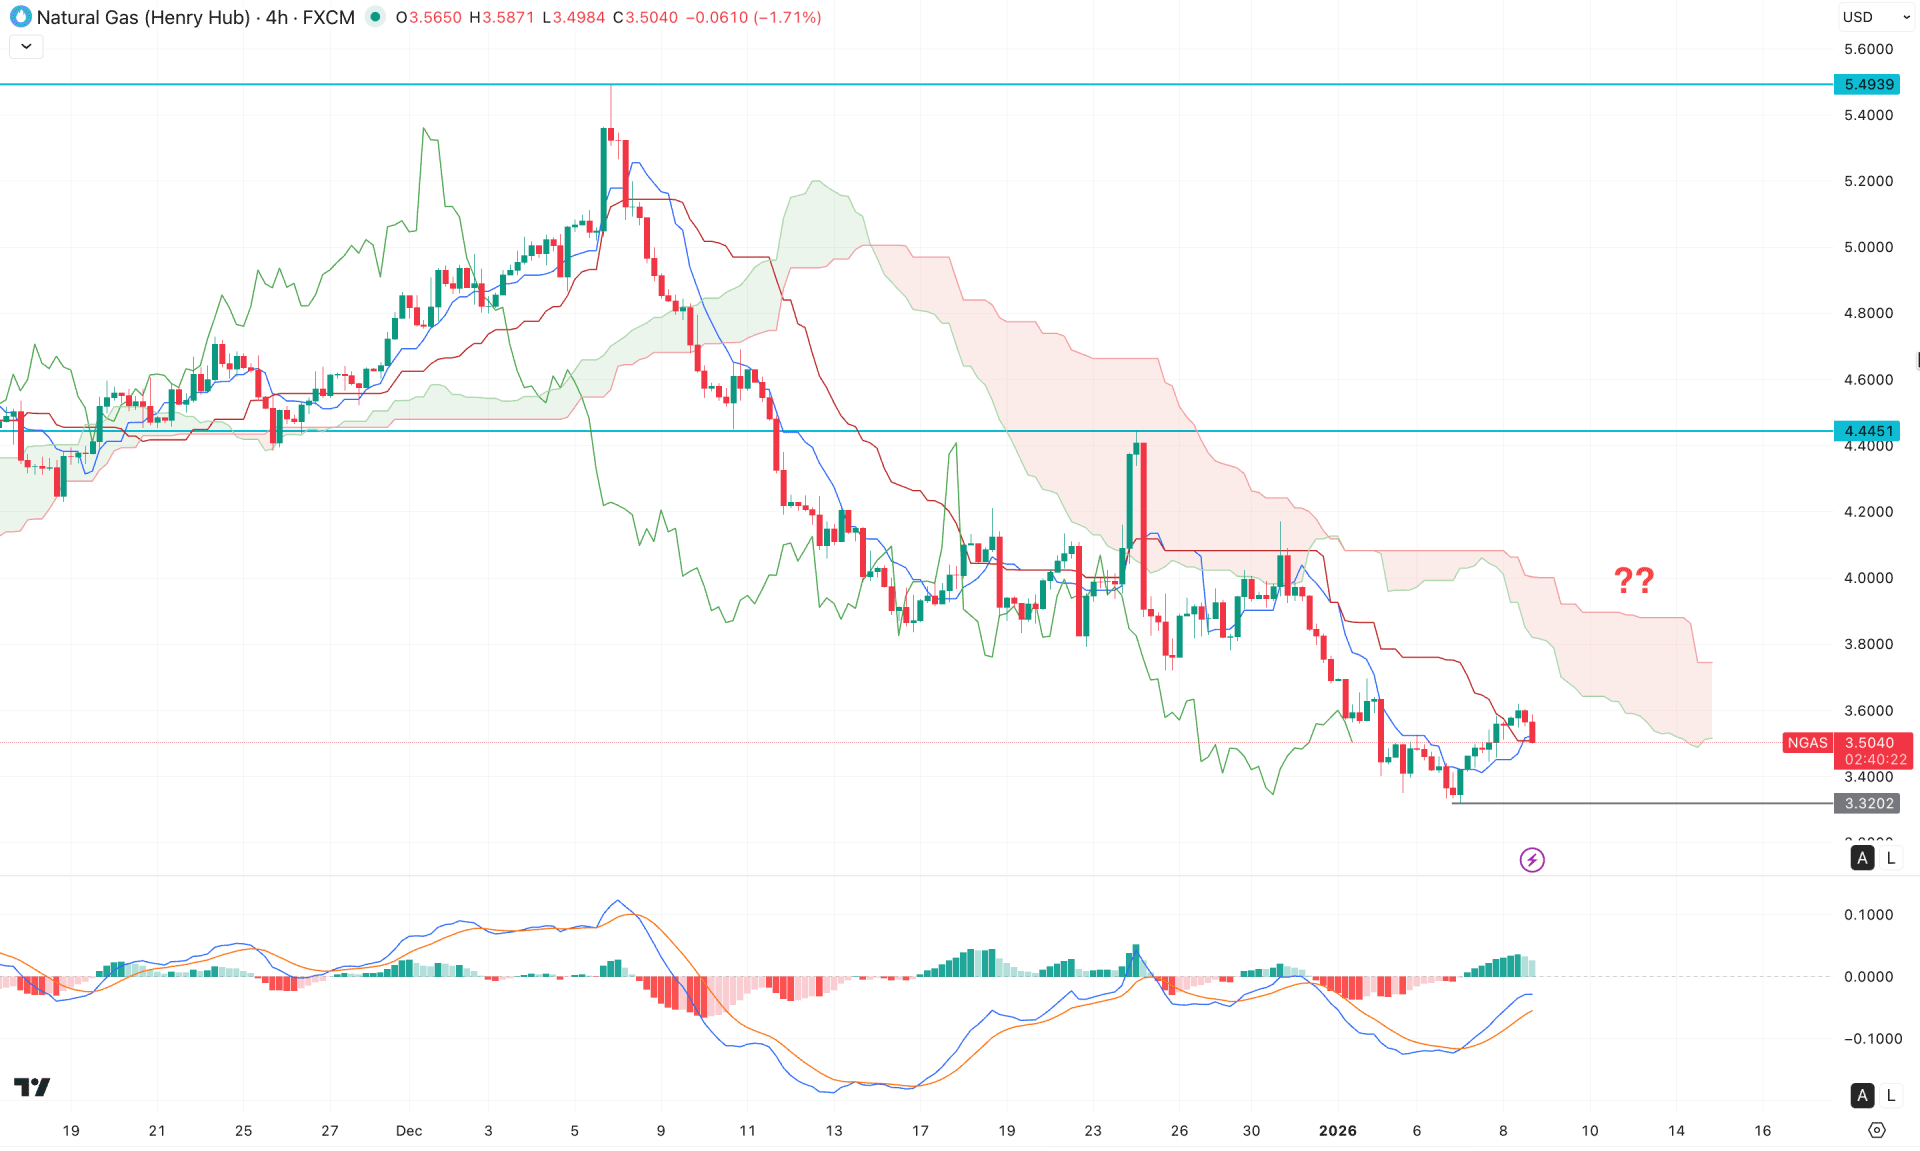
In the H4 chart of NG, ongoing bearish pressure is evident, with the current price hovering below the dynamic Ichimoku Cloud. Moreover, the future cloud appears bearish to bears, as both lines are heading downward.
In the secondary indicator window, the MACD Signal line formed a divergence with the main price swing, where the Histograms are above the neutral line.
Based on the H4 market outlook, an immediate bearish H4 candle below the dynamic Kijun Sen line could indicate a trend-continuation opportunity. In that case, the immediate support to look at is the 3.3202 level.
On the other hand, a bullish recovery with a stable price above the 4.0000 line could increase the bullish rebound possibility. In that case, the price might rise and find resistance at the 4.4451 level.
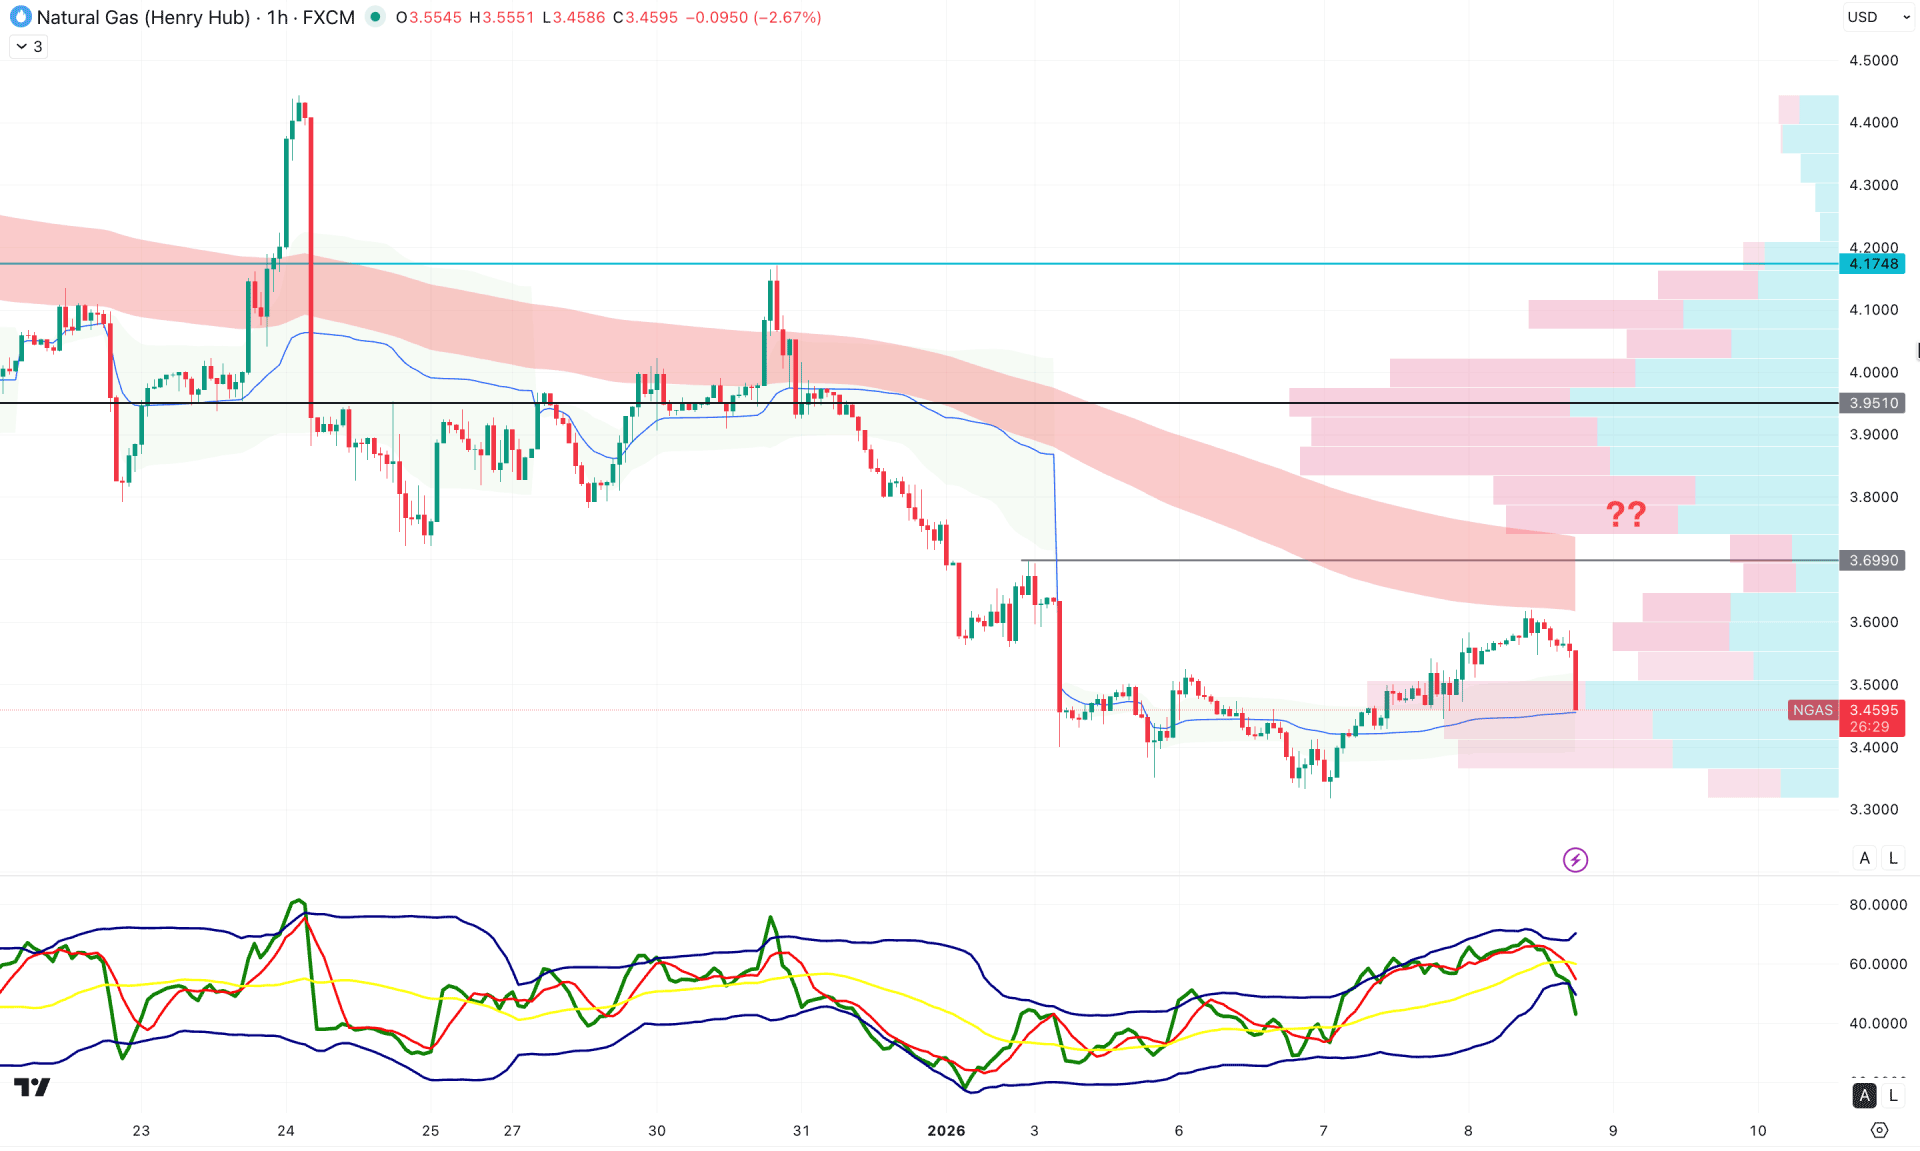
In the hourly timeframe, the recent price is trading bearish below dynamic lines, suggesting an ongoing selling pressure. The Exponential Moving Average wave is above the current price and downward sloping, suggesting significant resistance. On the other hand, the weekly VWAP line is below the current price but remains flat.
In the secondary indicator window, the Traders Dynamic Index (TDI) has fallen below the 50.00 neutral line, indicating selling pressure.
Based on this outlook, a break below the dynamic VWAP line, accompanied by a bearish H1 candle, could present a short opportunity targeting the 3.0000 level.
On the bullish side, extended buying pressure is required; consolidation above the 3.6990 level could increase the likelihood, targeting the 4.1748 level.
Based on the overall market structure, NG is experiencing selling pressure, and more attention is needed before opening a long position. Investors should closely monitor the intraday chart for a valid bottom formation could be an early sign of a bullish rebound.


