
Published: October 28th, 2021
The US equity market moved higher this week with the positive sentiment from earnings swing. Despite all US indices closing well off major highs, the Nasdaq 100 remained stronger and held a bullish momentum near the all-time high level.
The bullish sentiment in the Nasdaq 100 came from the positive results in US major tech companies. Google’s parent company Alphabet reached a record high after a positive Q3 earnings report that beat analysts’ expectations. Microsoft posted quarterly reports that also beat estimations on major metrics.
Outside the mega-cap tech companies, other companies have shown a decent result. Twitter shares gained lately after beating the expectation of Q3 earnings, although there was a negative impact from the iOS privacy update. The chipmaker Advanced Micro Devices also delivered the latest quarterly earnings report that boosted the full-year forecast.
As a result, Nasdaq 100 has several price drivers to rely on a bullish move above the current all-time high level. However, the price structure with a near-term swing breakout makes a strong supply level at the current trading zone, which is a positive sign for bears.
Let’s see the upcoming price direction from the Nasdaq 100 [NAS100] technical analysis:
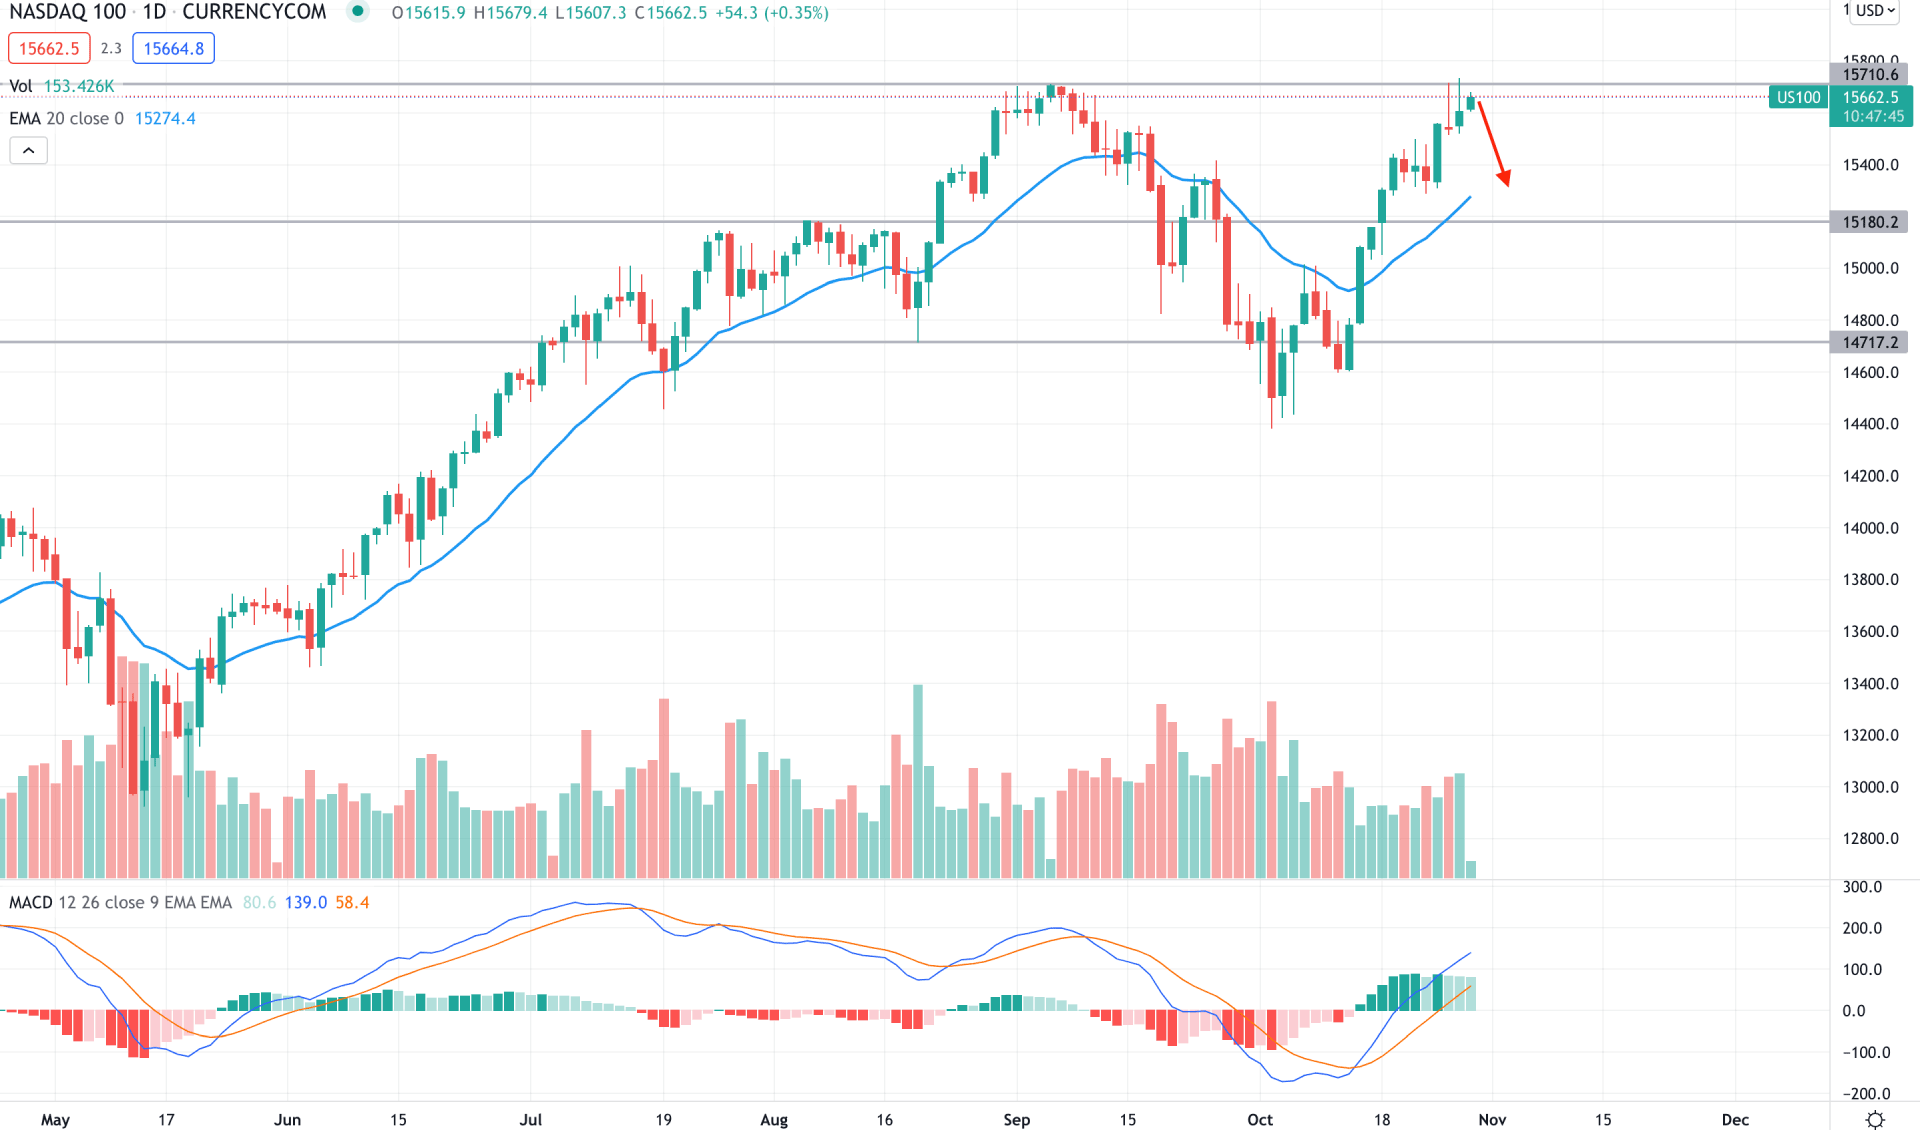
Nasdaq 100 initiated the bullish movement from May 2021 that topped higher and made an all-time high at the 15709.09 level. Later on, the price moved lower below the 14717.20 swing low with a daily bearish close, making the 15715.00- 15600.00 area valid as a supply level. However, the price immediately increased with a bullish daily close above the dynamic 20 EMA that pushed bulls to test the all-time high again.
The above image shows that the price formed multiple long wicked candles at the all-time high area with increased volume. Therefore, investors should closely monitor how the price is trading at 15715.00- 15600.00, where a bearish daily close may initiate a strong bearish trend. MACD Histogram remained corrective in the indicator window while the gap between the dynamic 20 EMA and price expanded.
Based on the daily context, Nasdaq 100 needs a bearish daily close below the 15500.00 level to initiate a strong selling pressure towards the 14717.20 level. On the other hand, any bullish daily close above the all-time high level will open room for further gains above the 16500.00 level.
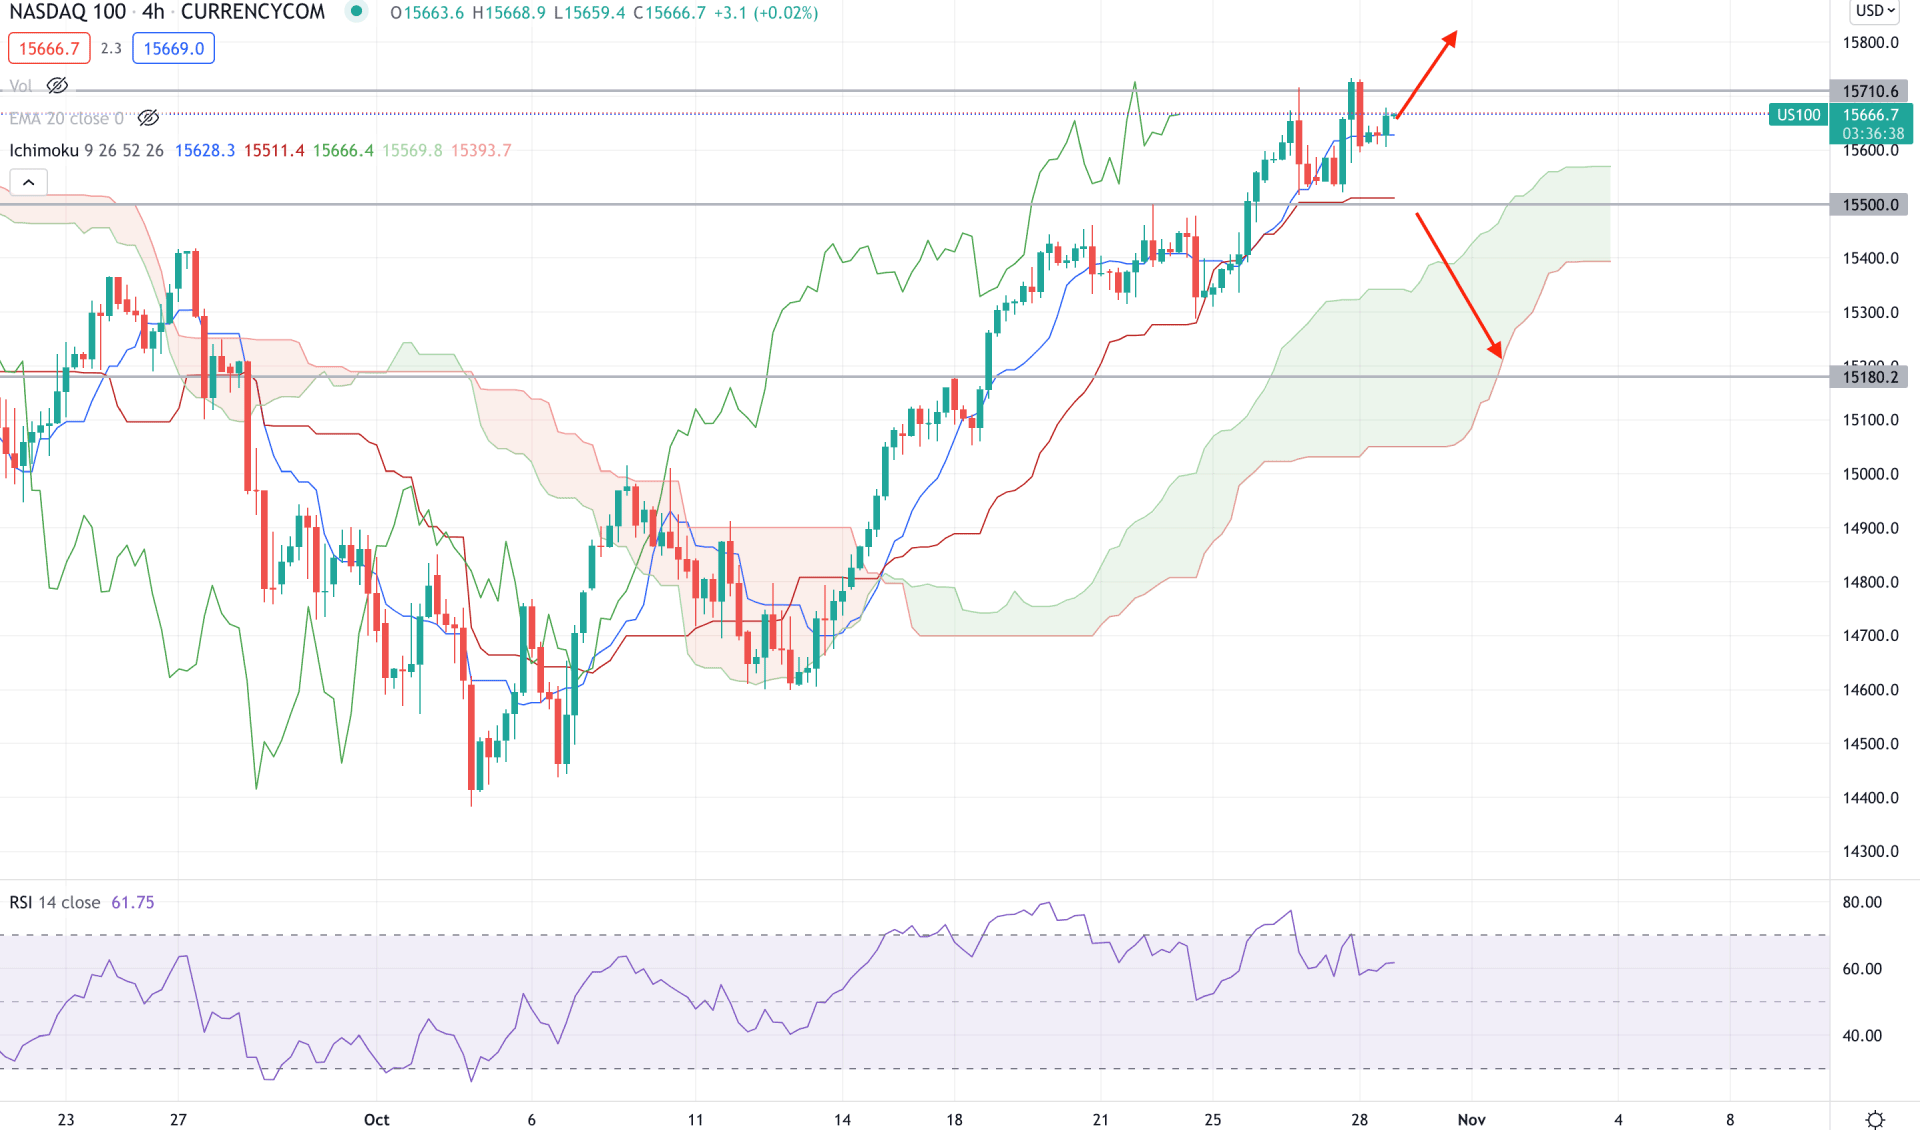
According to the Ichimoku Kinko Hyo, Nasdaq 100 changed the trend from bearish to bullish after moving above the Kumo Cloud on 15 October. Later on, the price increased higher without any bearish correction and reached the 15710.00 key resistance level. The most recent price is above the Kumo Cloud, where the future cloud became flat. Meanwhile, the RSI line is moving lower from the overbought 70 levels with a possibility of a bearish pressure towards the 30 areas.
The above image shows that the price is trading above the dynamic Kijun Sen where the Tenkan Sen is working as immediate support. Therefore, if the short bulls help the price close the H4 candle above the 15710.00 level, it may continue the bullish pressure. On the other hand, bears should find a bearish H4 close below the dynamic Kijun Sen and static 15500.00 level to rely on an upcoming bearish pressure.
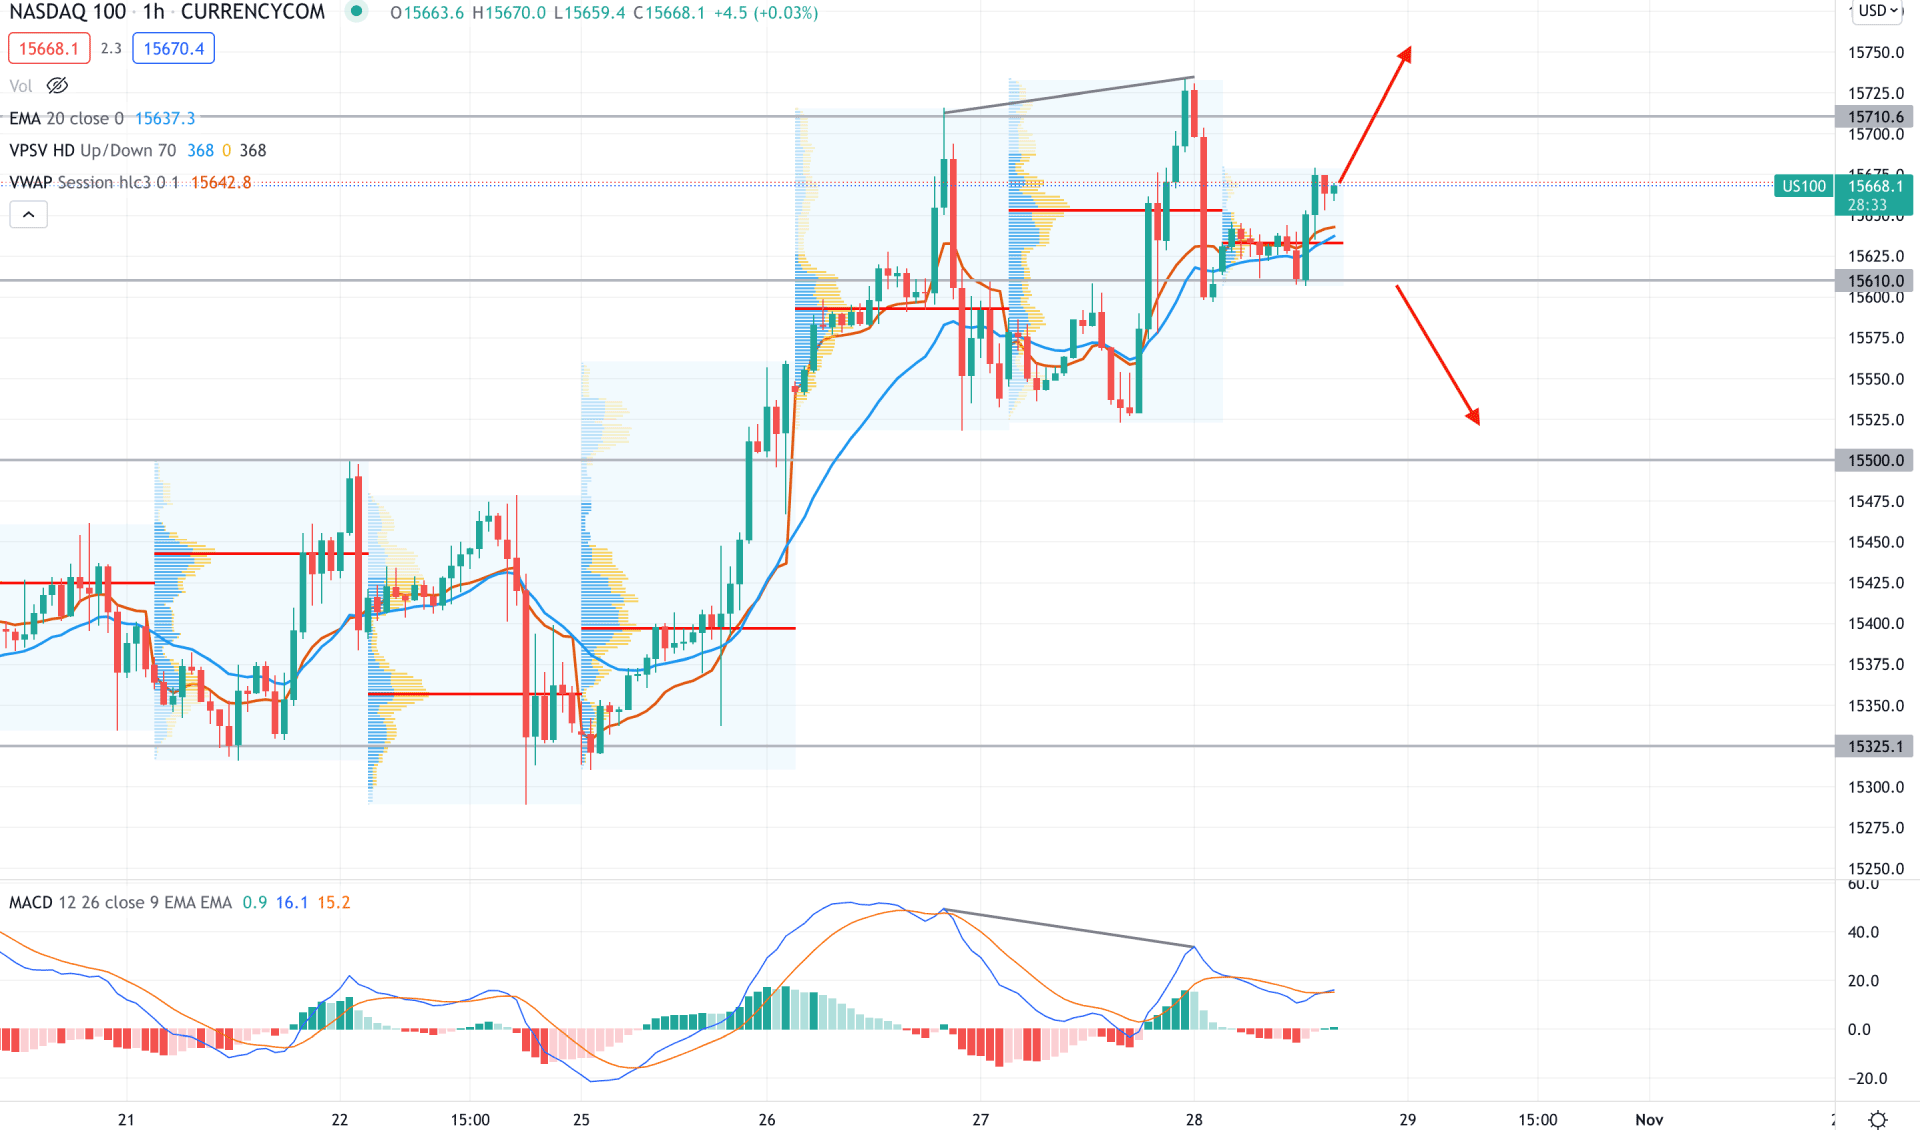
There are signs of sellers’ presence in the intraday chart as the price became volatile with new swings. Moreover, the regular divergence with the MACD Histogram made the bearish possibility more potent. However, the current price is still above the dynamic 20 EMA and intraday high volume level of 15632.20, from where a bullish pressure may appear.
The indicator window shows that the MACD Histogram formed a bearish NPN formation with a regular divergence. Therefore, investors should wait for the price to come below the 15610.00 level with a bearish H1 close to making the current divergence valid. In that case, the price may come lower and test the 15325.10 level in the coming hours. On the other hand, a bullish H1 close above the 15710.00 level may increase the price towards the 1700.00 area.
As per the current market condition, Nasdaq 100 is more likely to extend the current bullish pressure followed by a better result in tech stocks. On the other hand, any bearish daily close below the 15500.00 level may invalidate the current sentiment and lower the price towards the 14717.20 level.


