Published: March 13th, 2025
US equities rose Wednesday as an increase of the United States President Donald Trump's disorganized, multifront trade war restrained gains. At the same time, lower-than-expected inflation figures helped halt a steep selloff.
According to the Labor Department's Consumer Price Index, consumer prices cooled more than analysts had anticipated, which gave confidence that inflation is on the right track and maintained expectations that the American Federal Reserve may lower its key interest rate this year.
Canada and Europe increased their taxes on American exports in response to Trump's 25% charges on foreign steel and aluminum, his most recent tariff volley.
The intensifying tit-for-tat tariff conflicts between the US and its suppliers have pressured U.S. stocks, making investors uneasy and raising concerns that the ensuing price shocks could send the US, Canada, and Mexico into an economic downturn.
In contrast to the average of 16.59 billion shares for the entire session during the previous 20 days of trading, the total amount traded on American stock exchanges was 16.14 billion.
Can the Nasdaq 100 benefit from the Post-inflation sentiment? Let's see the further outlook from the NDX technical analysis:
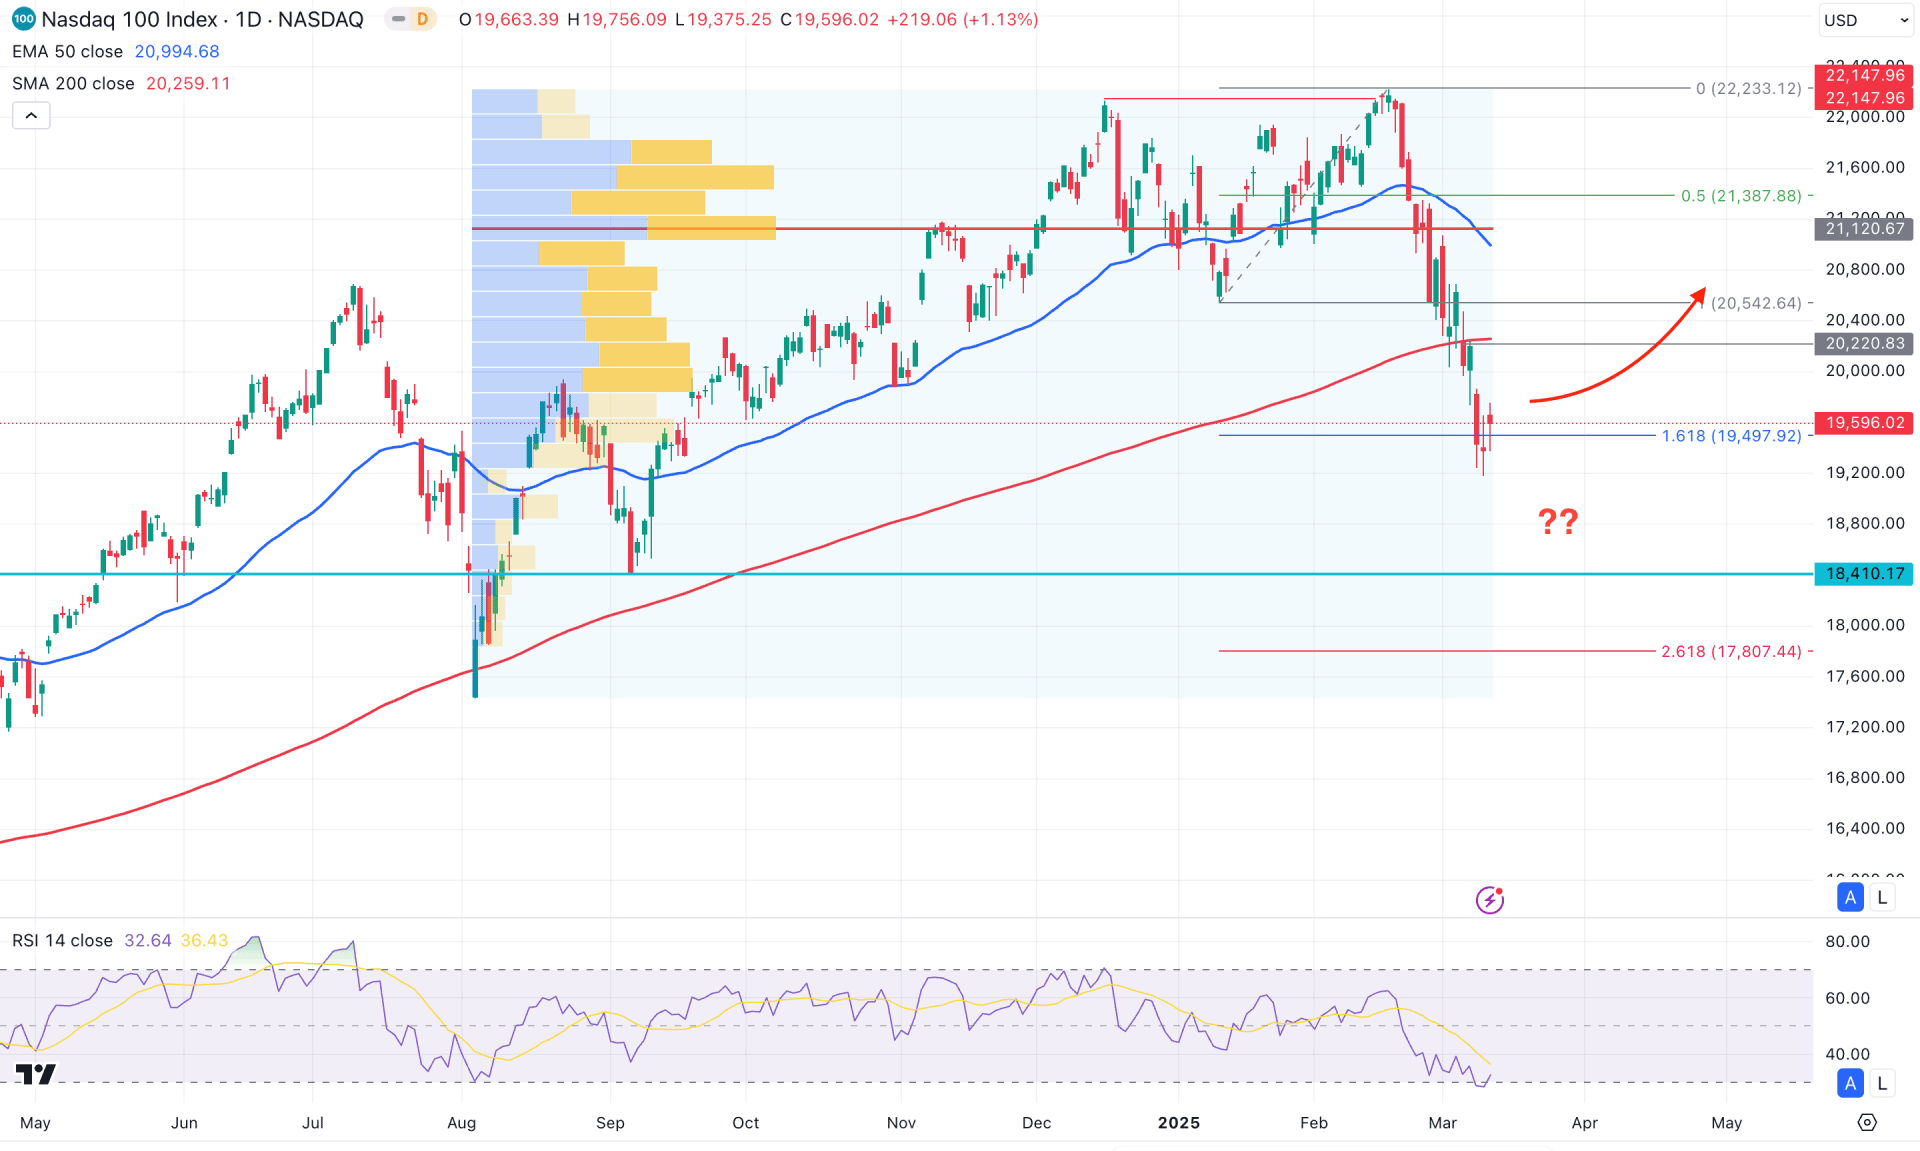
In the NASDAQ 100 daily chart, extended selling pressure is visible from the all-time high area, which came with a valid buy-side liquidity sweep. Moreover, the selling pressure pushed the price below multiple dynamic levels, signaling a challenging factor for the bulls. In this case, investors should monitor how the price reacts after forming a bottom before anticipating future price movement.
In the monthly time frame, an inverted hammer candlestick was formed in February 2025, grabbing the buy-liquidity from a new all-time high. Later, the price extended lower and created a new swing low after six months. On the other hand, selling pressure for four consecutive weeks is seen after becoming sideways.
In the volume structure, the selling pressure is potent as the most active level from April 2024 is above the current price. The selling pressure from the old high came with counter-bearish momentum, signaling a valid bearish continuation opportunity.
In the main price chart, the price has moved below the 200-day Simple Moving Average and has remained below it for multiple days. At the current price level, the 50-day Exponential Moving Average is still above the 200-day Moving Average, signaling a potential upward correction, which could extend the current trend.
On the other hand, the Relative Strength Index (RSI) formed a bottom at the 30.00 level, from where a bullish recovery emerged.
Based on this outlook, a potential bullish correction is expected in this instrument after forming a valid bottom. The price has already reached the 161.8% Fibonacci Extension level, from where a bullish recovery is possible. In that case, a daily candle above the 20,220.83 level could be a potential long opportunity, aiming for the 21,387.88 level. However, more confirmation is needed from a consolidation above the 21,000.00 psychological level before continuing the long-term bullish trend.
On the other hand, any sharp bearish reversal from the 200-day Simple Moving Average line would signal a pending downside correction below the 19,000.00 level.
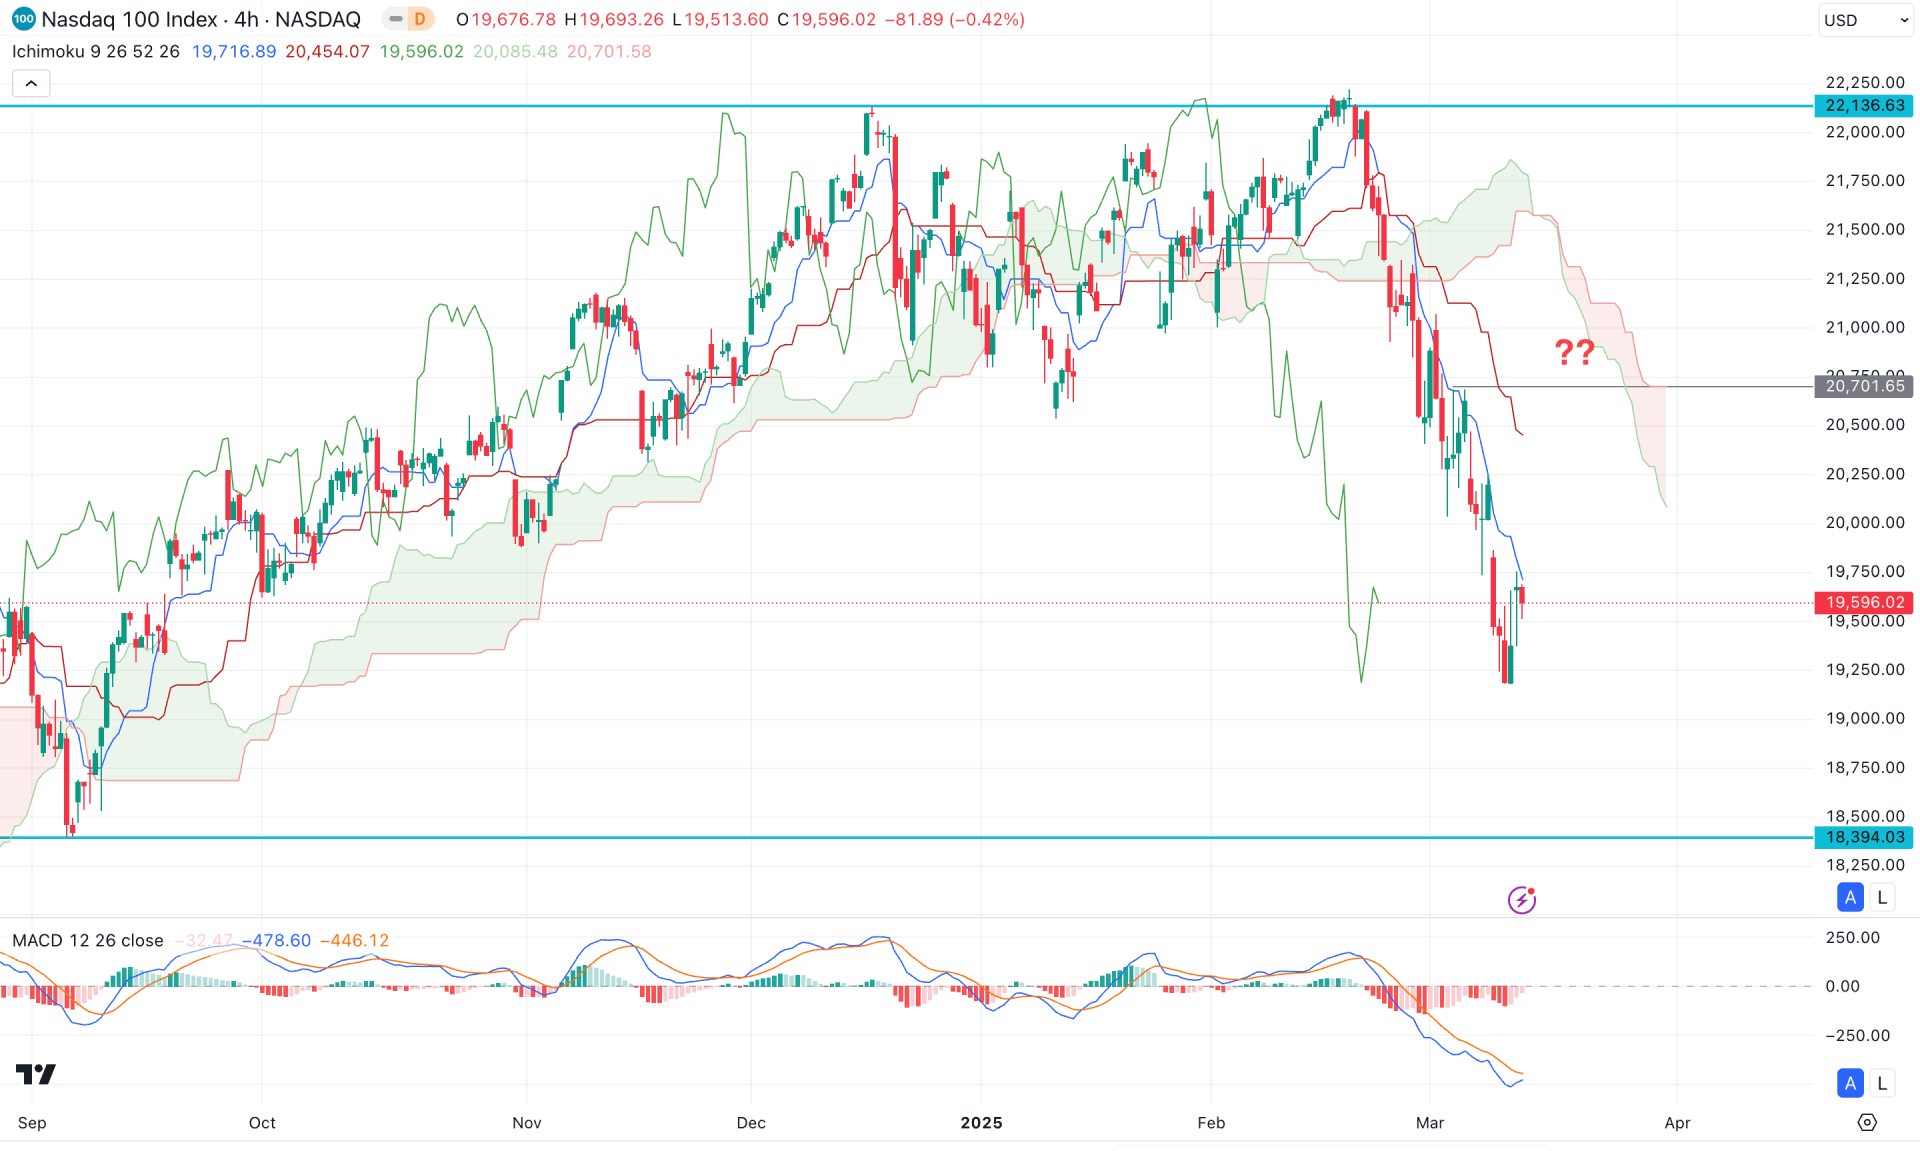
In the NASDAQ 100 H4 chart, the recent price shows lower activity above the Kumo cloud area, followed by a higher and immediate bearish reversal. As a result, the price moved below the dynamic 10-son and kids' send levels, with no signs of a bullish recovery.
In the indicator window, the signal line has reached the lowest level in six months, while the histogram has rebounded and reached the neutral point. In this case, a bullish crossover in the signal line with a positive histogram could signal a possible bottom formation.
Based on this outlook, a minor pullback is expected in this instrument. Any selling pressure from the 20,400.00–22,100.00 area could resume the bearish trend towards the 18,394.03 level. On the other hand, a short-term trading idea would be to look for an H4 candle above the Kijun Sen line, which could push the price towards the 20,400.00 level. However, a complete bullish recovery would require a valid cloud breakout with a stable market above the 21,200.00 level. In that case, the price would extend the existing trend and potentially create a new all-time high.
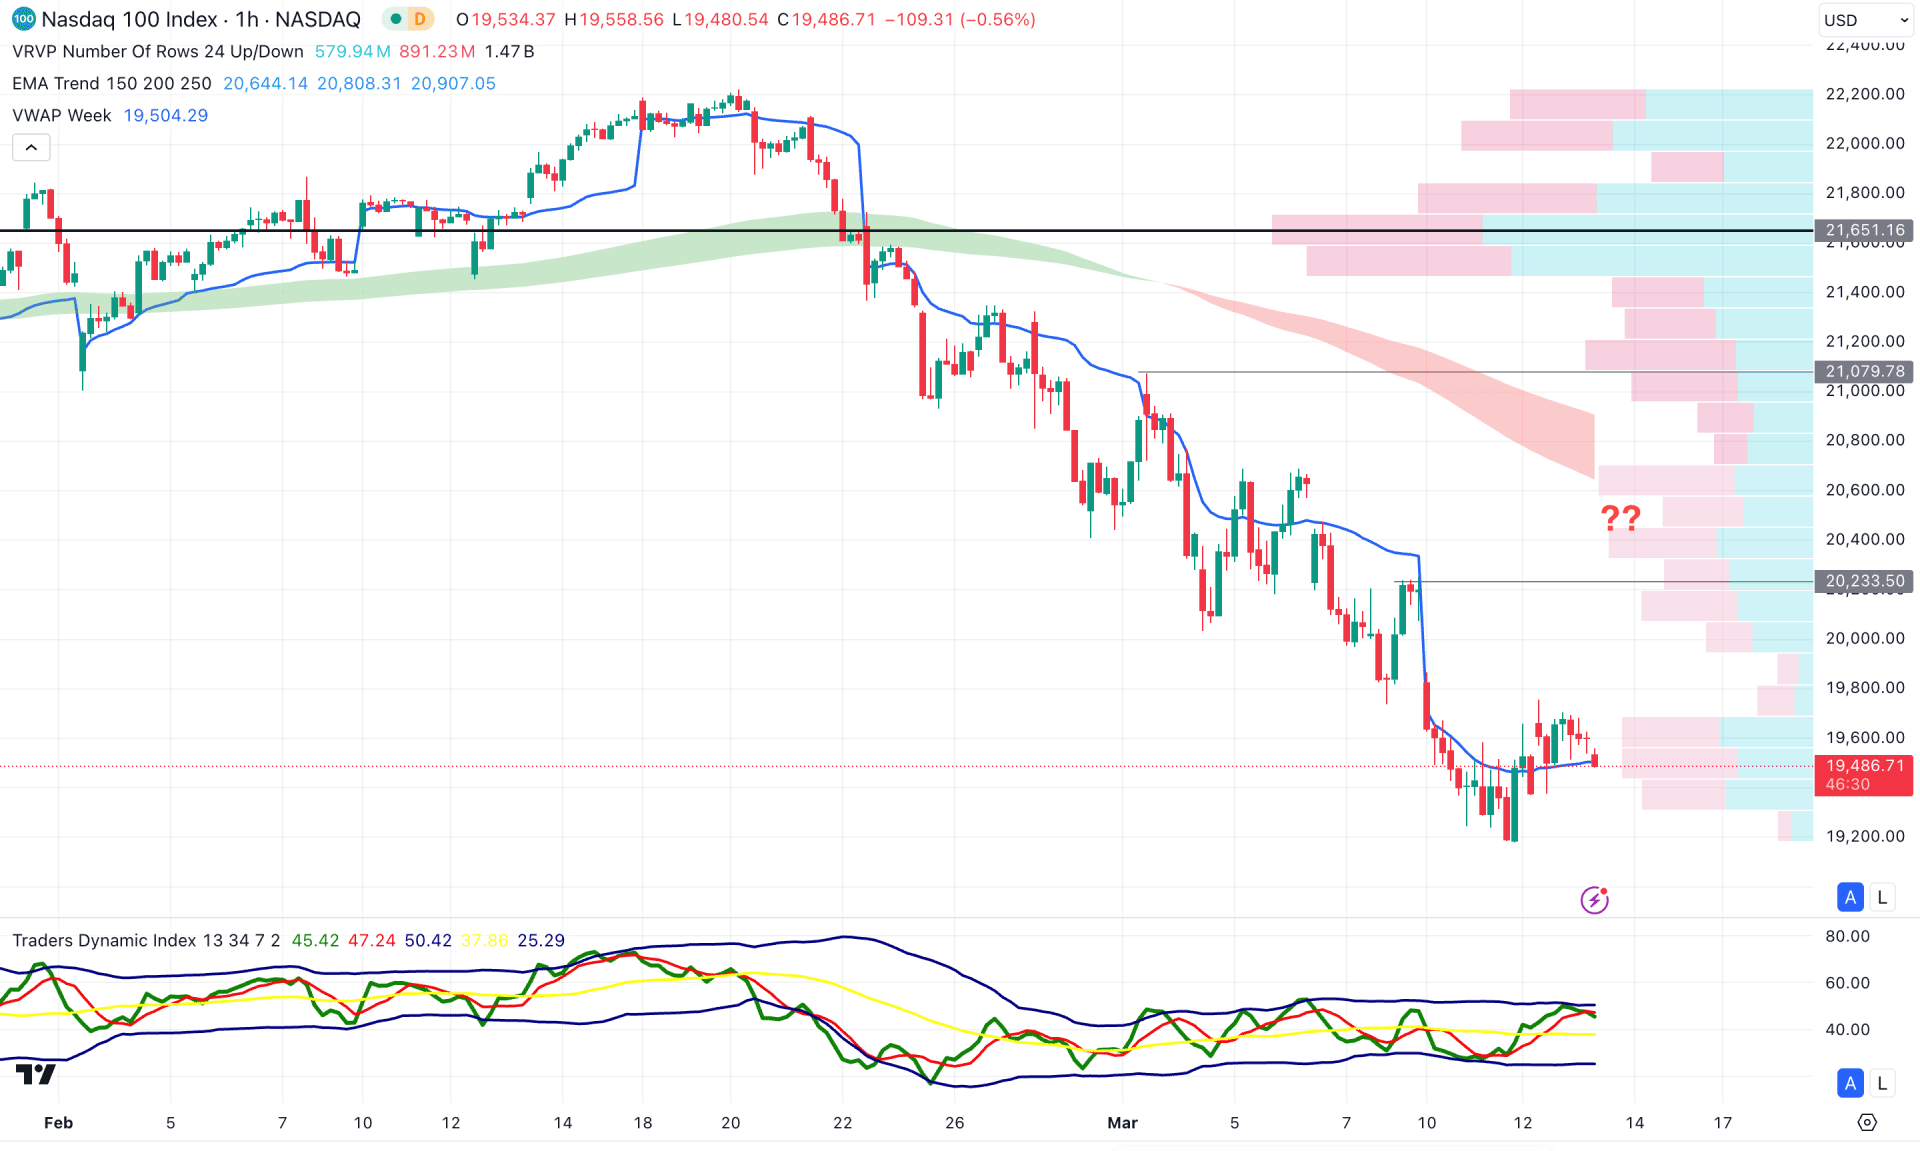
The ongoing market trend in the hourly time frame is bearish. The high volume level is 11% above the current price, from which selling pressure has come with multiple supply zone formations.
In this case, the short-term trading opportunity is to look for a downside continuation after sufficient buy-side liquidity. In this scenario, if the 19,750.00 level is breached with a valid bearish reversal, it could increase the downside possibility, targeting the 19,200.00–19,000.00 level.
On the other hand, an extended bullish pressure with consolidation above the 20,500.00 level could push the bullish pressure beyond the 21,651.16 high-volume level.
Based on the current market structure, the NASDAQ 100 trades within a crucial discounted zone, making it an attractive entry point for long-term investors and HODLers. Therefore, a potential bullish reversal in the intraday price with a slight correction is needed before activating the long-term bull run.


