Published: January 28th, 2025
The low-cost AI model from China shook the US stock market, taking the Nasdaq 100 lower from the crucial top.
The AI leader Nvidia Corp (NVDA) was the hurt heater, erasing almost $539 billion from its market value. According to LSEG data, this was the highest one-day loss ever for any listed company.
DeepSeek, a Chinese business, has released a free AI helper that uses less data and more affordable hardware. This development seriously challenges investor beliefs that AI will boost demand throughout the whole supply chain, from chipmakers to data centers.
By Monday, the Apple App Store had seen a surge in downloads of DeepSeek's AI Assistant, which had overtaken ChatGPT, a rival in the United States.
According to Kim Forrest, chief investment officer of a prominent investment firm, many questions remain about the DeepSeek concept and its possible effects on the market.
The stock market increased greatly in 2024, largely due to the euphoria surrounding AI developments and the impressive performances of Nvidia and other key technology stocks.
Let's see how the Nasdaq 100 performs from the NDX technical analysis:
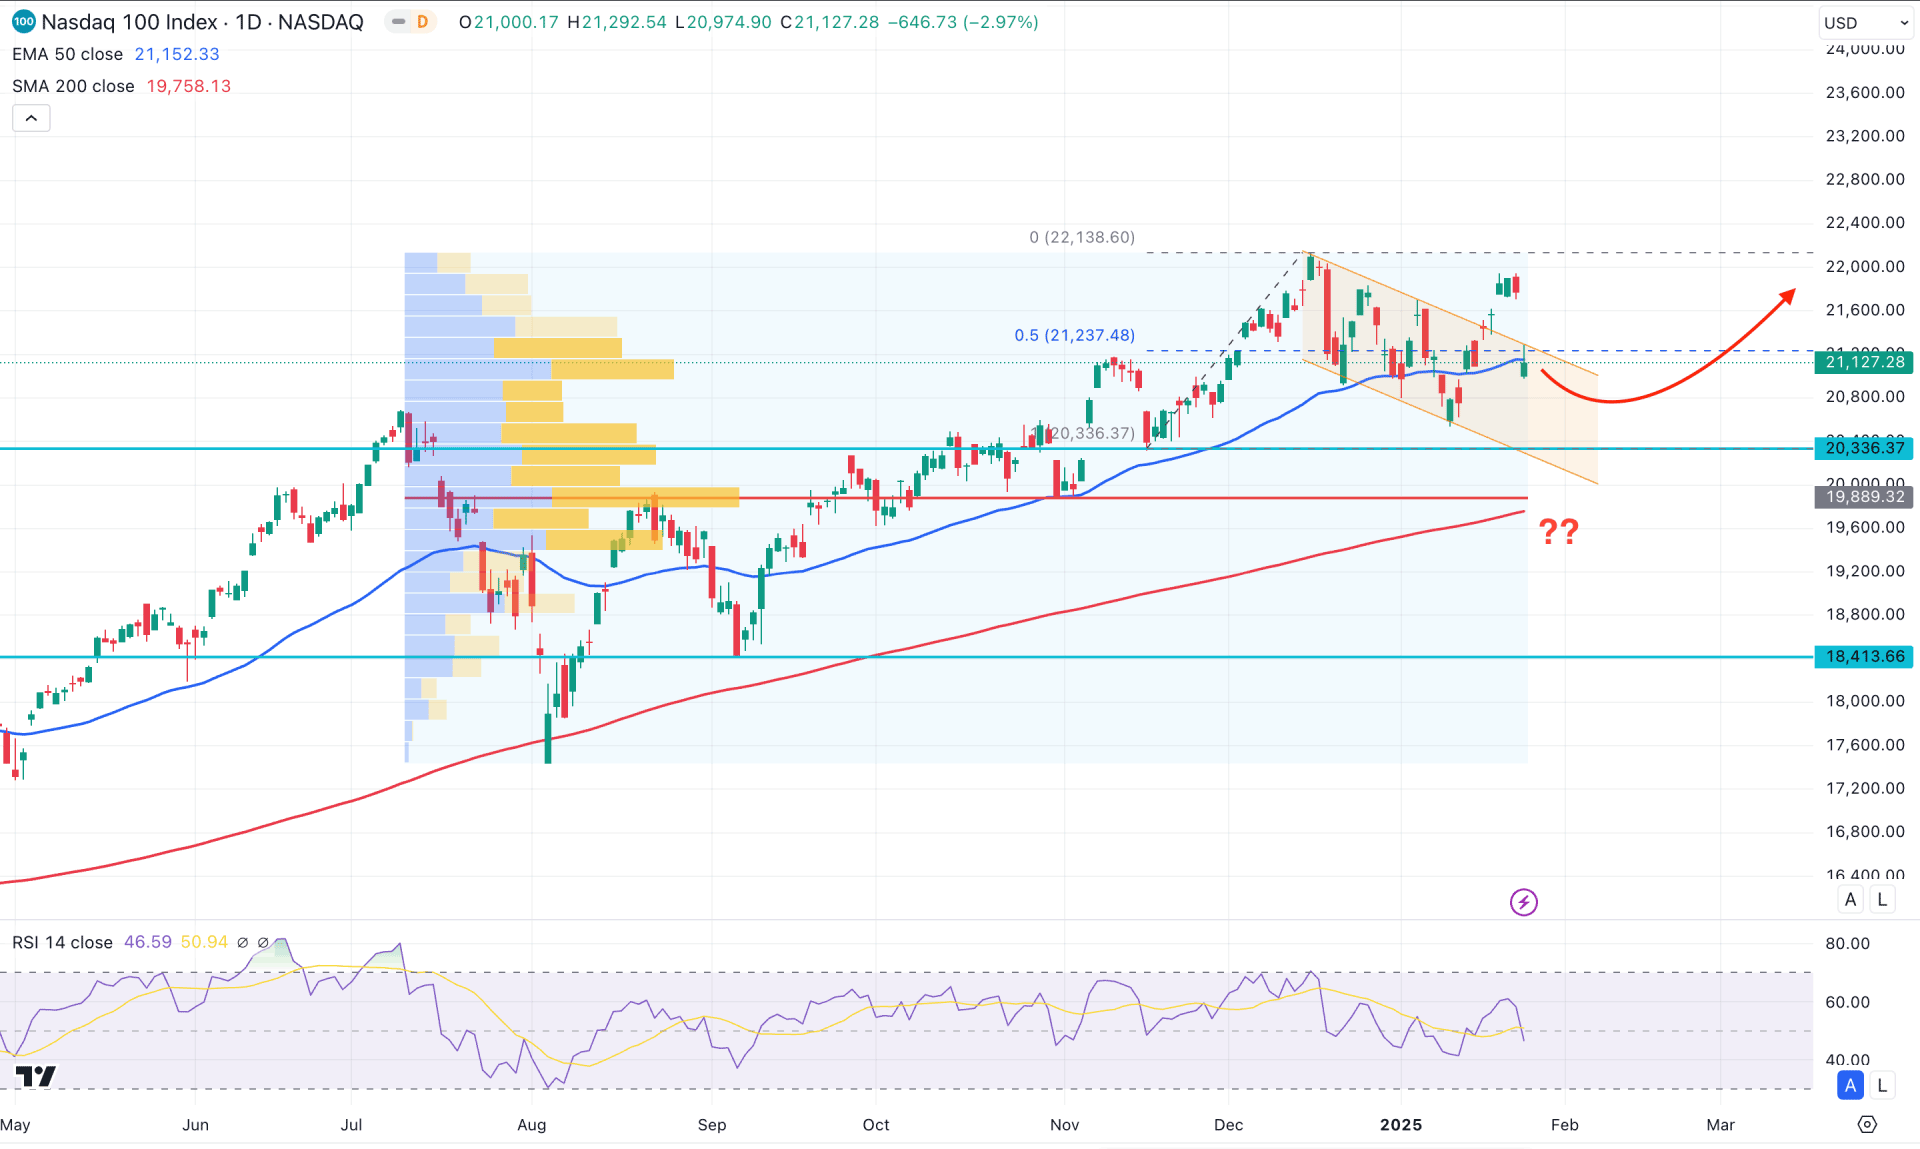
In the daily chart of NDX, the prolonged market momentum is bullish, with no sign of a valid market reversal. In the tradable range, the recent descending channel formation is within the discounted zone from the 20334.37 low to the 22138.22 high. As long as the swing low of this range is protected, investors might expect a bullish reversal as a major trend continuation.
In the monthly pattern, the December 2024 close came as a gravestone Dozi candle, suggesting a sideways momentum. Moreover, the corrective movement in January shows no significant price movement as it is still trading as a long-legged doji formation. As the major market momentum is bullish, a bullish breakout from the January 2024 high could be a probable long opportunity.
In the volume structure, the most active level since July 2024 is at the 19889.32 level, which is below the current price. As long as the current price hovers above the high volume line, we may expect a bullish continuation supported by institutional investors.
In the main price chart, the 200-day Simple Moving Average is rising and working as a major support, while the 50 day EMA is acting as an immediate support.
In the indicator window, the 14-day Relative Strength Index (RSI) maintained a corrective pressure for more than 6 months. In the most recent time, the current RSI level has hovered below the 50.00 line, suggesting corrective pressure.
Based on the daily outlook of NDX, the recent selling pressure took the price within the descending channel. In that case, the bullish possibility is valid as long as the channel support is protected. In that case, a bullish rebound above the 50-day EMA could be the first sign of a long signal, aiming for the 22138.20 high.
On the other hand, an extended selling pressure below the 20336.17 low could be a new lower low in the current context. A consolidation below this area could extend the selling pressure toward the 200-day SMA level before forming a long setup.
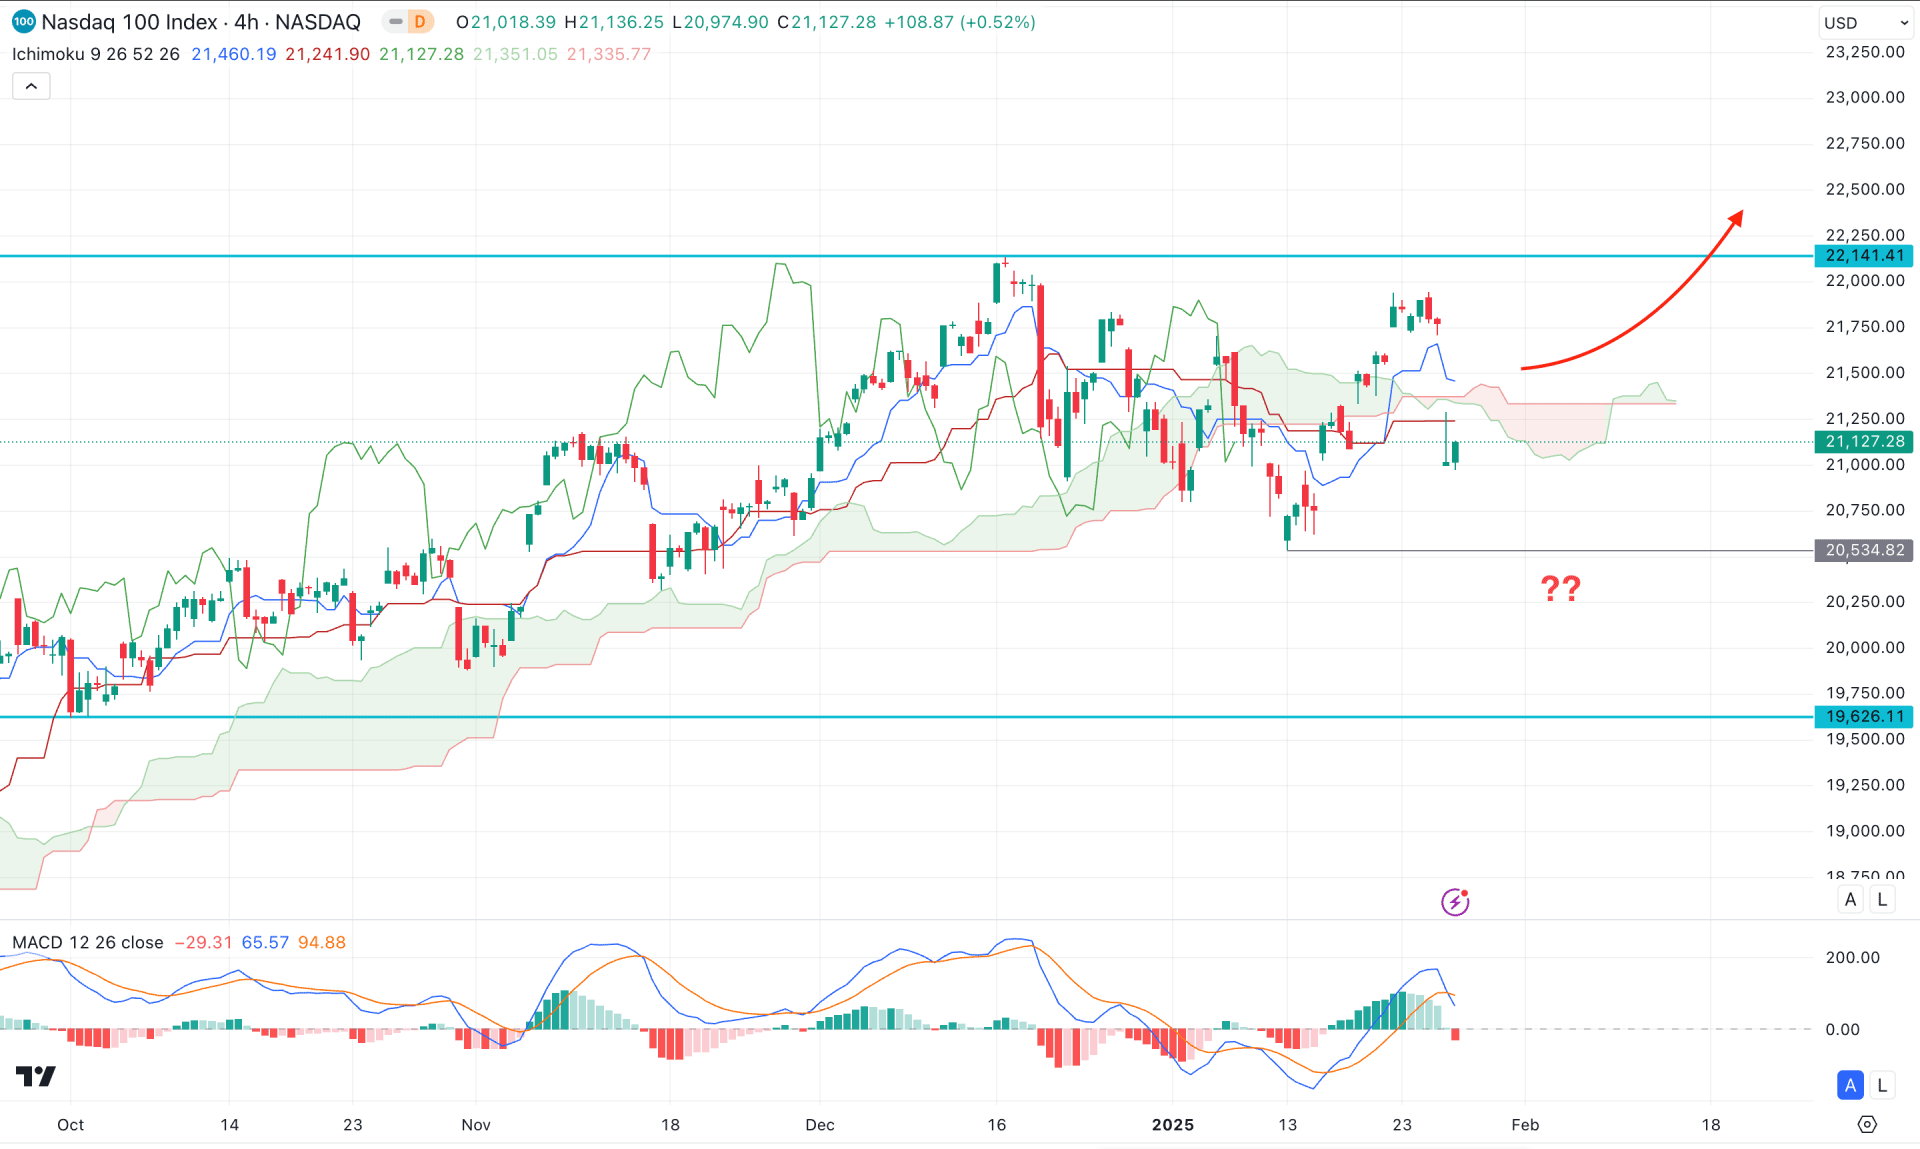
In the H4 timeframe, the recent price showed a bearish reversal below the Ichimoku Cloud level, followed by a CHoCH formation. However, the 20534.82 low is still untouched, suggesting an indecision. Primarily, a swing low below the 20534.82 level is needed to consider a bearish Break-of-structure, which could signal a high probability of a bearish opportunity.
In the Ichimoku Cloud, the Dynamic Tenkan Sen and Kijun Sen are above the current price, suggesting a selling pressure. However, the Future Cloud is still corrective as dynamic lines are closer together.
In the indicator window, a bearish MACD Histogram came after multiple positive vertical lines, which is a primary bearish signal. Moreover, a bearish crossover is formed in the MACD Signal line, suggesting an additional bearish pressure.
Based on this outlook, a bearish trend extension is possible as long as the price remains below the Ichimoku Cloud zone. On the bearish side, the immediate support is at the 20534.82 level, which needs to break before reaching the 20000.00 psychological level.
On the other hand, overcoming the dynamic Kijun Sen support with a bullish H4 candle could be a challenging factor for bulls, which might extend the upward pressure toward the 22141.41 resistance level.
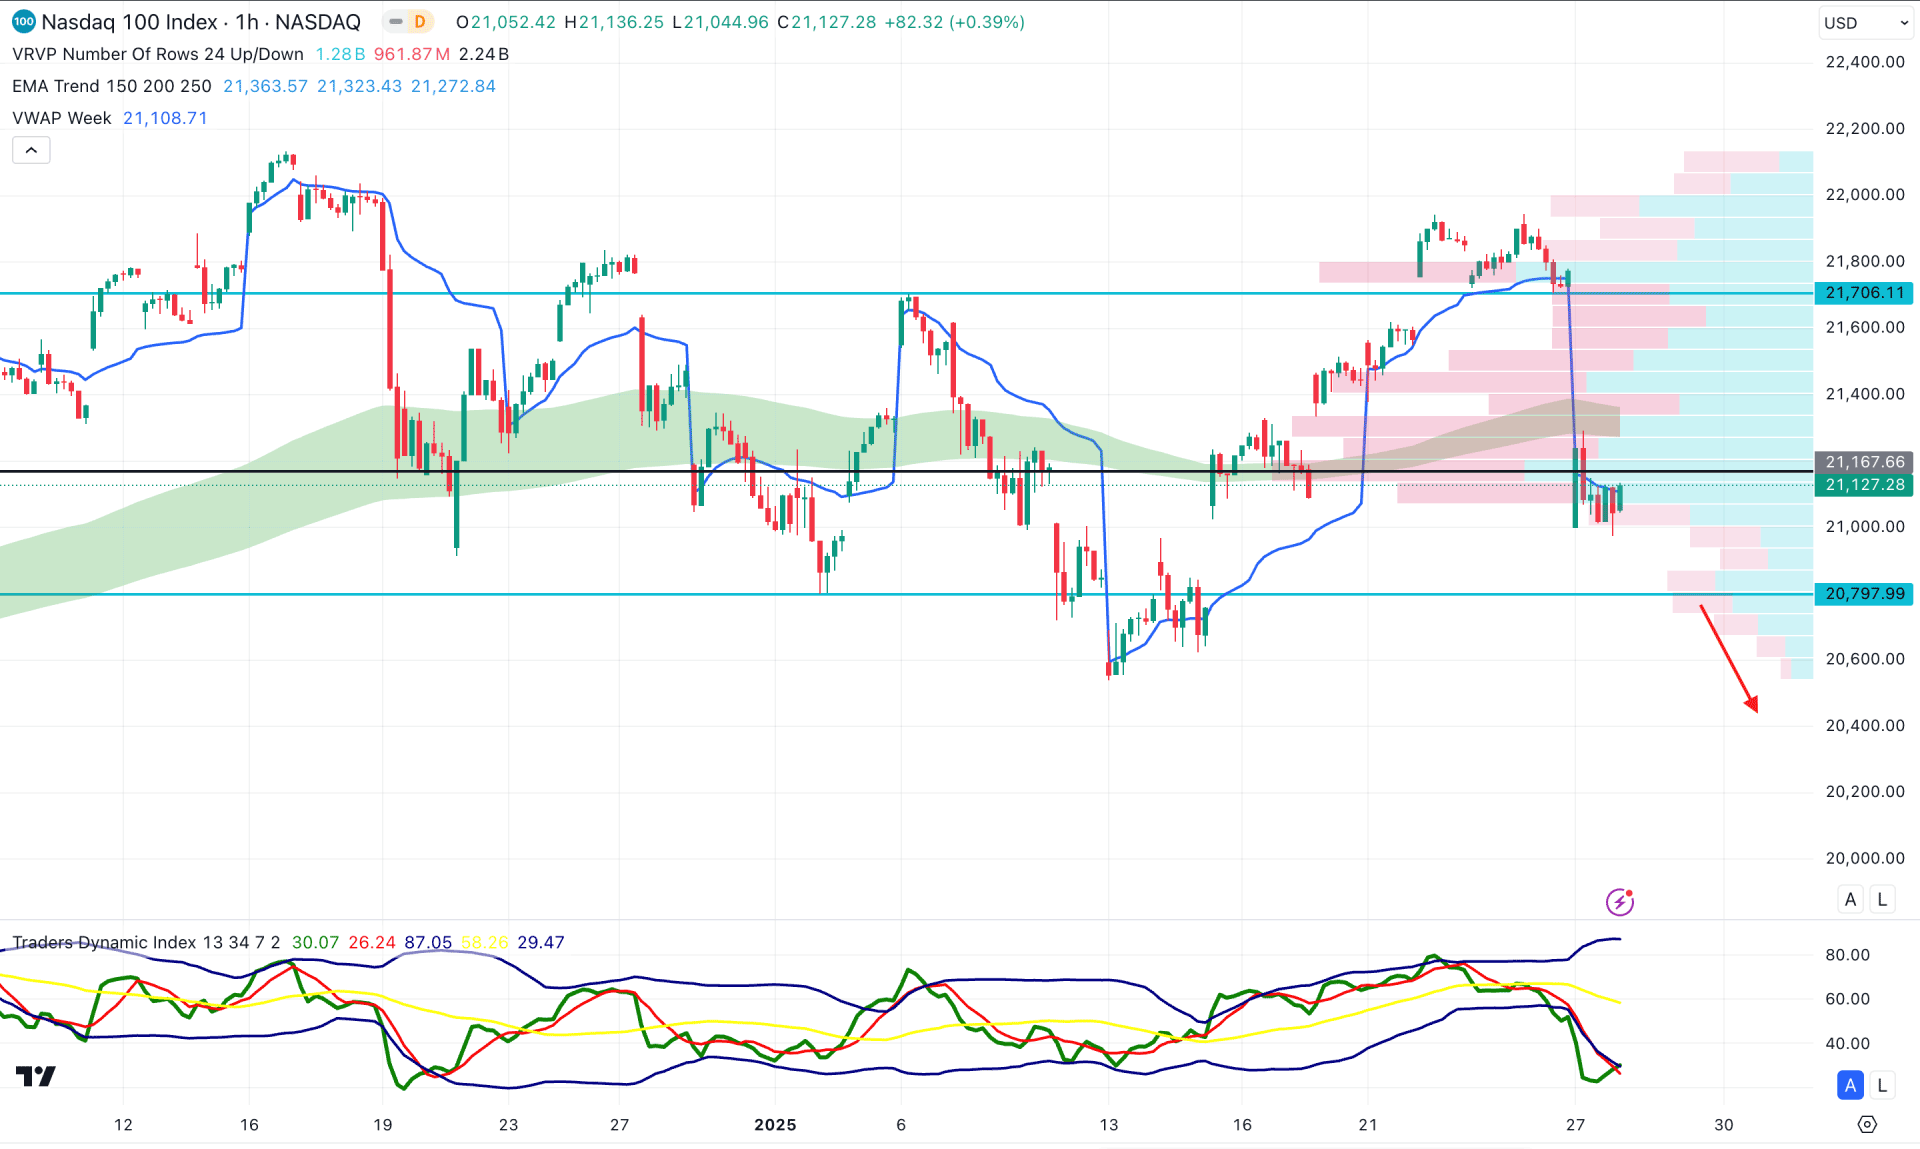
In the hourly time frame, the Nasdaq 100 is trading within a corrective pressure even if the AI sentiment shook the price.
The most recent selling pressure from the intraday high took the price below the dynamic high volume line, suggesting an intraday bearish momentum. As a result, the Traders Dynamic Index (TDI) reached the bottom followed by the market sentiment.
Based on this outlook, the downside continuation is likely to happen as near-term dynamic levels have flipped the position. However, an immediate bullish recovery with a stable market above the 21706.11 line might eliminate the downside pressure at any time.
Based on the current market momentum, the Nasdaq 100 is trading within a broader bullish trend, from which a trend continuation is more likely. However, as the recent intraday price has formed a bearish pressure, investors should monitor how a bottom is formed before anticipating a long wave.


