Published: June 12th, 2025
Markets are processing a new dosage of trade friction and simmering geopolitical upheaval, which has caused global equities to take a new downward swing. Investors are once again uneasy after US President Donald Trump indicated his intention to slap unilateral tariffs on a wide range of trading partners. This action will likely increase volatility in the economy in the coming weeks.
However, even indications of improvement in the US-China trade talks did not help the markets. The ambiguity of the contracts being alluded to may have contributed to the noticeably subdued response from investors. However, the President's announcement that his administration is drafting a series of "take it or leave it" trade letters to more than 20 countries actively negotiating with Washington is more likely to have caused this.
Investors are still cautious since the prospect of a tariff increase on July 9th is still quite real. Given this uncertainty, the industries will do well to stay at their current levels. However, if we observe additional bearish price activity, the latest bullish trend will be doubted. Therefore, the Nasdaq 100 prognosis appears to be very unpredictable in the short term, with risks leaning to the downside.
Stories suggesting Israel was ready to start a military assault against Iran heightened fears of greater regional instability. Crude oil rallied yesterday, and gold is up today because of the risk-off mood created by trade anxiety and growing geopolitical tension, which also caused stocks and the US currency to decline.
The stakes are now even higher after Iran's defence minister threatened to launch retaliatory attacks on US military installations in the area if hostilities broke out. Trump, on the other hand, has voiced increasing doubt about the possibility of a nuclear agreement and threatened to use force if diplomacy fails. Since April, five rounds of negotiations have been undertaken, but little has been accomplished, and markets are beginning to price in the likelihood of a more major dispute.
Let's see the further outlook from the NDX technical analysis:
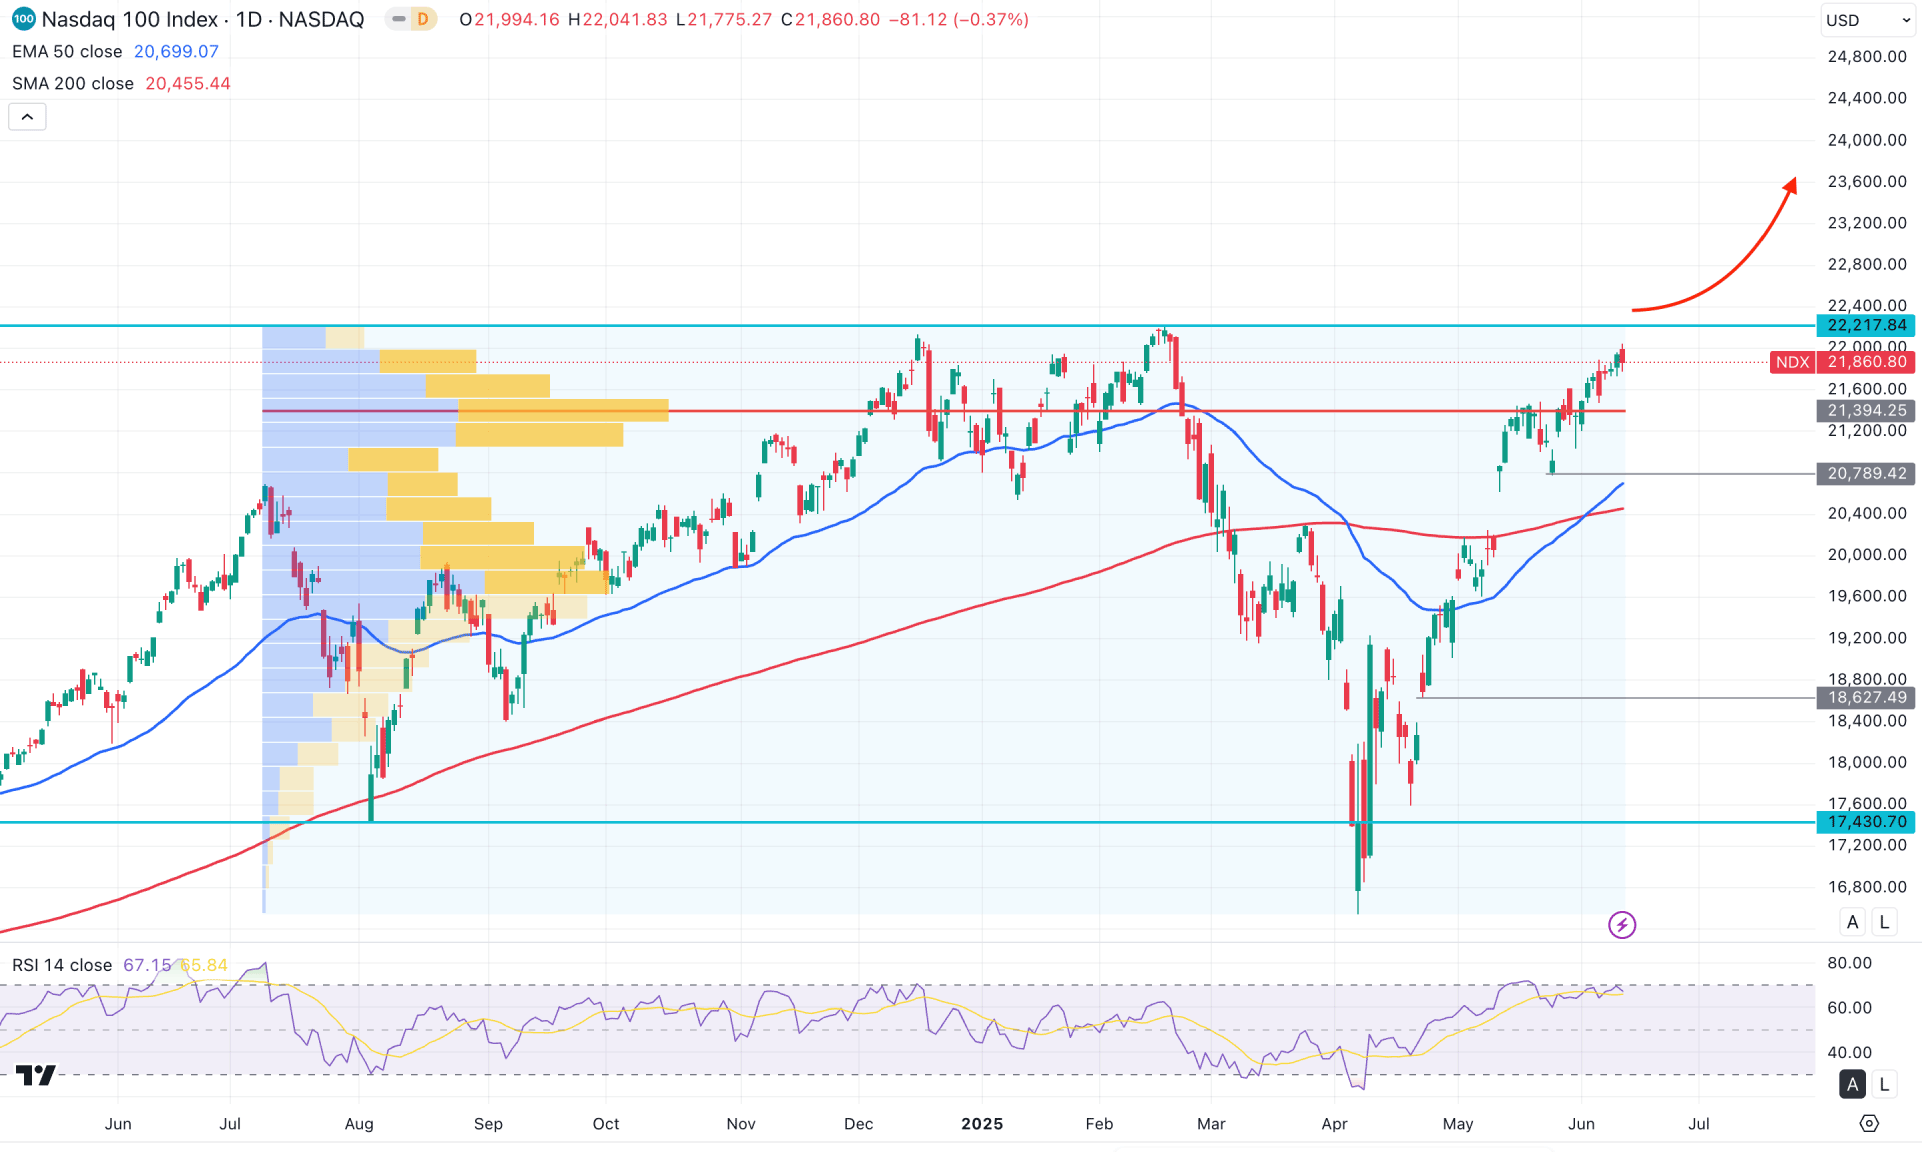
In the daily chart of the NASDAQ 100, the recent price has rebounded from the 25% market crash from the existing all-time high. As a bullish recovery is in place with no sign of exhaustion near the resistance area, we may expect the buying pressure to extend.
In the higher timeframe, the hammer candlestick formed in April 2025 acted as a catalyst for bullish momentum, offering a continuation opportunity in line with the major market trend. In the weekly timeframe, the recovery remains intact; however, the current resistance at the 22,217.84 level still holds. As the price approaches this resistance zone, investors should remain cautious before opening any long positions from the premium area.
Looking at the volume structure, the highest activity level since July 2024 is also located in the premium zone, just below the current price. A breakout could lead to a stable upward trend since this high-volume area is near the current price. As the broader market trend is bullish, the primary objective would be to seek long opportunities as long as the price remains above the key support levels.
Additionally, the 50-day Exponential Moving Average is positioned below the current price and acts as a dynamic support. The recent price action has tested this EMA and rebounded strongly, forming a V-shaped bullish recovery. Moreover, the 200-day SMA is situated well below the entire price structure and serves as a long-term trend indicator. The presence of a classic Golden Cross indicates a continuation opportunity, and traders may look for long trades as long as both the 50-day and 200-day MAs remain below the current price. If the price pulls back toward the 50-day EMA, it may offer a favourable long entry with higher reward potential.
In the secondary indicator window, the RSI Oscillator has rebounded from the oversold zone and is now holding firmly above the 50.00 neutral line. As long as the RSI stays above this level, there is a valid bullish momentum that could push the price toward the 70.00 level.
Based on the daily market outlook, the NASDAQ 100 trades in a premium zone. Therefore, opening long positions requires extra caution. With the 50-day EMA and previous high still below the current price, investors can anticipate continuing the trend. Primarily, the price is likely to test the 22,217.84 resistance level before making a new all-time high.
Conversely, if there is an immediate bullish breakout followed by a strong rejection below the high-volume level, a minor short-term correction toward the 50-day EMA could occur. However, the overall bullish trend will remain valid as long as the 200-day EMA stays below the current price. A sustained break below the 19,000.00 area may increase the likelihood of a deeper correction toward the 16,523.30 swing low.
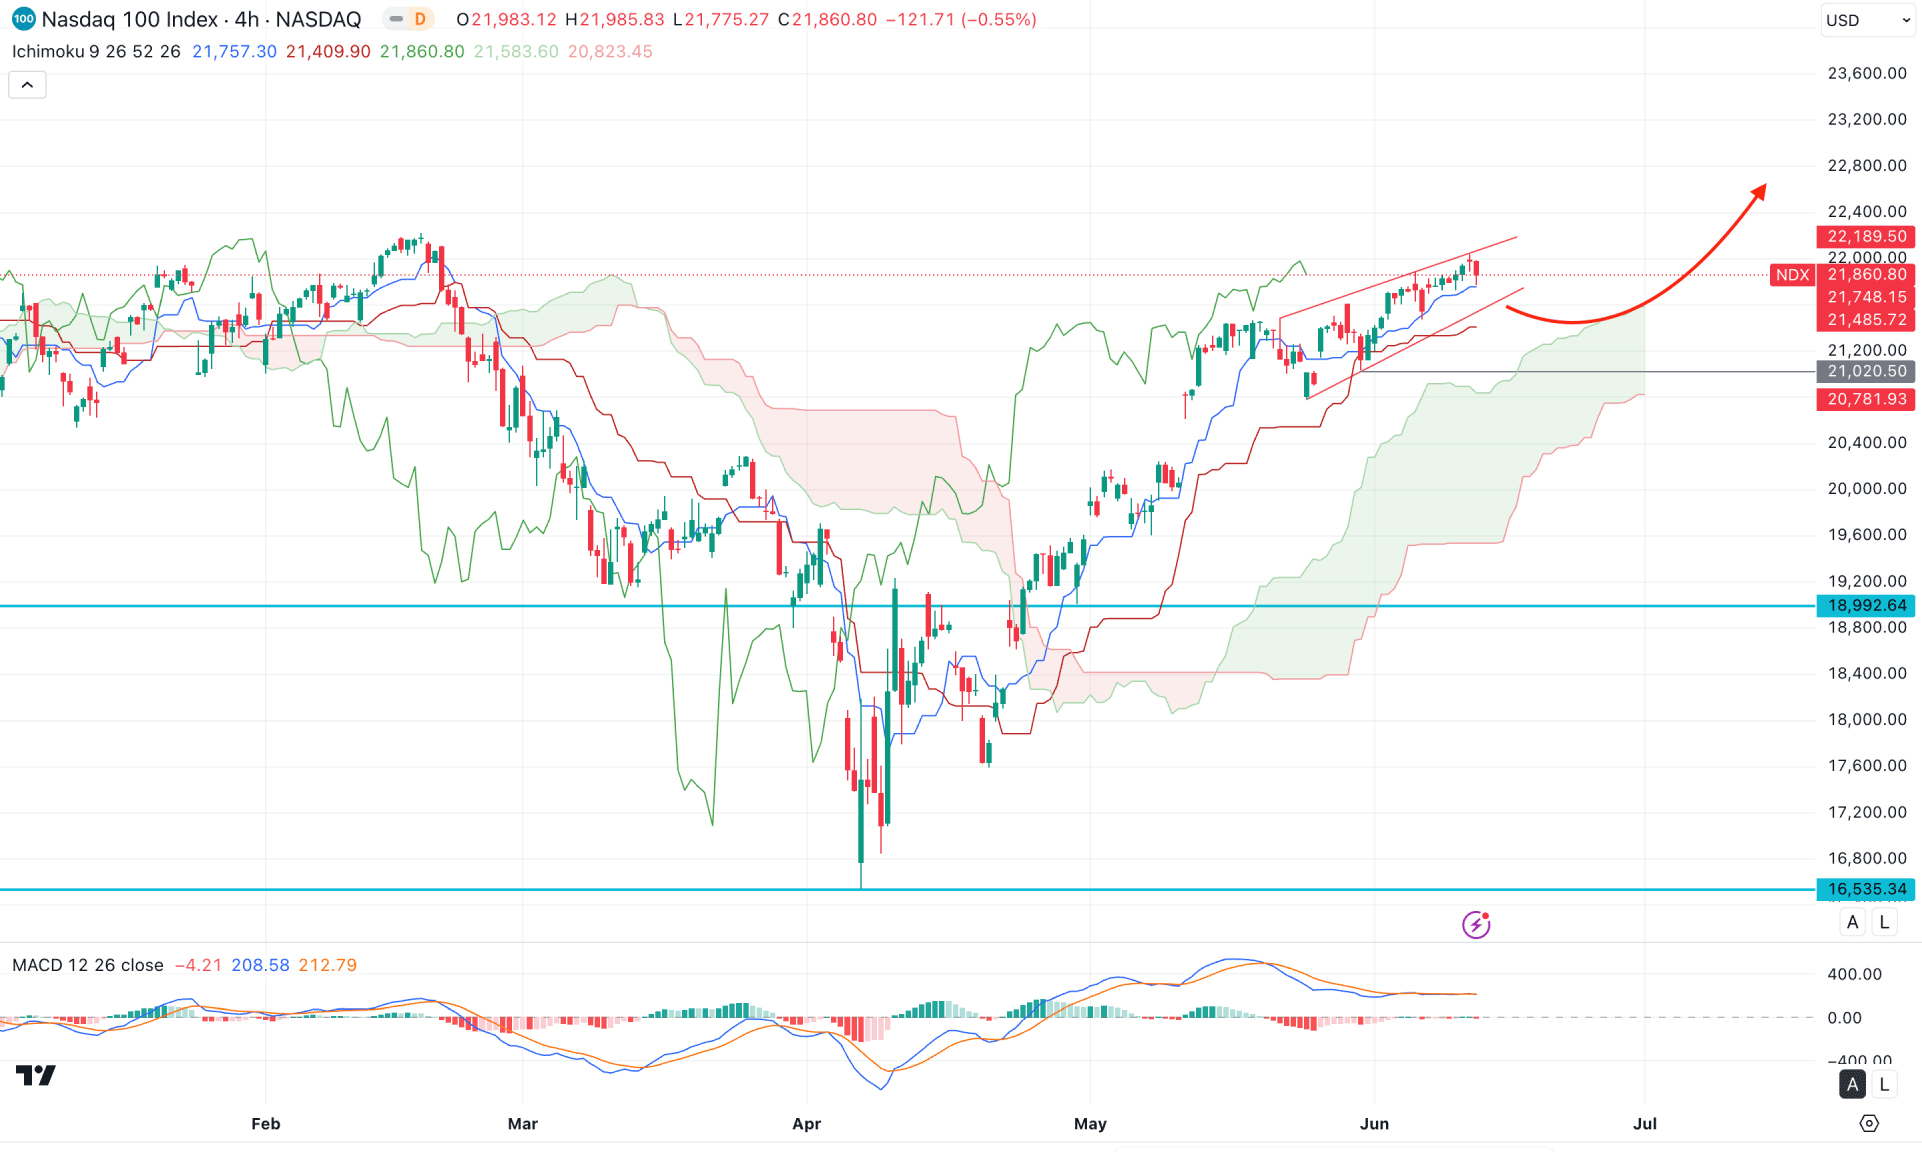
In the H4 timeframe, the recent price trades above the Ichimoku Cloud area, suggesting a bullish continuation opportunity. Moreover, this bias is supported by the exhaustion at the 16,535.34 level, which likely eliminated sellers from the market before forming a bullish cloud breakout. As the future cloud is also supportive, we may expect the buying pressure to extend once a minor correction is complete.
The MACD histogram remains flat in the indicator window, indicating indecisive momentum, while the signal line is also flat. Although the dynamic support is below the current price, the gap with the dynamic level could be filled before the bullish momentum resumes.
Based on the hourly market outlook, a bearish breakout from the rising wedge pattern could find support at the 20,020.50 low. However, a recovery above the 21,000.00 level could lead to a potential rally toward 23,200.00. On the other hand, the ongoing buying pressure may struggle to break above the 22,229.40 swing high. A failure to overcome this resistance could increase the bearish possibility toward the psychological 20,000.00 level.
Overall, the bullish market trend will remain intact as long as the price is trading above the 20,500.00 area. Below this level, the primary support lies at 18,992.64, followed by a deeper support near the 16,800.00 level.
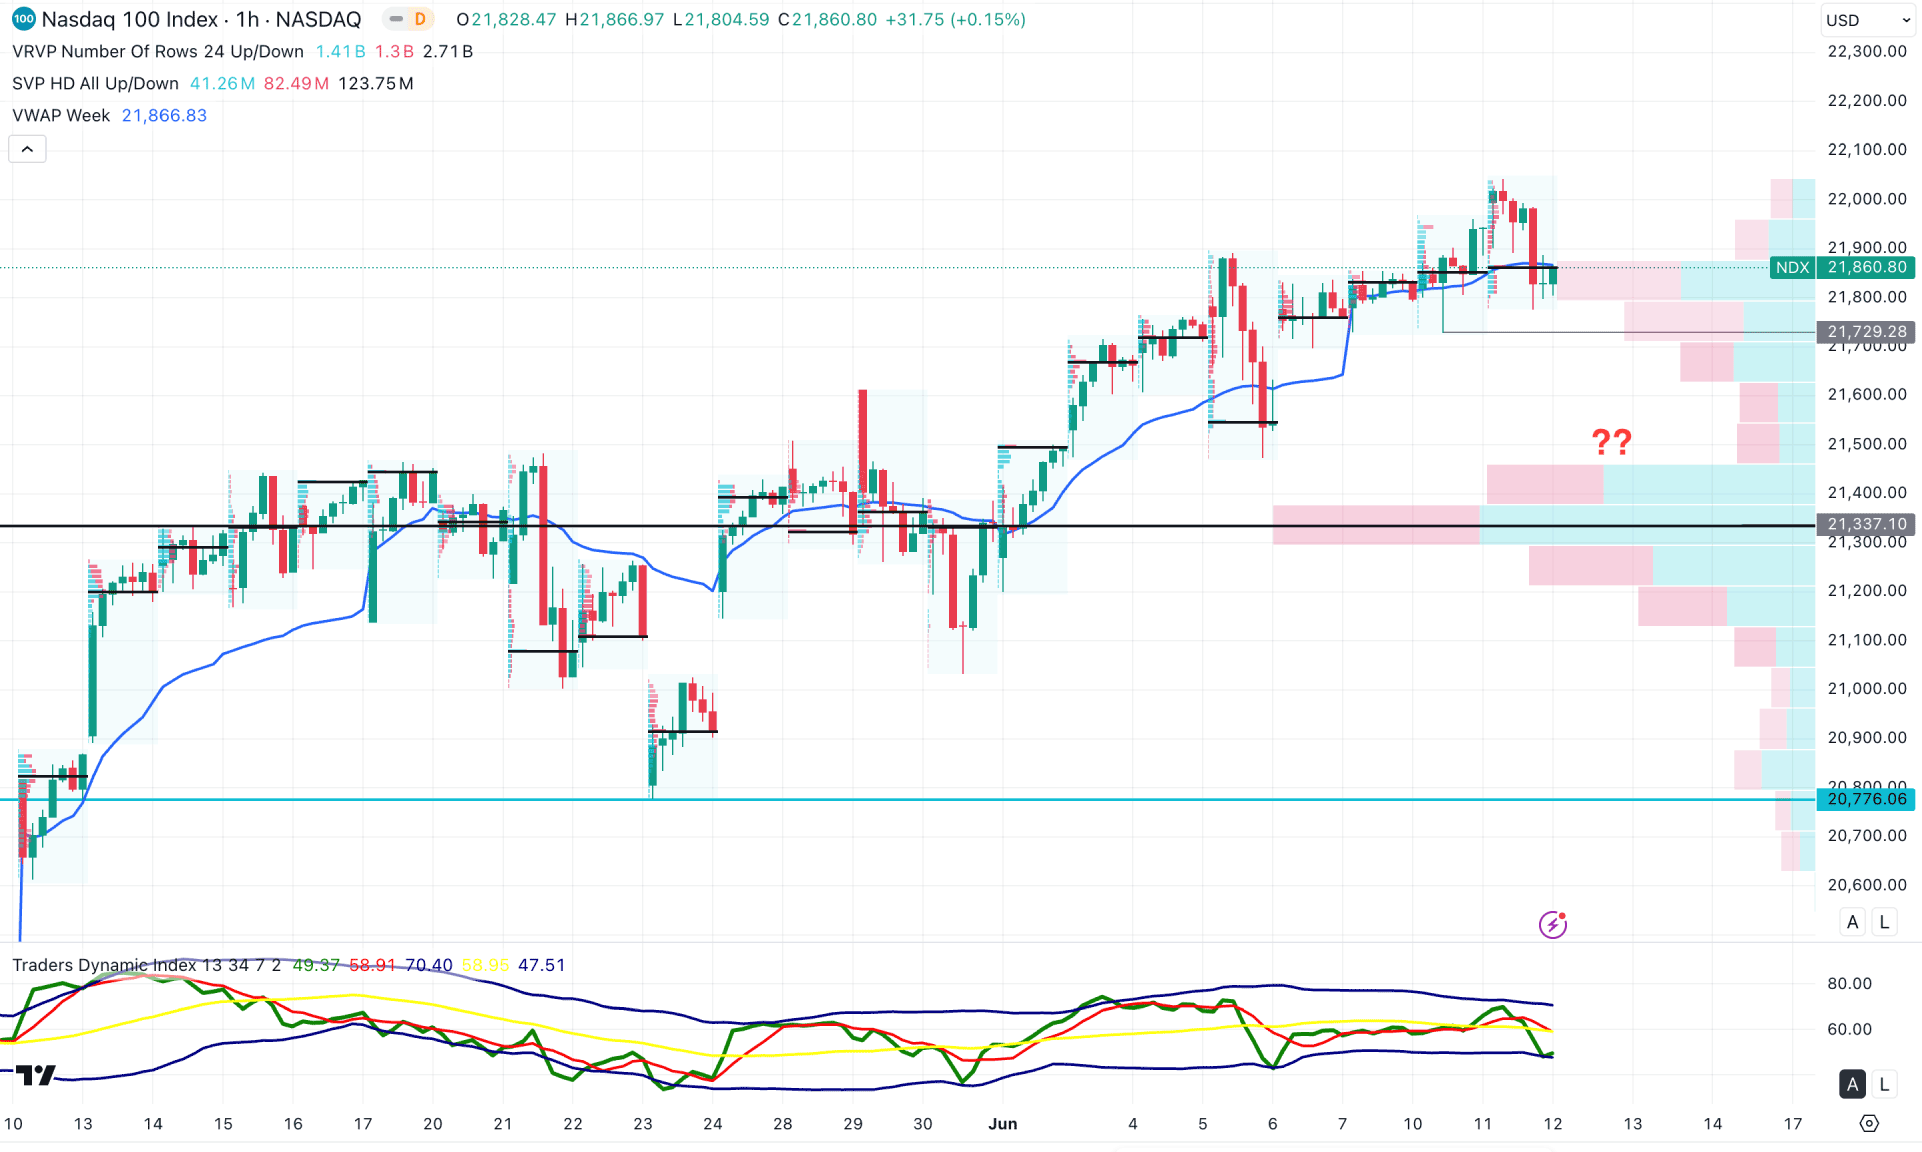
In the hourly time frame, the ongoing market momentum is bullish, as the high-volume line is positioned below the current price. Moreover, the price rises by creating new swing highs, which signals a solid upward trend formation.
In the secondary indicator window, the Traders Dynamic Index (TDI) shows a different story. The current TDI line has rebounded but remains below the 50.00 level and within the neutral area. Additionally, a potential divergence between the price and the TDI indicator suggests a possible top formation in the hourly chart.
Based on this outlook, investors should closely monitor how the price reacts at the 21,729.28 support level. If the price holds above this level, a bullish continuation may occur, with the price likely reaching the 22,200.00 area. On the other hand, an immediate break below the 21,700.00 level might find support at 21,337.10. If this level fails to hold, the bearish momentum could extend, potentially driving the price down toward the 21,000.00 swing low.
Based on the current market structure, the NDX is more likely to extend the current bullish trend and possibly make a new all-time high. Investors should closely monitor the intraday market as one more downside push is pending before following the major trend.


