
Published: April 6th, 2022
The US Stock market showed a positive sentiment in the first couple of trading days in Q2, riding the wave that started from the FOMC rate decisions a few weeks ago. The Fed raised the interest rate for the first time since 2018, with signs of multiple rate hikes in 2022 to recover the economy from the current higher inflationary pressure. As a result of the rate hike, the Nasdaq 100 gained 17.97% from the 15 March low to the 29 March high.
However, these movements are signs of a bubble behavior where trillions of market cap are added without any solid fundamental bias. The rate hike and avoiding quantitative tightening are alarming signs for the current stock market bull. Although the Fed talked about quantitative tightening during the March FOMC, the market turbulence from the Ukraine-Russia crisis pushed the Fed to stay away.
Therefore, investors should monitor how the Fed talks about quantitative tightening alongside the rate hike in the coming FOMC.Thee Nasdaq 100 has already faced a double top pattern, where a neckline break would initiate a bearish correction before continuing the Fed-driven bullish trend.
Let’s see the future price direction from the Nasdaq 100 (NDX) technical analysis.
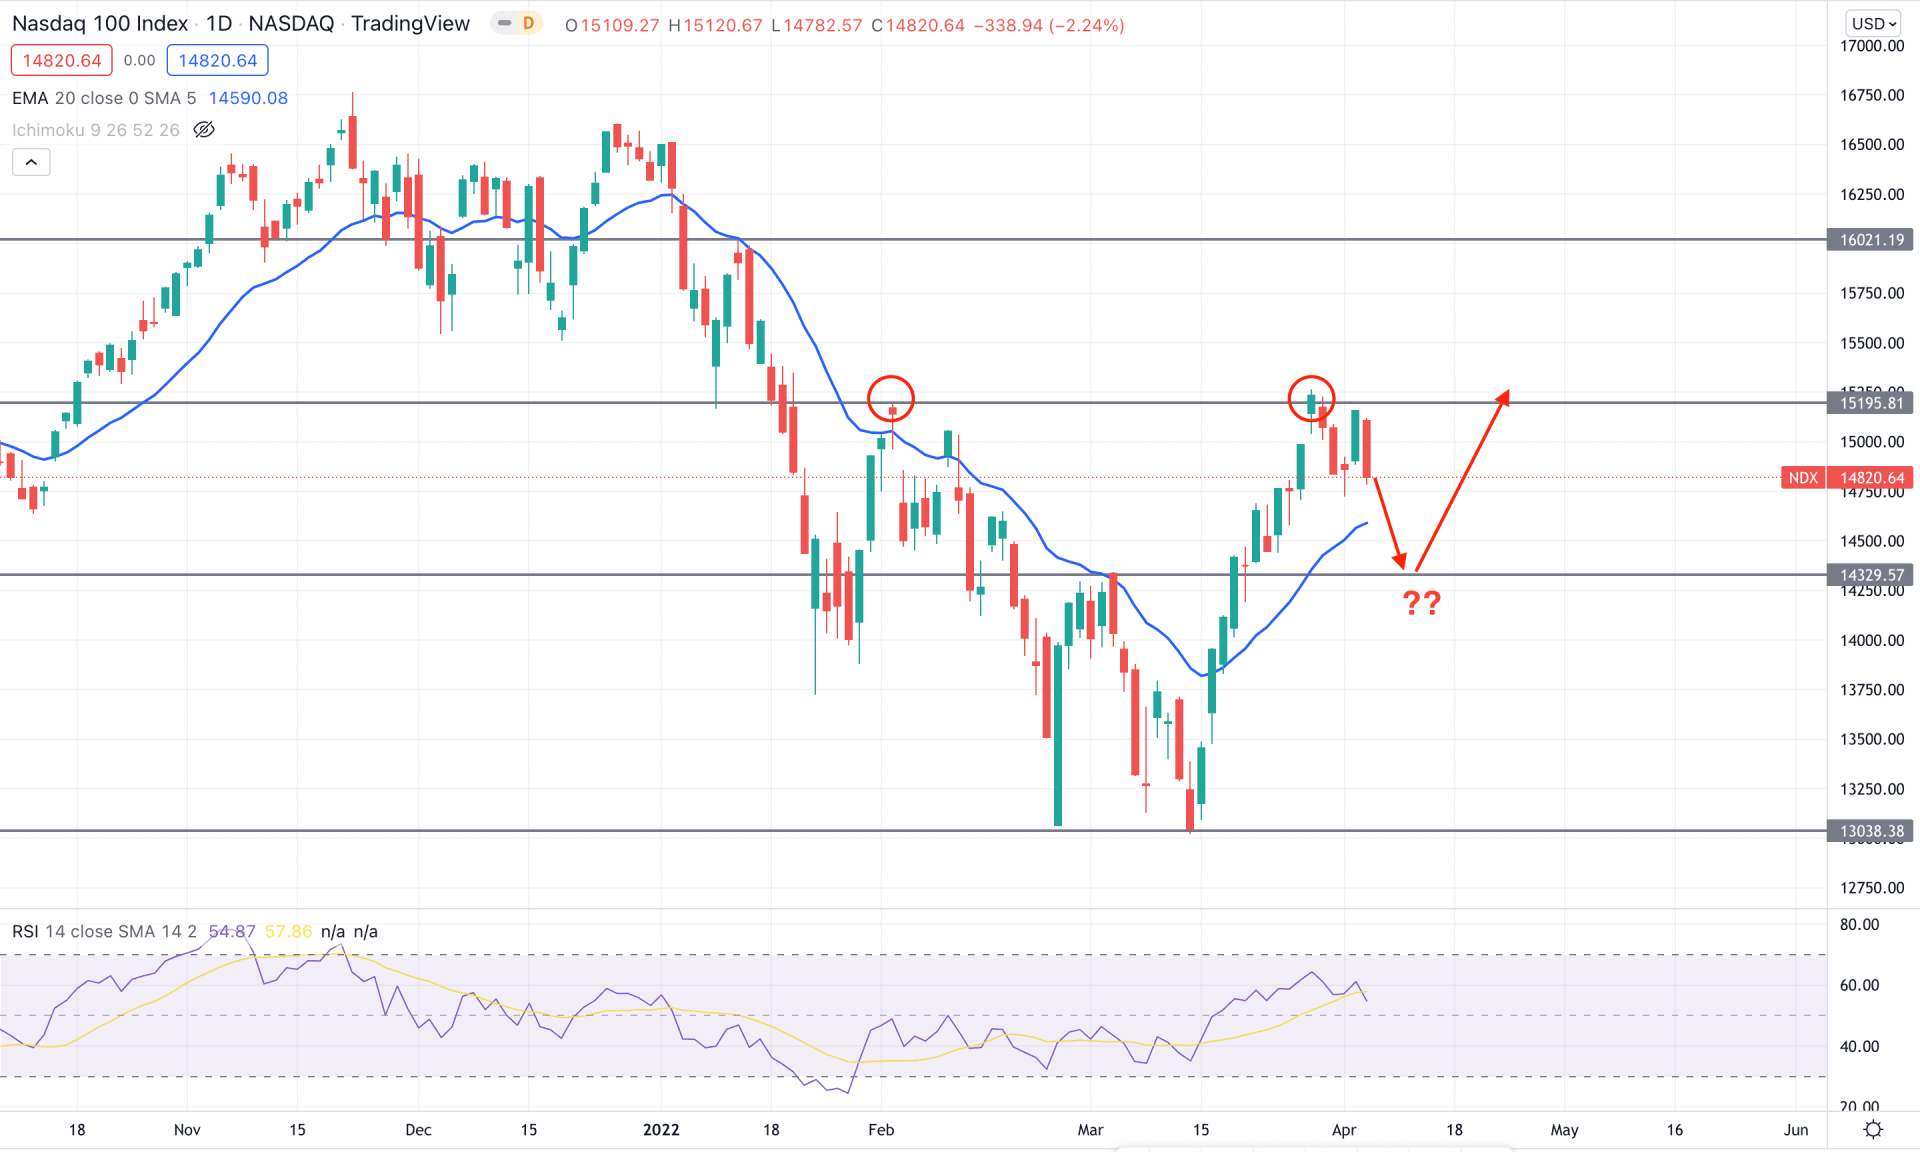
In the Nasdaq 100 daily chart, it is visible that the price made a sharp rally downside and found a bottom at the 13038.38 support level before aiming higher. In the most recent chart, the price moved higher above the dynamic 20 EMA but failed to hold the bullish momentum above the 15295.18 resistance level. Therefore, the potential double bottom formation might find relief by taking the price down towards the 14329.57 support level in the coming days.
The above image shows how the price changed after moving above the dynamic 20 EMA while the RSI failed to reach the overbought 70 level. Therefore, if the RSI level moves below the neutral 50 level, it may increase the bearish pressure on the price towards the 14329.57 static support level.
Based on the daily structure, investors should consider the upcoming price direction as bearish as long as bears hold it below the 15195.81 static resistance level. On the other hand, any bullish rejection from the dynamic 20 EMA with a daily close above the 15200.00 level, would increase the buying momentum towards the 16021.19 level.
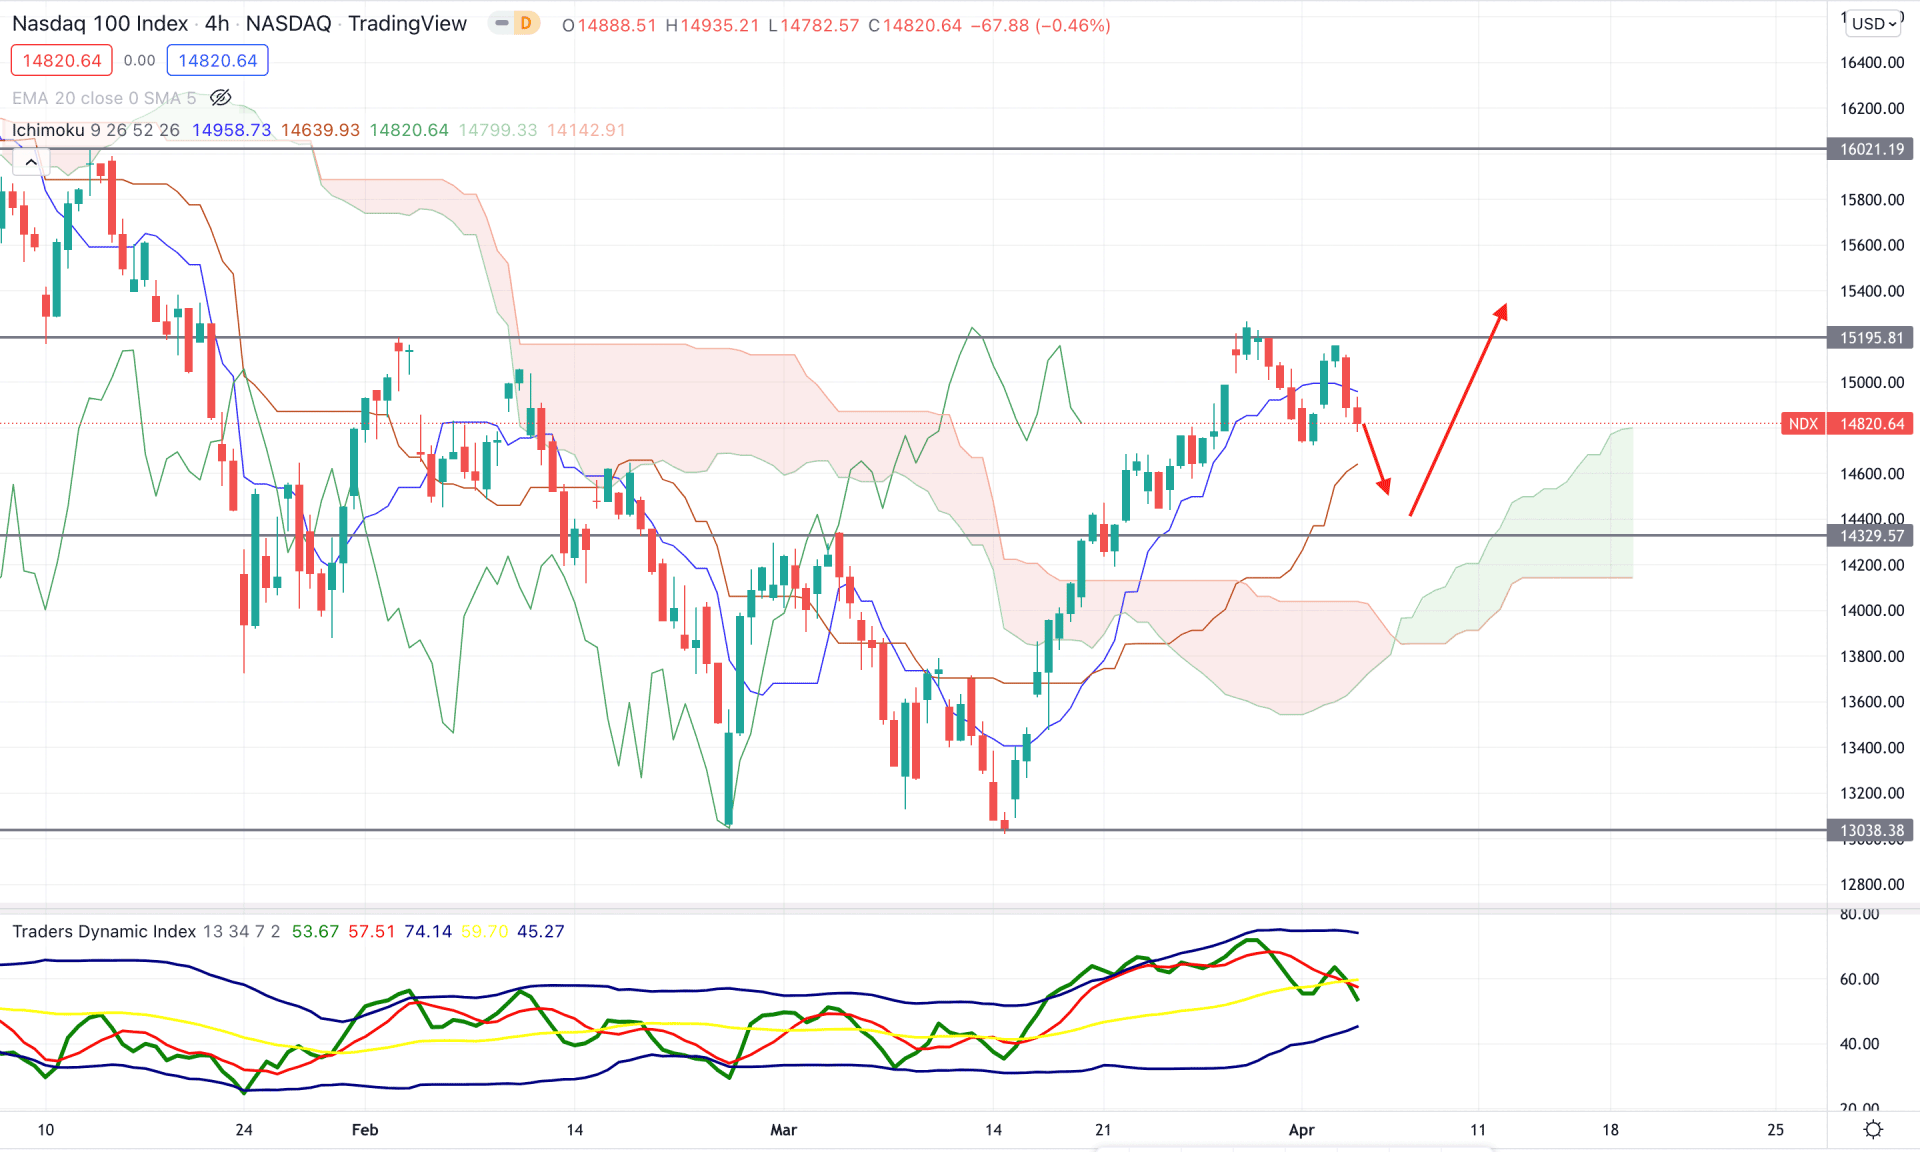
In the Nasdaq 100 H4 chart, the market direction is bullish as the current price trades above the Ichimoku Cloud for a considerable time. Moreover, the Senkou Span A is above the Senkou Span B in the future cloud, while the Lagging Span is bullish. However, as the price moved above the Cloud support with impulsive pressure the bullish momentum became weaker after testing the 15195.81 resistance level.
The above image shows how buyers' strengths are weaker as the TDI line moves below the 50 level before testing the upper bands. On the other hand, the recent H4 candles failed to extend their momentum above the dynamic Tenkan Sen, which could test the Kijun Sen support before showing another buying pressure.
Therefore, as the current price became corrective above the dynamic Kijun Sen line, a bearish correction towards the 14329.57 level is still pending. In that case, any bullish pressure from 14640.00 to 14300.00 area would be a solid trend following buying opportunity for this instrument. On the other hand, a break below the 14000.00 level would alter the current market structure and initiate a consolidation.
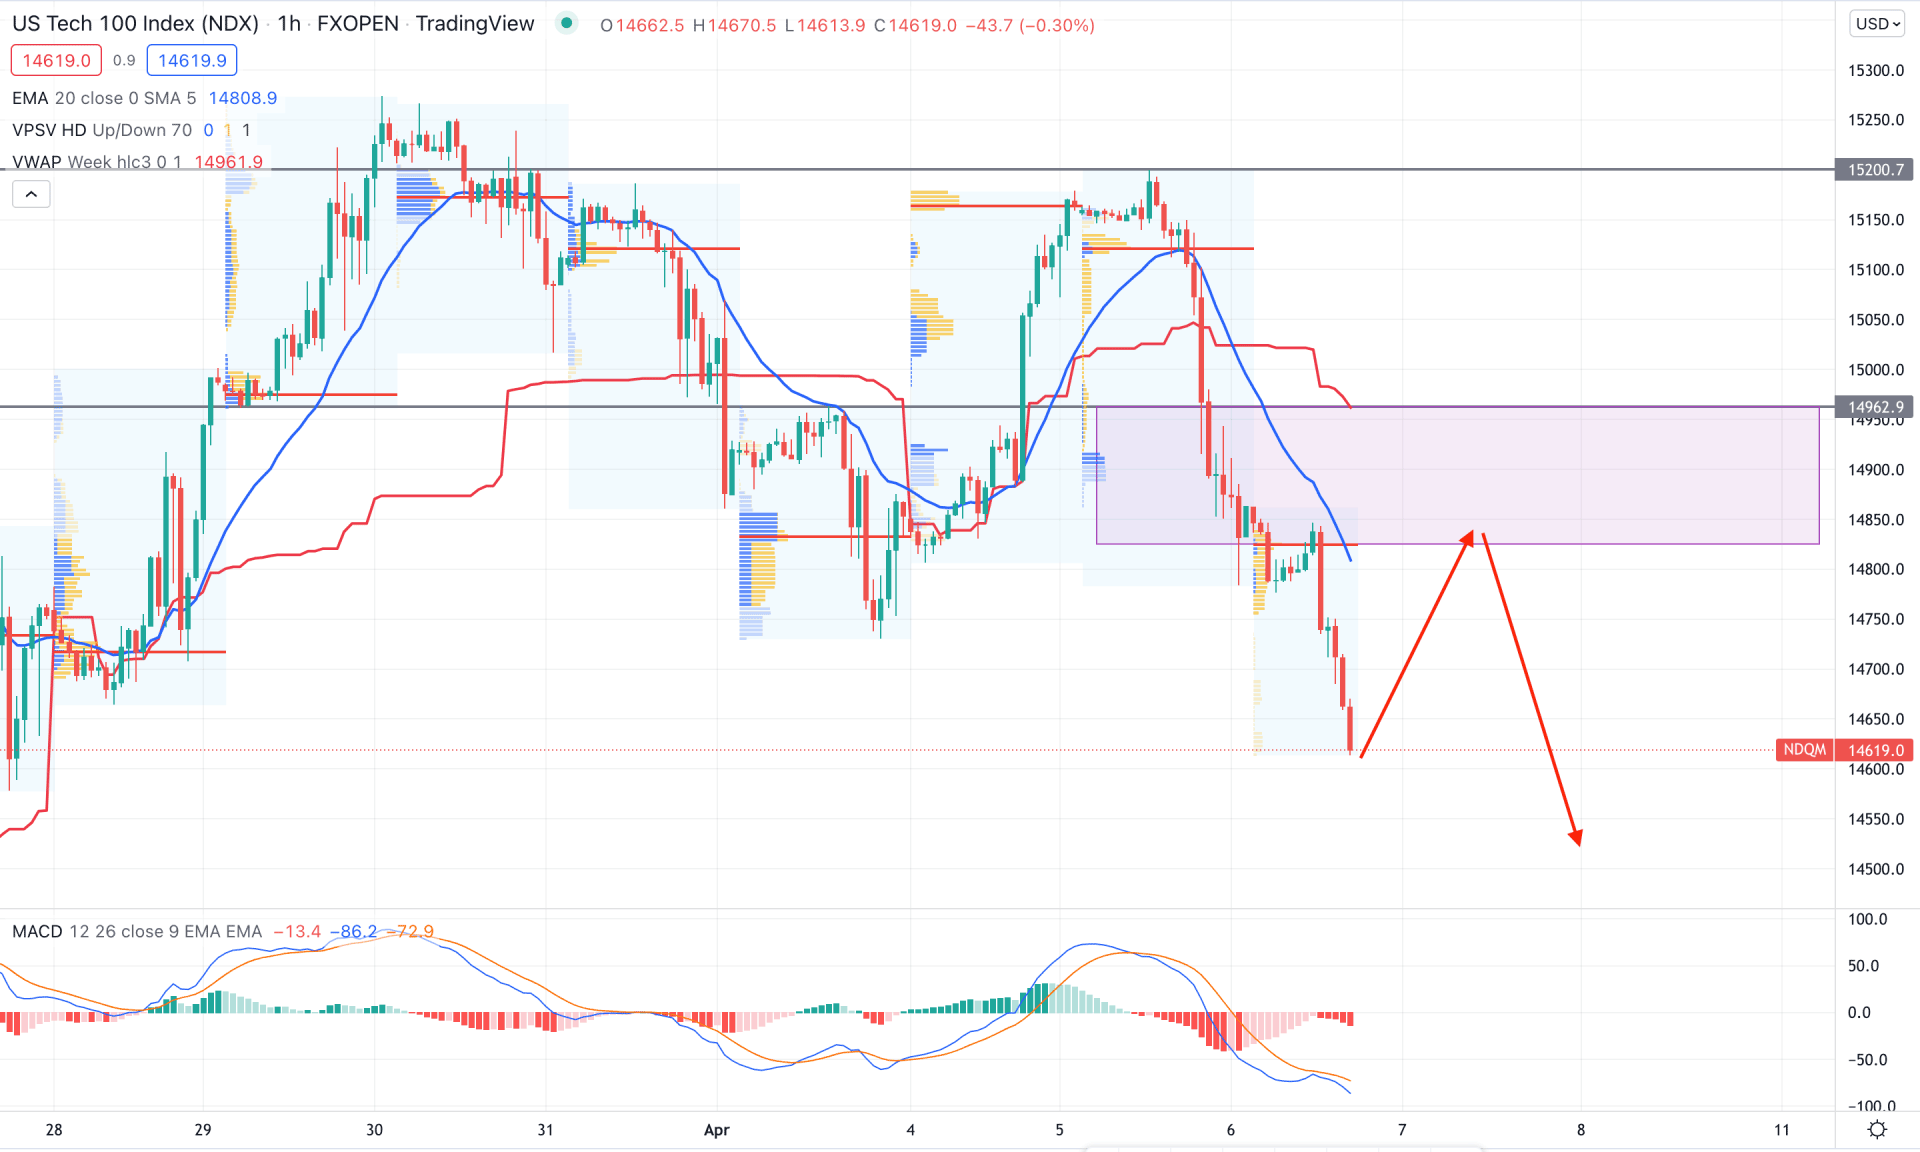
In the Nasdaq 100 intraday chart, the current trend is bearish as the price moved below the dynamic 20 EMA with an impulsive bearish pressure that made a new swing low below the 14750.00 level. Moreover, the most intraday high volume level is above the price from where another bearish pressure came.
The above image shows how the MACD Histogram became bearish in the last trading session, although the dynamic weekly VWAP remained at the 14962.12 resistance level. In that case, a minor bullish correction is still pending where any selling pressure from the 14800.00 to 14970.00 area would resume the current bearish trend.
Based on the current multi-timeframe analysis, the Nasdaq 100 intraday price is extremely bearish and may provide a selling opportunity after a correction. Overall, the bearish possibility from the potential double bottom pattern is valid as long as bears are holding the price below the 14900.00 level in the daily chart.


