

Published: September 17th, 2026
After the Federal Reserve raised interest rates on Thursday and reiterated its commitment to containing inflation and eliminating a persistent source of market unease, U.S. equity index futures jumped.
Investors went back to their favourite topics after the rate hike. Tech stocks increased, with Meta META and Alphabet GOOG both climbing more than 1% before the bell.
Investor attitudes in the second part of September, which has historically been a poor month for stocks, will be greatly influenced by the policy choice.
The actions came the day after the Federal Open Market Committee raised its benchmark rate by a quarter point for the first time since 2023, to 3.75%–4%. The so-called "dot plot" of policymakers suggested another increase before the end of the year.
Kevin Warsh, the Fed chair, tried to reassure investors that he was committed to lowering inflation. Following the news, US President Donald Trump wrote on social media that US interest rates need to be at 1% or less, but he refrained from criticising Warsh directly.
According to the study, investors and officials alike anticipate at least one more hike this year, and markets would anticipate Wednesday's increase to signal the start of a broader tightening cycle.
Let's see the price projection of Nasdaq 100 from the NDX technical analysis:
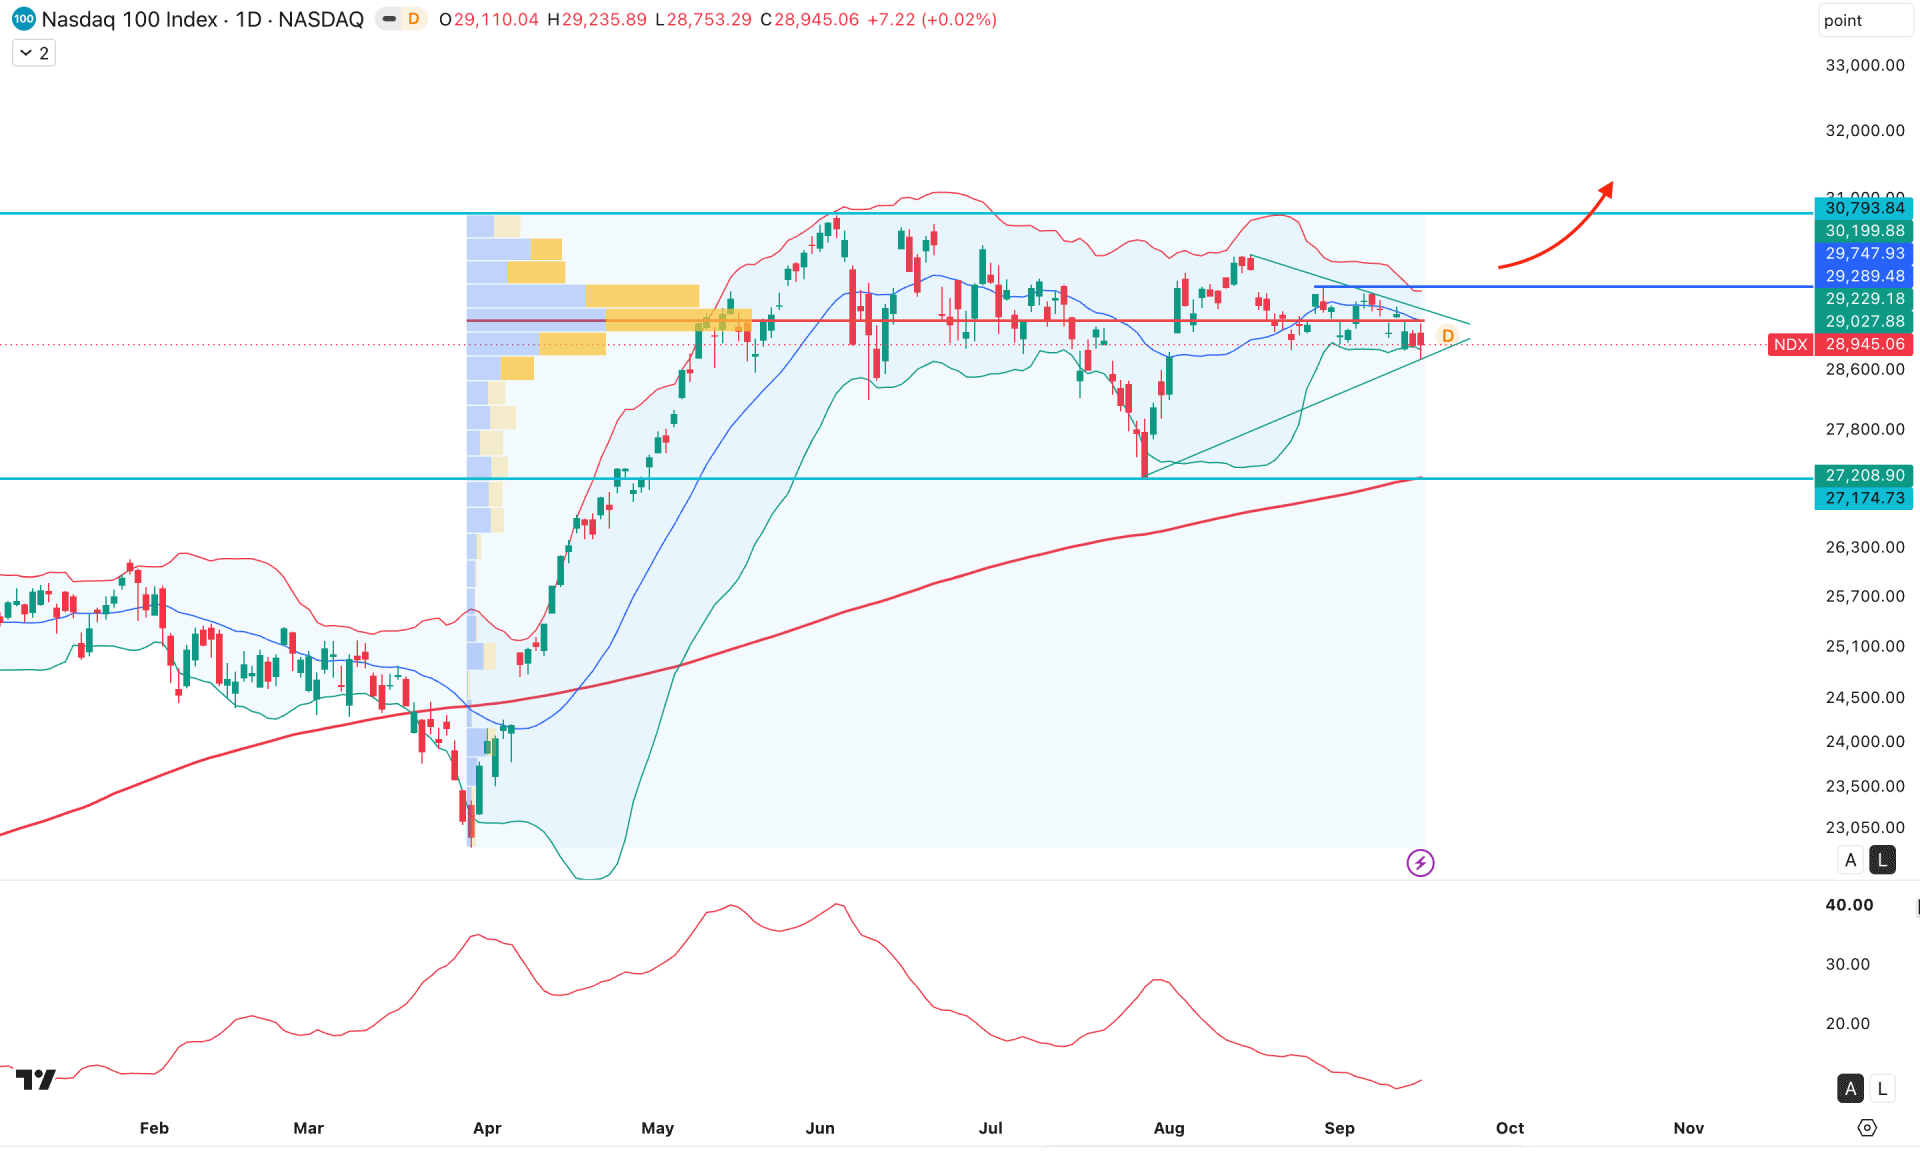
On the daily chart of the Nasdaq 100, price shows corrective bearish pressure after an impulse in the first half of 2026. With no counter-bearish momentum visible from the top, investors may expect buying pressure to extend at any time.
On the higher timeframe, the price action is solid for buyers, as the most recent monthly candle shows corrective pressure backed by a bullish impulse. Generally, rallies form with minor profit-taking while keeping the existing market trend valid.
Volume shows extended volatility, with the highest activity since April 2026 at 29,289.48, just above the current price. Moreover, the price is consolidating with multiple violations of the high-volume line, signaling a range-bound phase.
On the other hand, the 200-day SMA remains below the current price and aligns with the 27,208.90 critical support level, signaling a major bullish structure. Overall, market momentum is above the 200-day SMA, signaling strong bullish pressure, but the gap between price and the 200-day SMA creates the risk of an extensive downside correction.
In terms of price action, the Bollinger Bands remain flat and squeezed, signaling sideways market momentum. However, the most recent price is keeping hope for buyers by remaining at the lower Bollinger Band line for three consecutive days.
On the other hand, the Average Directional Index shows trend strength, with the current line below the 20.00 threshold.
Based on this structure, market momentum is sideways for now and we need additional clues before anticipating a bullish wave.
As the most recent price is still trading below the crucial high-volume resistance level, a valid bullish breakout is needed before buying pressure can extend above 29,747.93.
On the other hand, a symmetrical triangle formation is visible, and the most recent daily candle is testing the triangle support. A failure to hold buying pressure, with a new swing-low formation below 28,745.96, could increase the chance of a move lower and a test of the 27,949.50 support level.
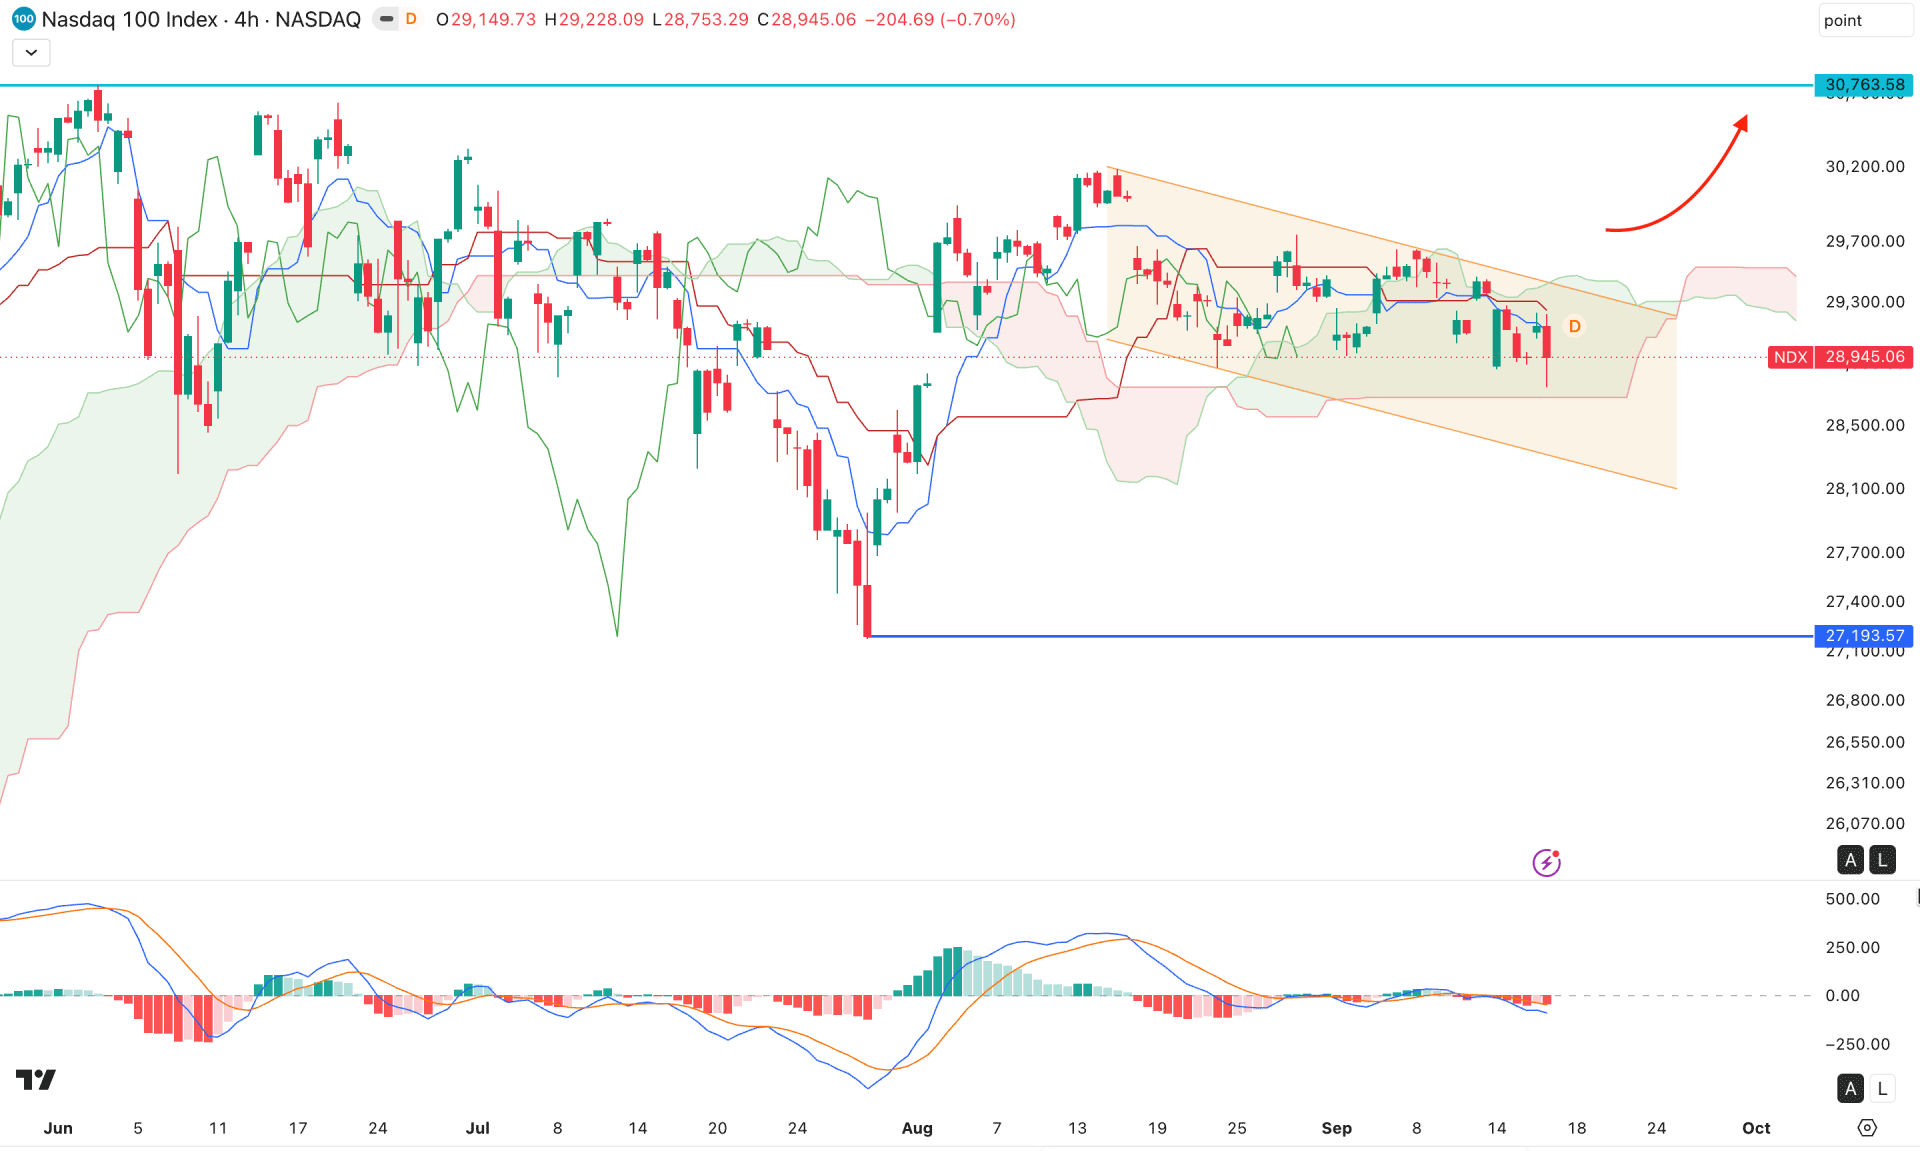
In the four-hour timeframe, NDX is trading under corrective bearish pressure after forming a bullish break above the cloud support. This signals a potential bullish trend reversal from here. We need confirmation from the cloud support area before validating the long opportunity.
In the Ichimoku cloud structure, the future cloud is not solid enough to confirm bullish continuation. A mixed structure is visible, raising questions for buyers.
In the indicator window, the signal line remains below the neutral level, signaling active market pressure, while the histogram remains steady in a negative-positive-negative formation.
Based on this outlook, investors should closely watch how price behaves within the descending channel. Any immediate bullish break and recovery above the 29,600.00 level could validate the long opportunity, targeting 30,763.58.
On the other hand, the current price is still trading below the descending-channel resistance, with room below the cloud support as a channel extension.
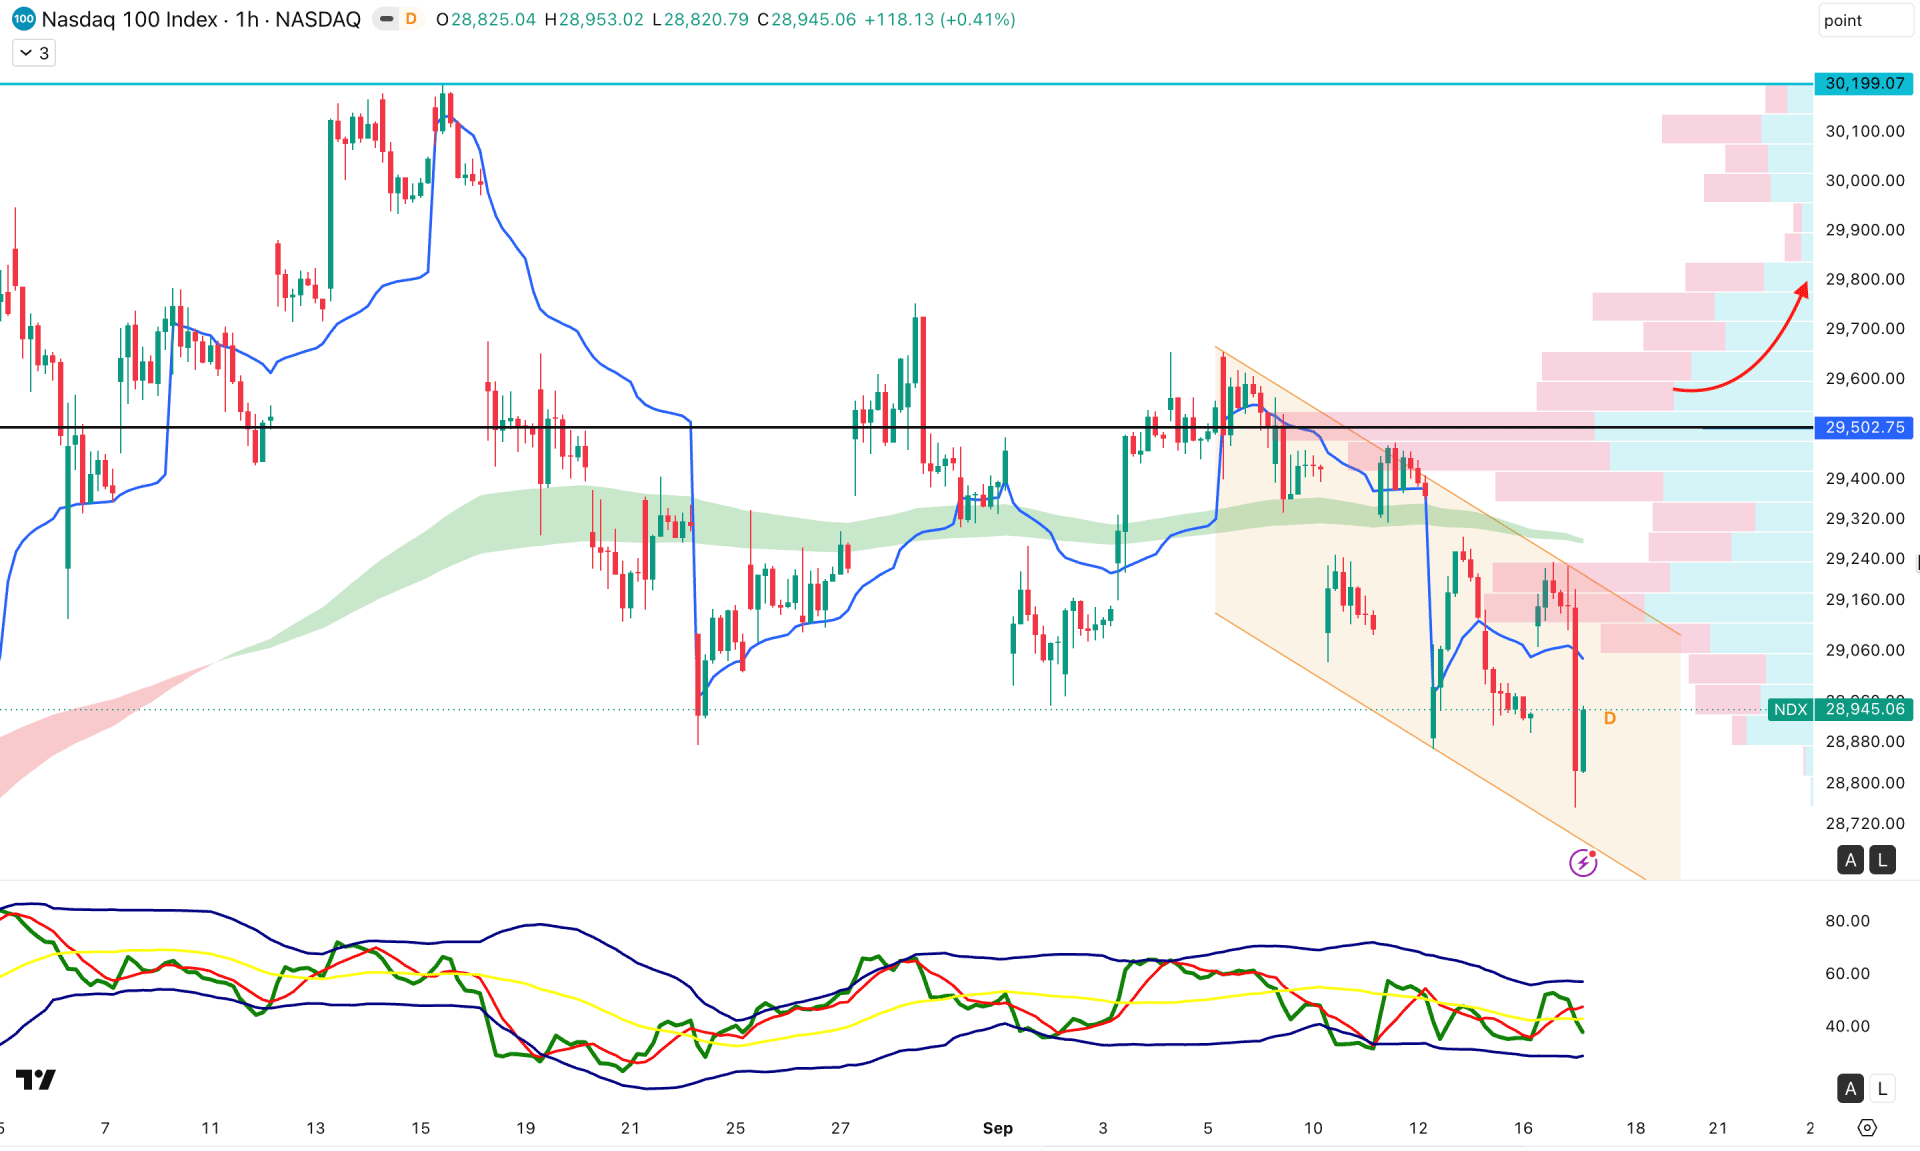
In the lower timeframe, Nasdaq 100 is trading with bearish momentum, while the entire structure is sideways. A strong bearish candle appears below the weekly VWAP resistance level, where the exponential moving average remains near-term resistance.
As a result, price formed a new swing low, with a minor attempt to recover to the upside. The Traders Dynamic Index rebounded, then fell below the 50.00 neutral level amid heavy selling pressure.
As the current price is trading within a descending channel, a valid bullish break is needed before considering a bullish reversal. However, strong resistance sits at the 29,502.75 high-volume line, which must be overcome before approaching 30,199.07.
Alternatively, you can wait for a bearish reversal after testing the weekly VWAP level, which could increase the chance of trading a new swing low.
Based on the structure, NDX is still trading within bullish continuation momentum, while the most recent price action is corrective bearish. In this context, the price is holding crucial support from a sell-side liquidity gap, where a rebound could be a high-probability long opportunity.


