
Published: December 17th, 2025
MYX Finance (MYX) is going in the opposite direction as the whole cryptocurrency sector is under pressure. While Bitcoin, Ethereum, and the majority of altcoins declined, the token has increased significantly.
MYX's robust price movement has drawn attention during a period when the general mood of the market is still negative.
Growing participation in the derivatives industry is one of the primary causes of MYX's increase. Traders are constantly creating fresh positions rather than closing them, as seen by the 8.48% increase in remaining interest in MYX options to $45.63 million.
Concurrently, the long-to-short ratio increased to 1.79, with more than 64% of traders placing bets on rising prices. Trading activity on MYX also increased dramatically. The daily trading volume increased by over 41% to $76.95 million, indicating that new buyers are joining the market.
The excitement surrounding MYX Finance's impending V2 update is another driver. Better cross-chain capabilities and portfolio margin tools were among the enhancements that the team hinted at on December 1.
Let's see the further aspect of this token from the MYX/USDT technical analysis:
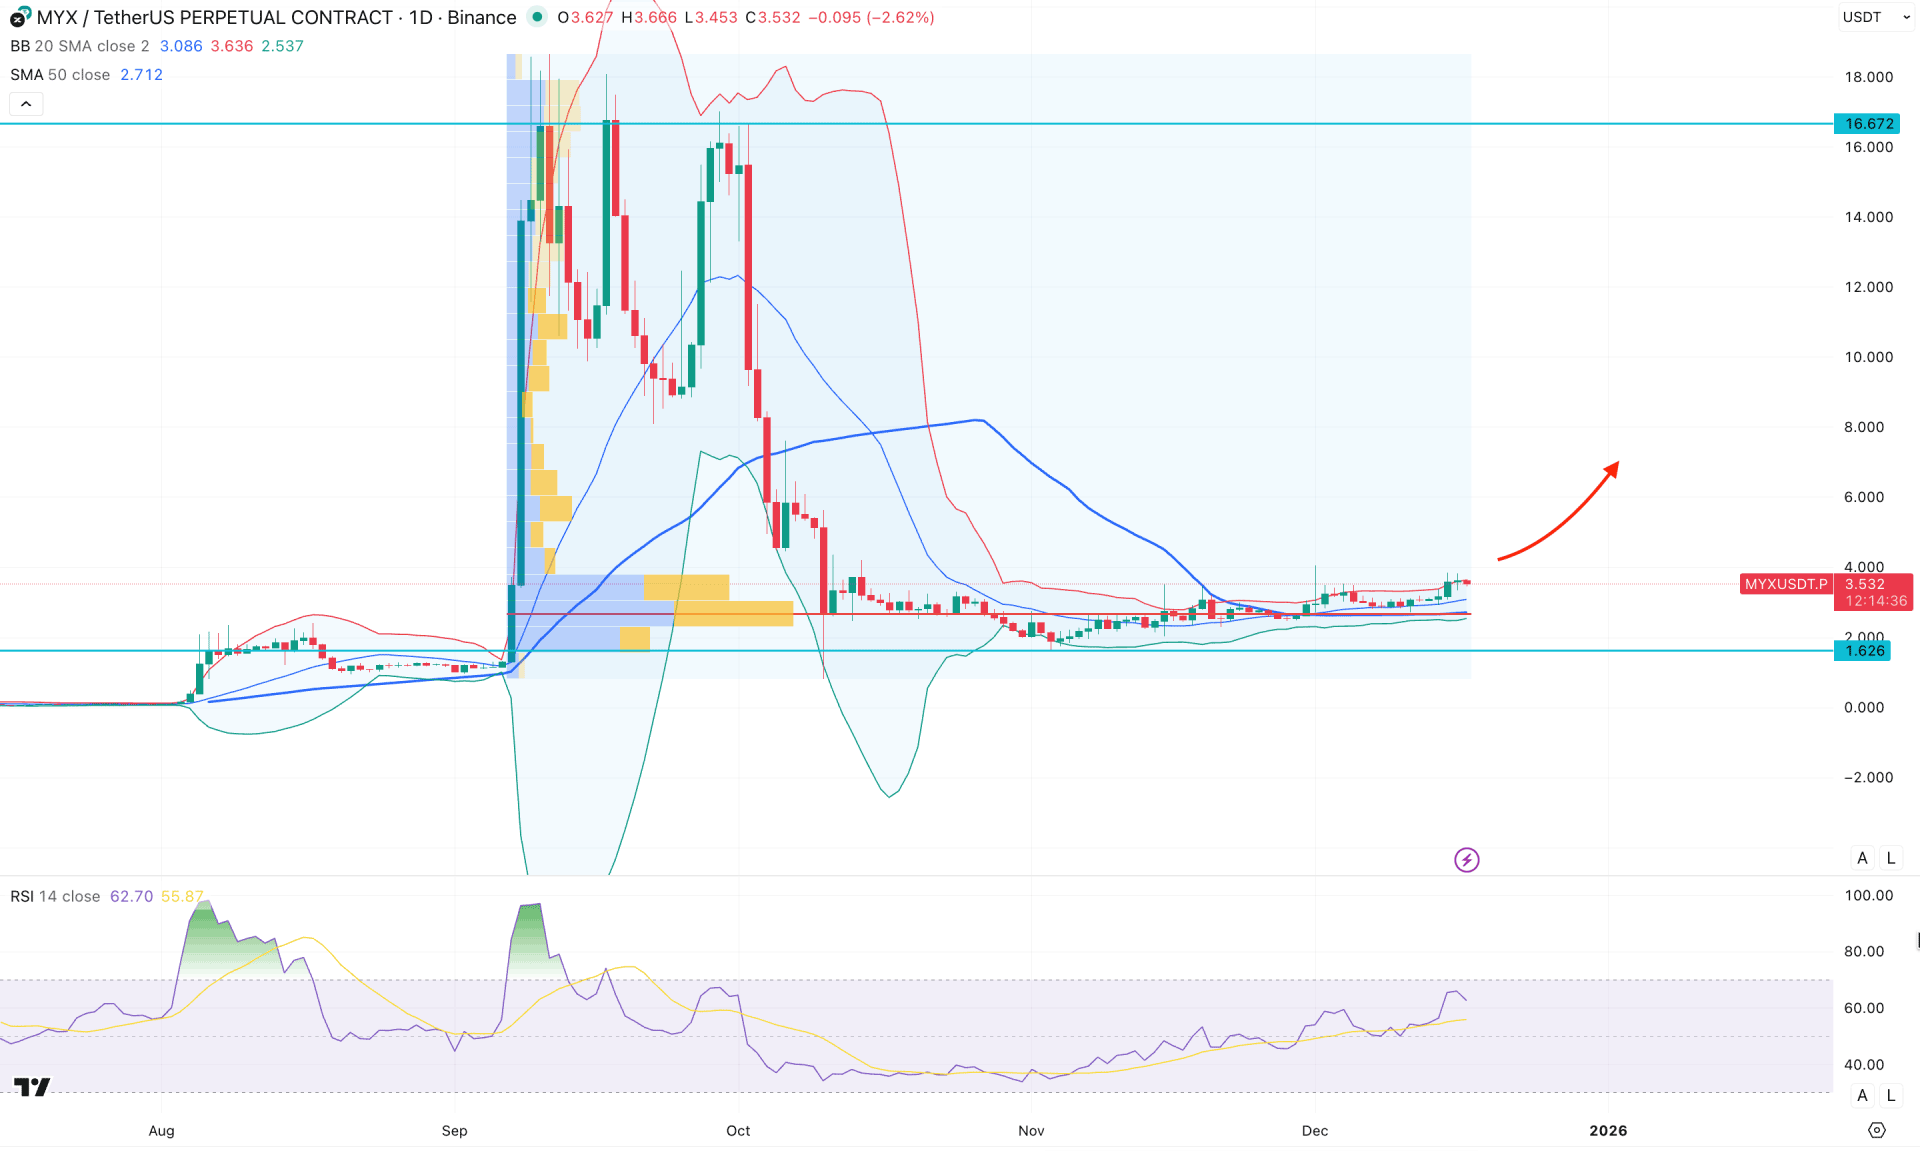
On the daily chart of MYX/USDT, a strong pump-and-dump move is observed, with the most recent price trading at a crucial discounted zone. A valid range breakout from this discounted area could present a potential long opportunity from a lower price level.
On the monthly timeframe, strong selling pressure was evident, with the October 2025 close acting as a notable trap for buyers. However, the price has continued to rise without forming a new low, and it is currently trading above the 2.911 monthly flip zone. As long as the price remains above this critical monthly low, a potential bullish continuation can be expected. Although no significant market trend is visible on the weekly timeframe, investors should closely monitor how the price breaks out of the recent range-bound structure.
Despite extended selling pressure from the 16.67 swing high, the price has remained above the high-volume node since September 2025. As long as the price holds above the 2.706 high-volume level, the primary bias for this year remains in favor of long positions only.
On the main price chart, minor selling pressure is visible as the current price struggles to break above the upper Bollinger Band, which may create short-term pressure on buyers. However, the 50-day exponential moving average is positioned below the current price and is acting as dynamic support, along with the middle Bollinger Band.
In the secondary indicator window, the Relative Strength Index (RSI) remains stable above the 50.00 level and has room to move toward the 70.00 overbought zone.
Based on the overall market structure, MYX/USDT has a higher probability of extending its current bullish momentum. Additional confirmation may emerge from the lower timeframes. As the price is currently facing minor resistance, a short-term corrective move is possible, which could provide a valid bullish entry opportunity. On the upside, the immediate target lies at the 10.000 psychological level, followed by the 16.670 resistance zone.
On the bearish side, failure to hold above the 2.706 level could pose a challenge. A confirmed break below this level may lead to a test of the 1.626 support zone, which would be a critical low to monitor.
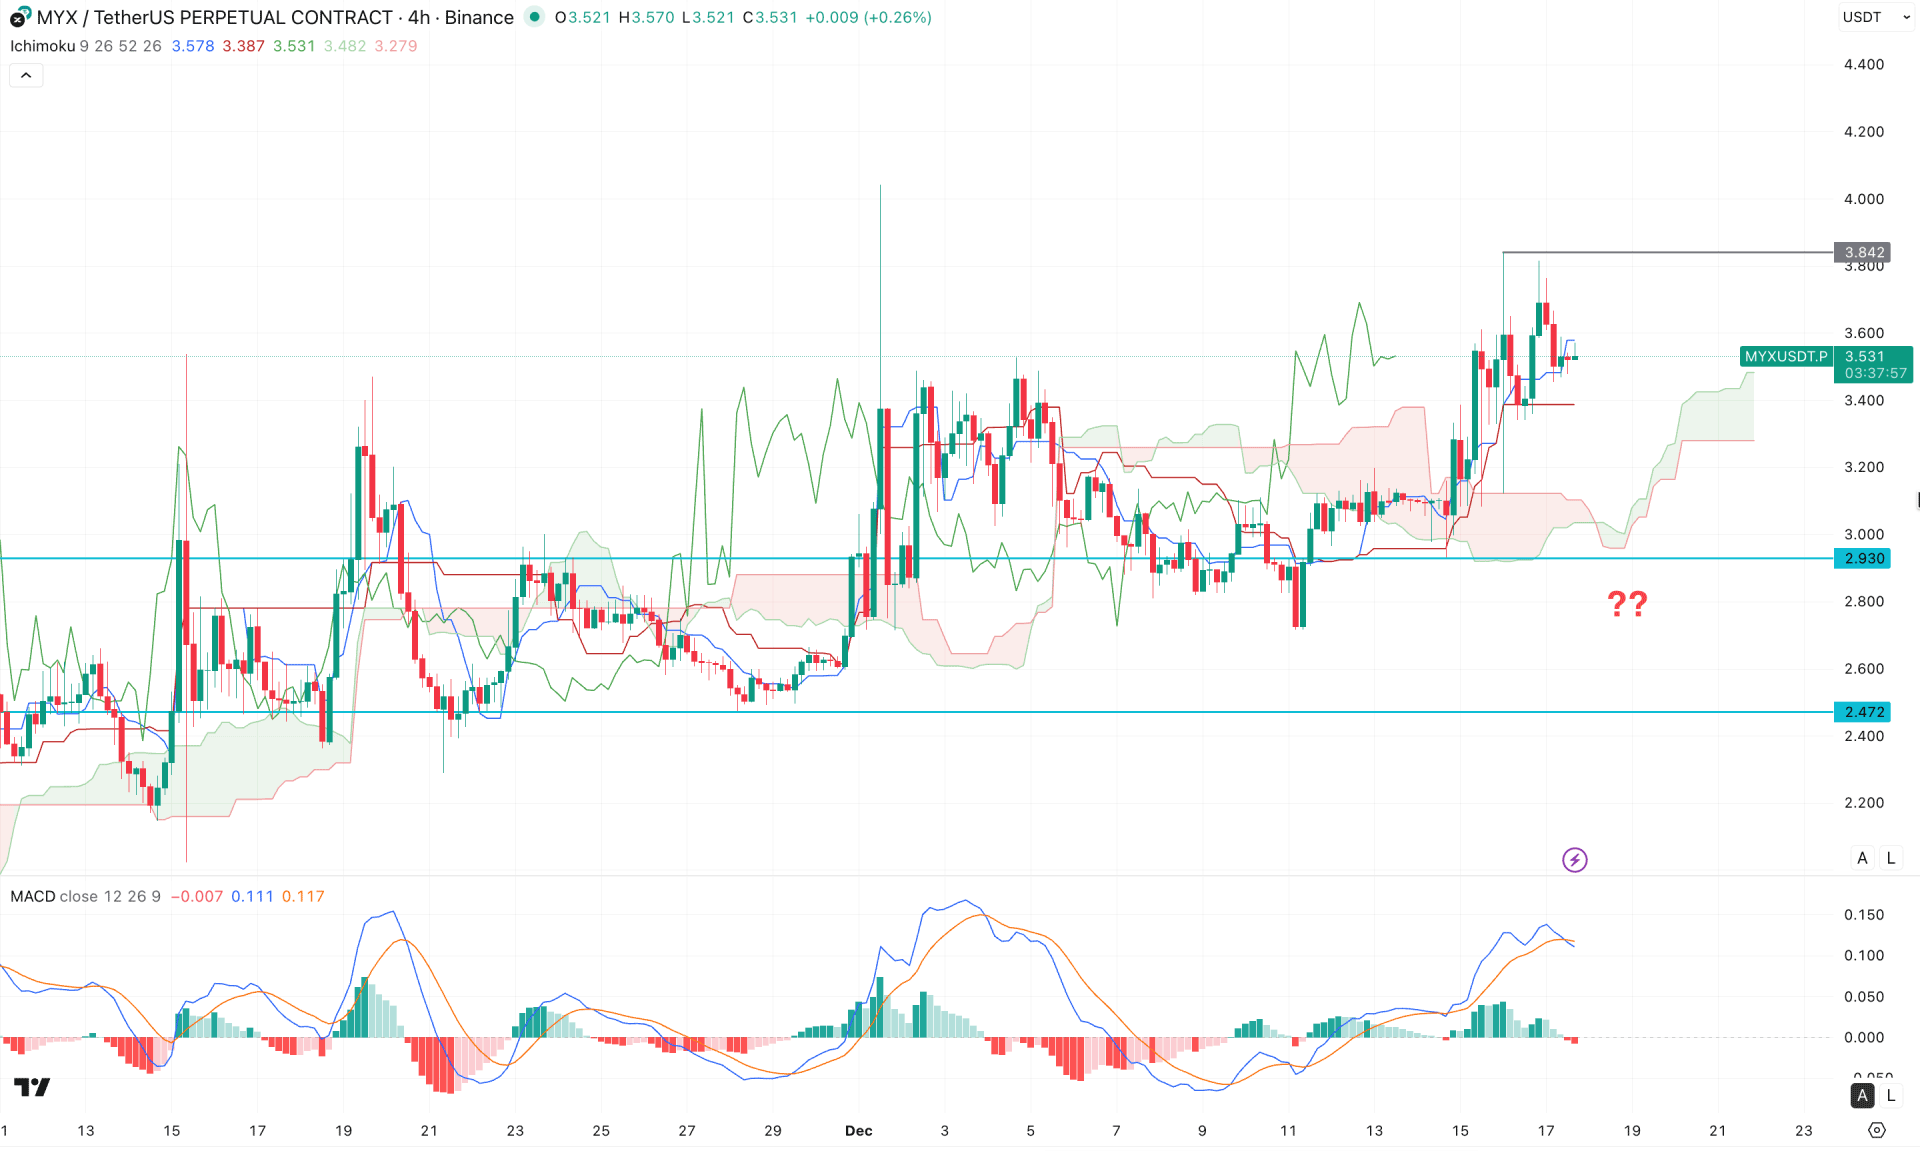
On the four-hour timeframe, a stable bullish recovery above the cloud area signals a potential trend reversal, from which a bullish continuation may develop.
Looking ahead, both Ichimoku lines are sloping upward, indicating trend confirmation. Additionally, the dynamic key level remains below the current price and is acting as immediate support.
In the secondary indicator window, a notable divergence has formed, as the MACD signal line failed to follow the price action by printing a new swing high. Moreover, the histogram has flipped below the neutral line, which may serve as an early indication of a short-term corrective move.
Based on the overall market structure, the gap between the current price and the cloud area suggests the possibility of a near-term bearish correction, with the cloud acting as the immediate level to monitor.
However, a measured rebound could emerge from the 3.400 to 3.000 support zone. A bullish confirmation candle above the Kijun-sen level would help validate a renewed bullish setup.
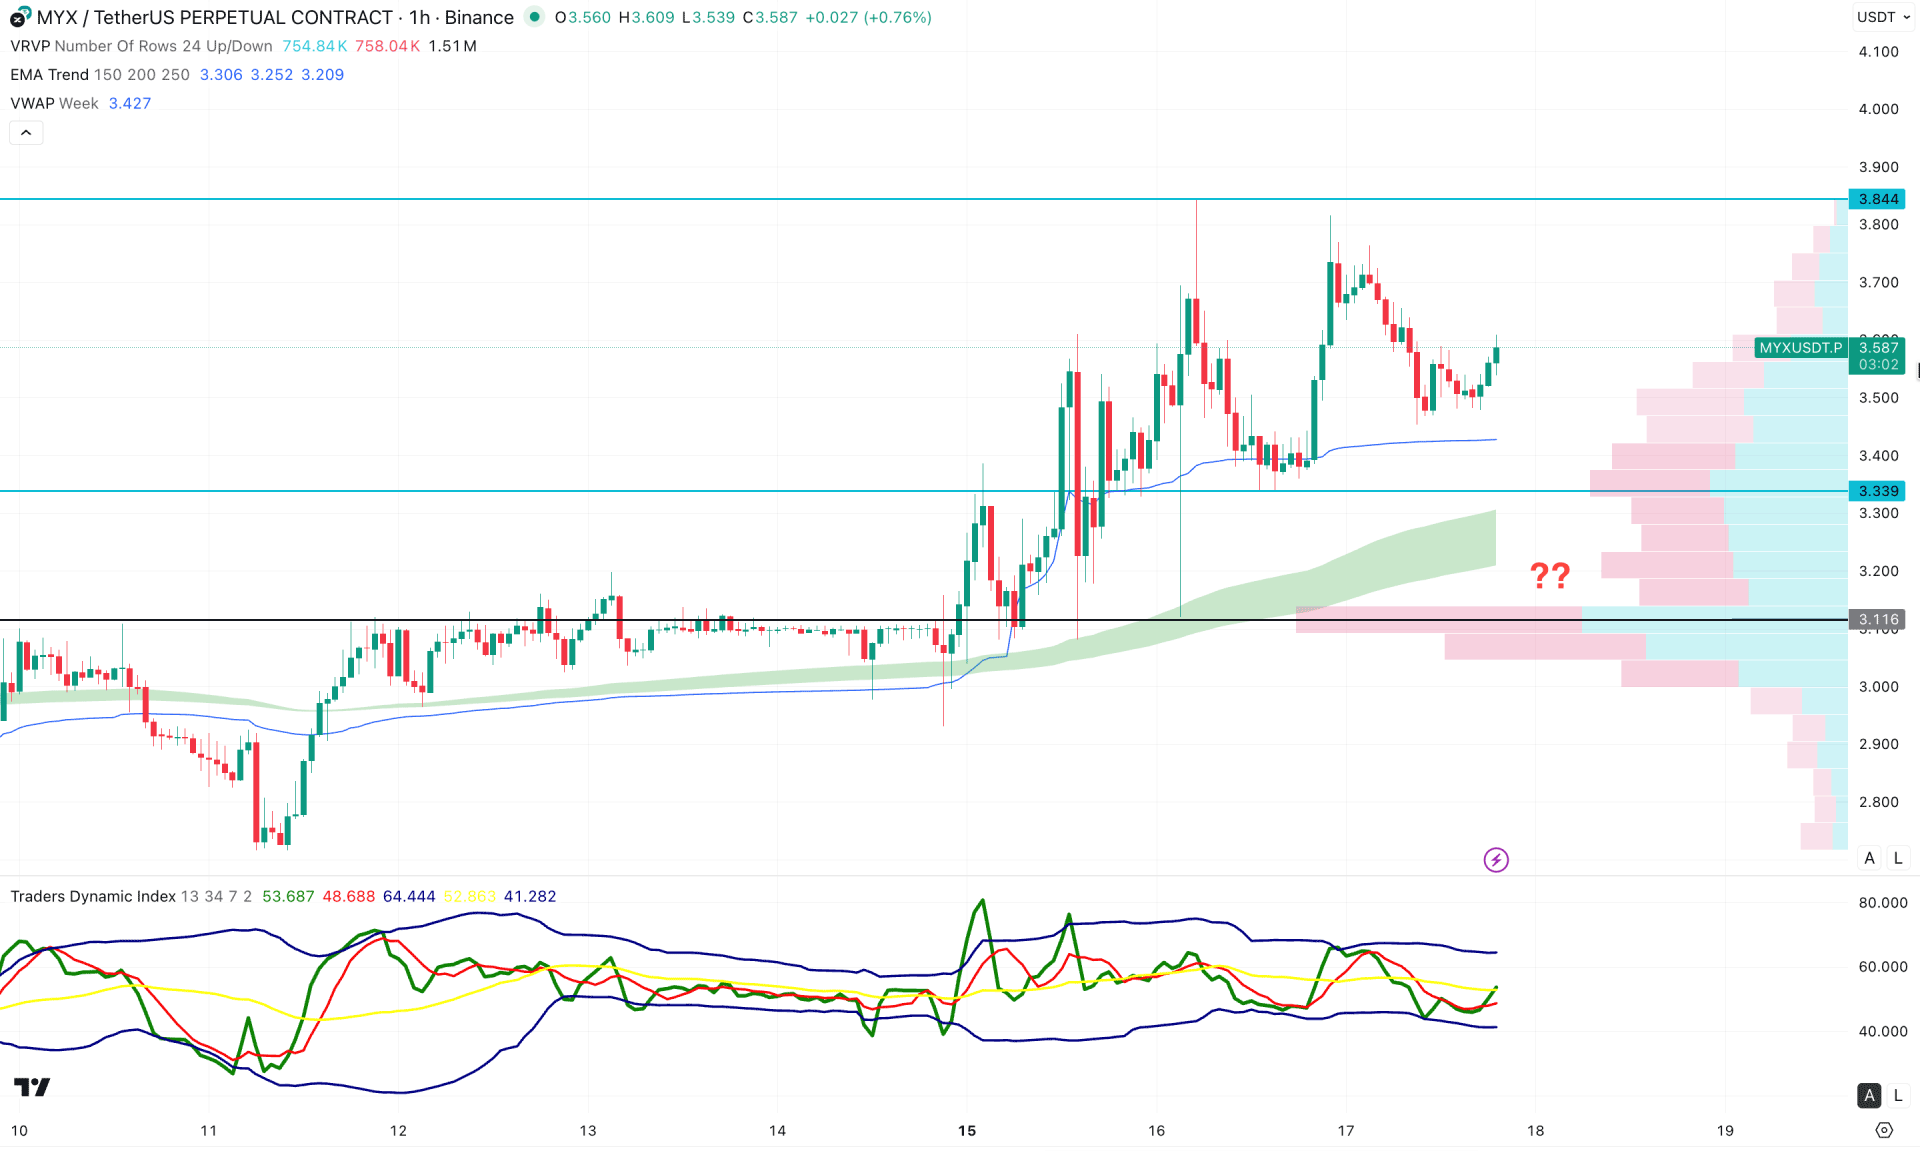
In the hourly timeframe, MYX/USDT is trading within a bullish trend, where the current price is hovering above crucial dynamic lines. The weekly VWAP is the immediate support above the EMA wave, where both are working as a strong support.
In the indicator window, the Traders Dynamic Index shows a rebound from the bearish peak, suggesting a limit to the selling pressure.
Based on this structure, the intraday bullish pressure is likely to extend, where the primary aim would be to overcome the 3.844 resistance level.
On the other hand, an immediate downside recovery below the VWAP line with an immediate recovery could be another long signal. An extended selling pressure below the 3.339 could lower the price towards the 3.000 level.
Based on the overall market structure, MYX/USDT has a higher possibility of extending higher as a part of the range extension. However, a valid bullish rebound towards the existing all-time high level needs closer attention to the daily chart for a decent downside correction.


