
Published: March 12th, 2024
MultiversX (EGLD) has recently implemented decentralized derivatives trading, which enables users to execute intricate financial strategies, protect against exposure to other assets, and expand their investment choices. This integration takes advantage of the transparency and security inherent in blockchain technology.
With its native token, EGLD, MultiversX is an industry leader in both cryptocurrencies and blockchain technology. MultiversX, constructed upon the Elrond blockchain, is renowned for its robustness and expeditious transaction rates. EGLD facilitates decentralized application utilization, smart contract interactions, and transactions within the network. The project aspires to a bright and promising future in which EGLD is pivotal for many blockchain-based endeavors.
In addition to the recent enhancement, MultiversX remains a subject of fascination due to its steadfast dedication to scalability, security, and efficiency. The Elrond blockchain allows MultiversX to process transactions for an expanding user base efficiently. User funds and transactions are protected by robust security measures, while the platform strives to provide developers and users with a streamlined and cost-effective experience.
MultiversX (EGLD) is, in essence, making rapid strides toward implementing decentralized derivatives trading. The project's commitment to scalability, security, and efficacy establishes it as a strong competitor in the continuously evolving blockchain industry.
Let’s see the upcoming price direction of this instrument from the EGLD/USDT technical analysis:
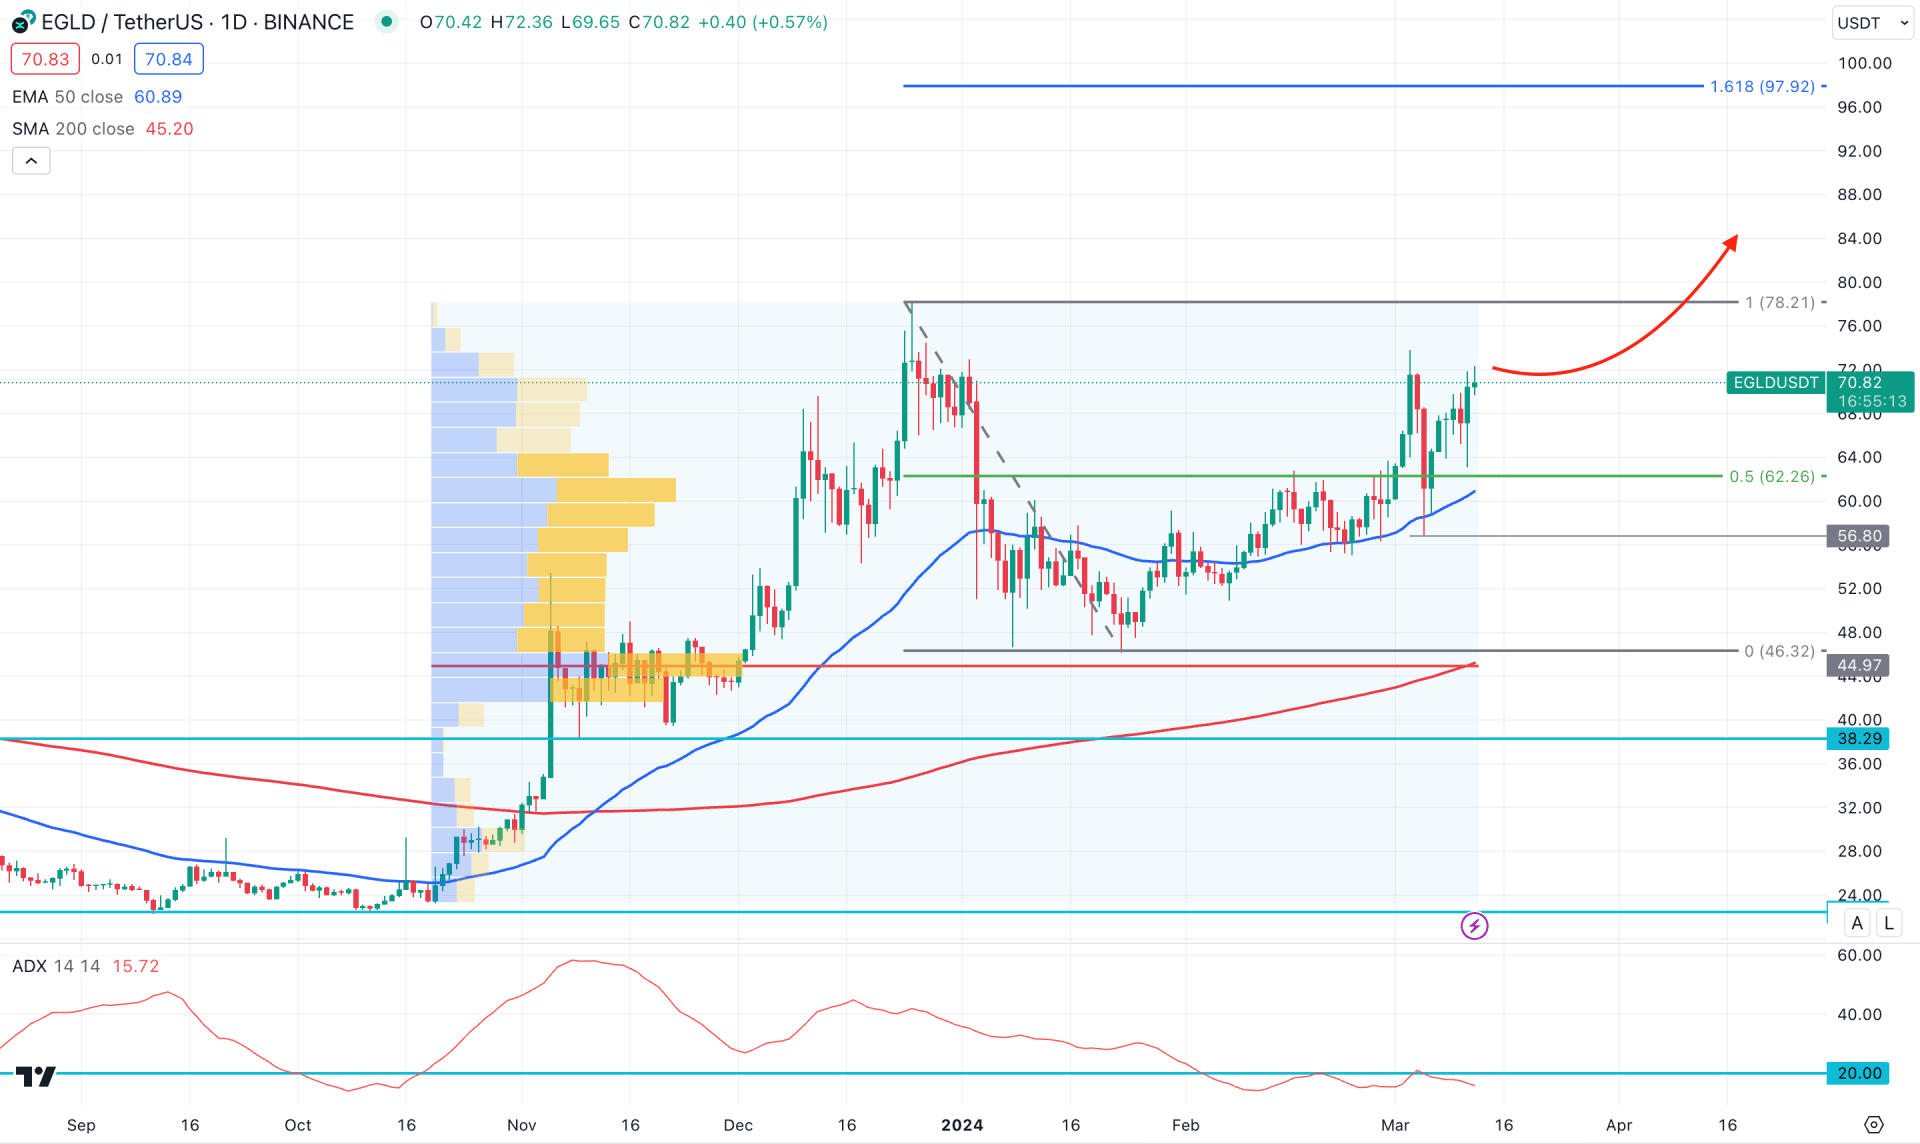
In the daily chart of EGLD/USDT, the ongoing market momentum is bullish as the recent price is getting support from the 50-day Exponential Moving Average level.
After making a new swing high at the 78.21 level, EGLD showed a decent bearish recovery and found a bottom at the 46.32 level with a 40.58% loss. However, the price rebounded higher from this level and formed a stable momentum above the 50-day EMA line. In that case, investors should monitor how the price trades above this crucial dynamic line, which is acting as a bullish pre-breakout momentum.
In the higher timeframe, the current monthly candle is bullish, supported by the bullish two-bar reversal in the previous month. Moreover, the latest weekly candle suggests a bullish inside bar formation, suggesting a bullish continuation opportunity.
Regarding the volume structure, the most active level since 16 October 2023 suggests buying pressure as the crucial high volume level is marked at the 44.97 level, which is below the current price. Moreover, the 200-day Simple Moving Average level has an upward slope reaching the high volume level. It is a sign of a confluence of bullish factors in the daily chart, which could extend the ongoing market momentum.
Moreover, the secondary indicator window shows a different story. Despite the ongoing buying pressure, the ADX failed to provide a decent momentum as the current reading is below the 20.00 line.
Based on the daily market outlook of EGLD, the buying pressure is solid, and the Golden Cross continuation strategy could be a potential long opportunity, targeting the 97.92 level. Moreover, investors should monitor how the price tests the 100.00 psychological level as a stable momentum above this line could extend the momentum above the 150.00 area.
On the bearish side, the 56.80 level could be a crucial line to look at, as a bearish break below this line might eliminate the bullish outlook and lower the price toward the 36.00 level.
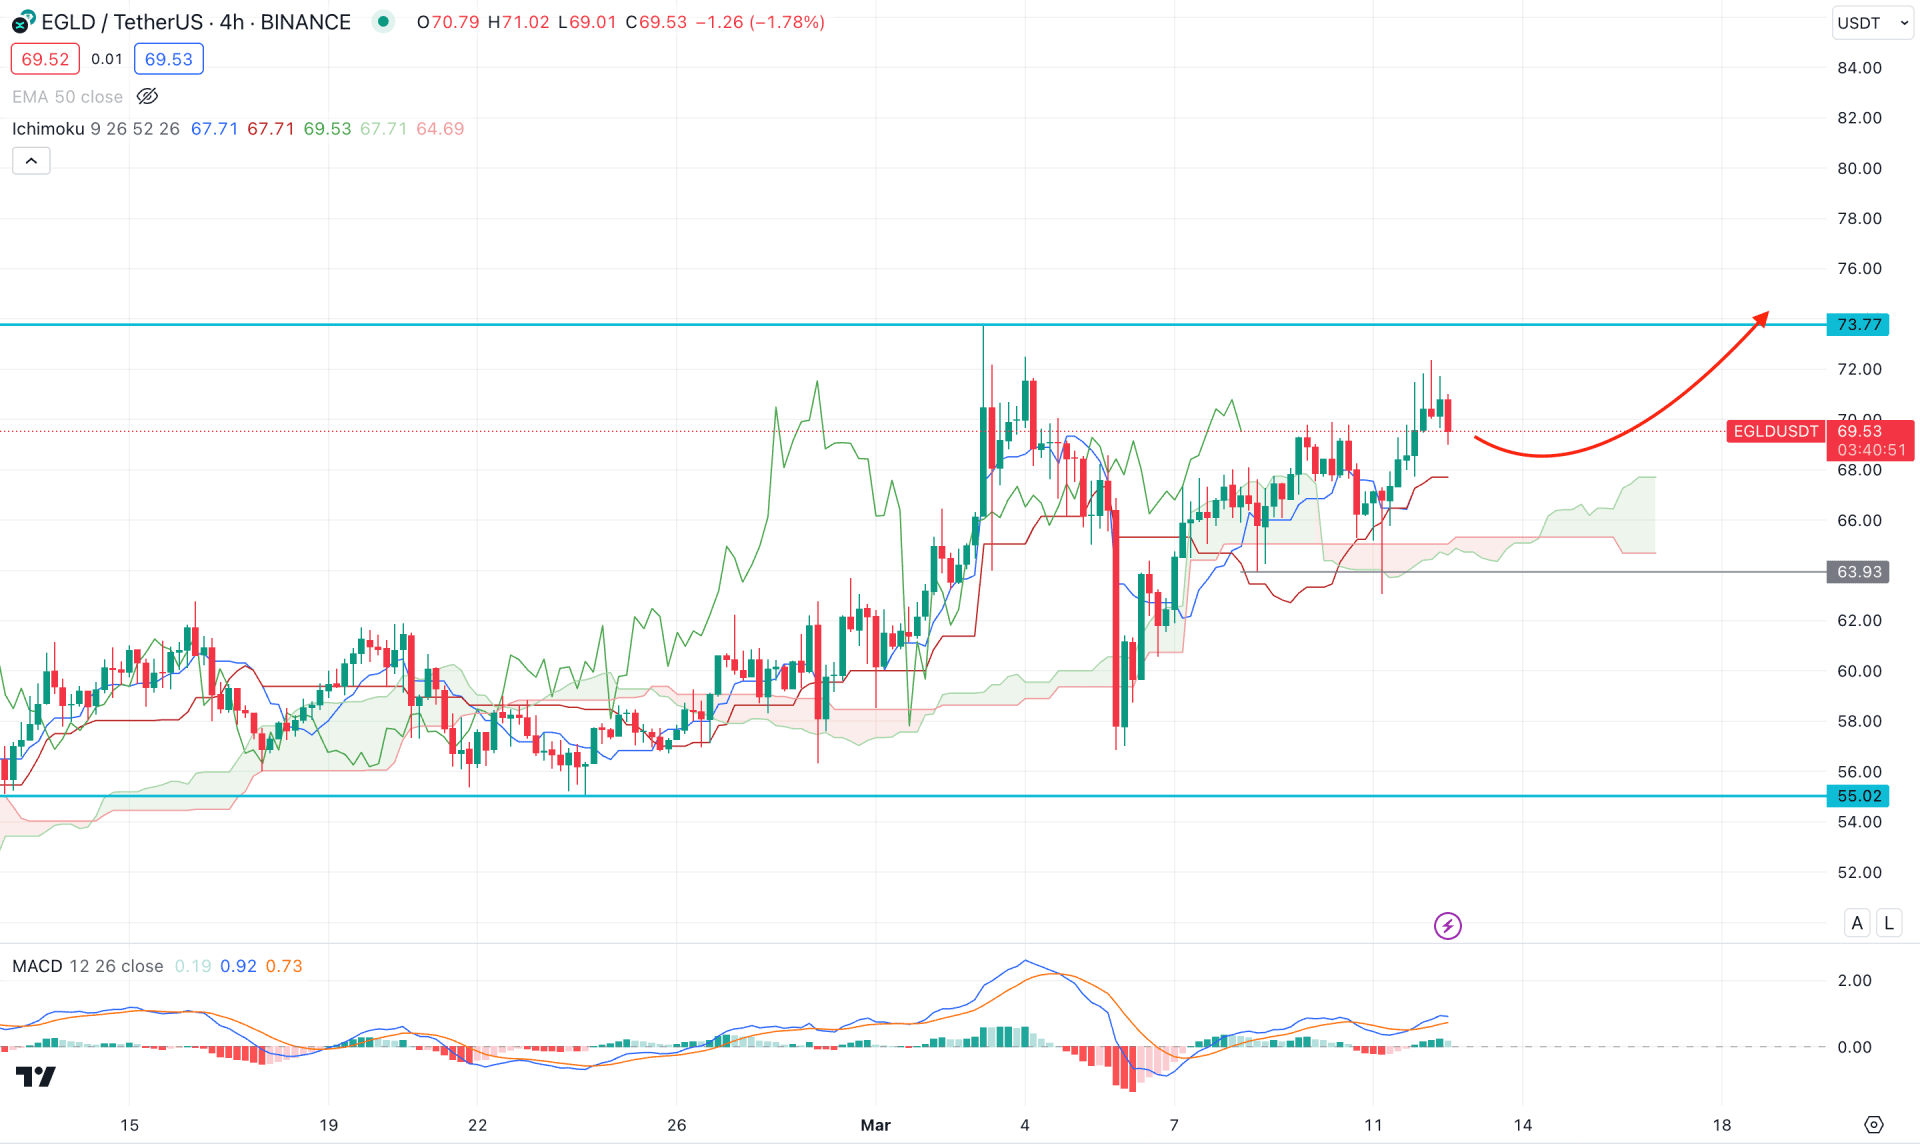
In the H4 chart, the broader market context is corrective, where the future cloud suggests a strong bullish signal. As per the current reading, the Senkou Span A is above the Senkou Span B, which suggests a possible buying pressure.
In the secondary window, the current MACD Histogram hovers at the neutral zone, with a PNP formation. Moreover, the signal line is above the Histogram with a bullish signal.
Based on the H4 outlook, any minor downside correction could be a potential long opportunity. The first buying pressure might come from the 68.00 to 64.00 zone, depending on how the price reacts in this zone.
On the other hand, an immediate selling pressure with a bearish H4 candle below the 63.80 level might reverse the current trend and lower the price in the coming hours.
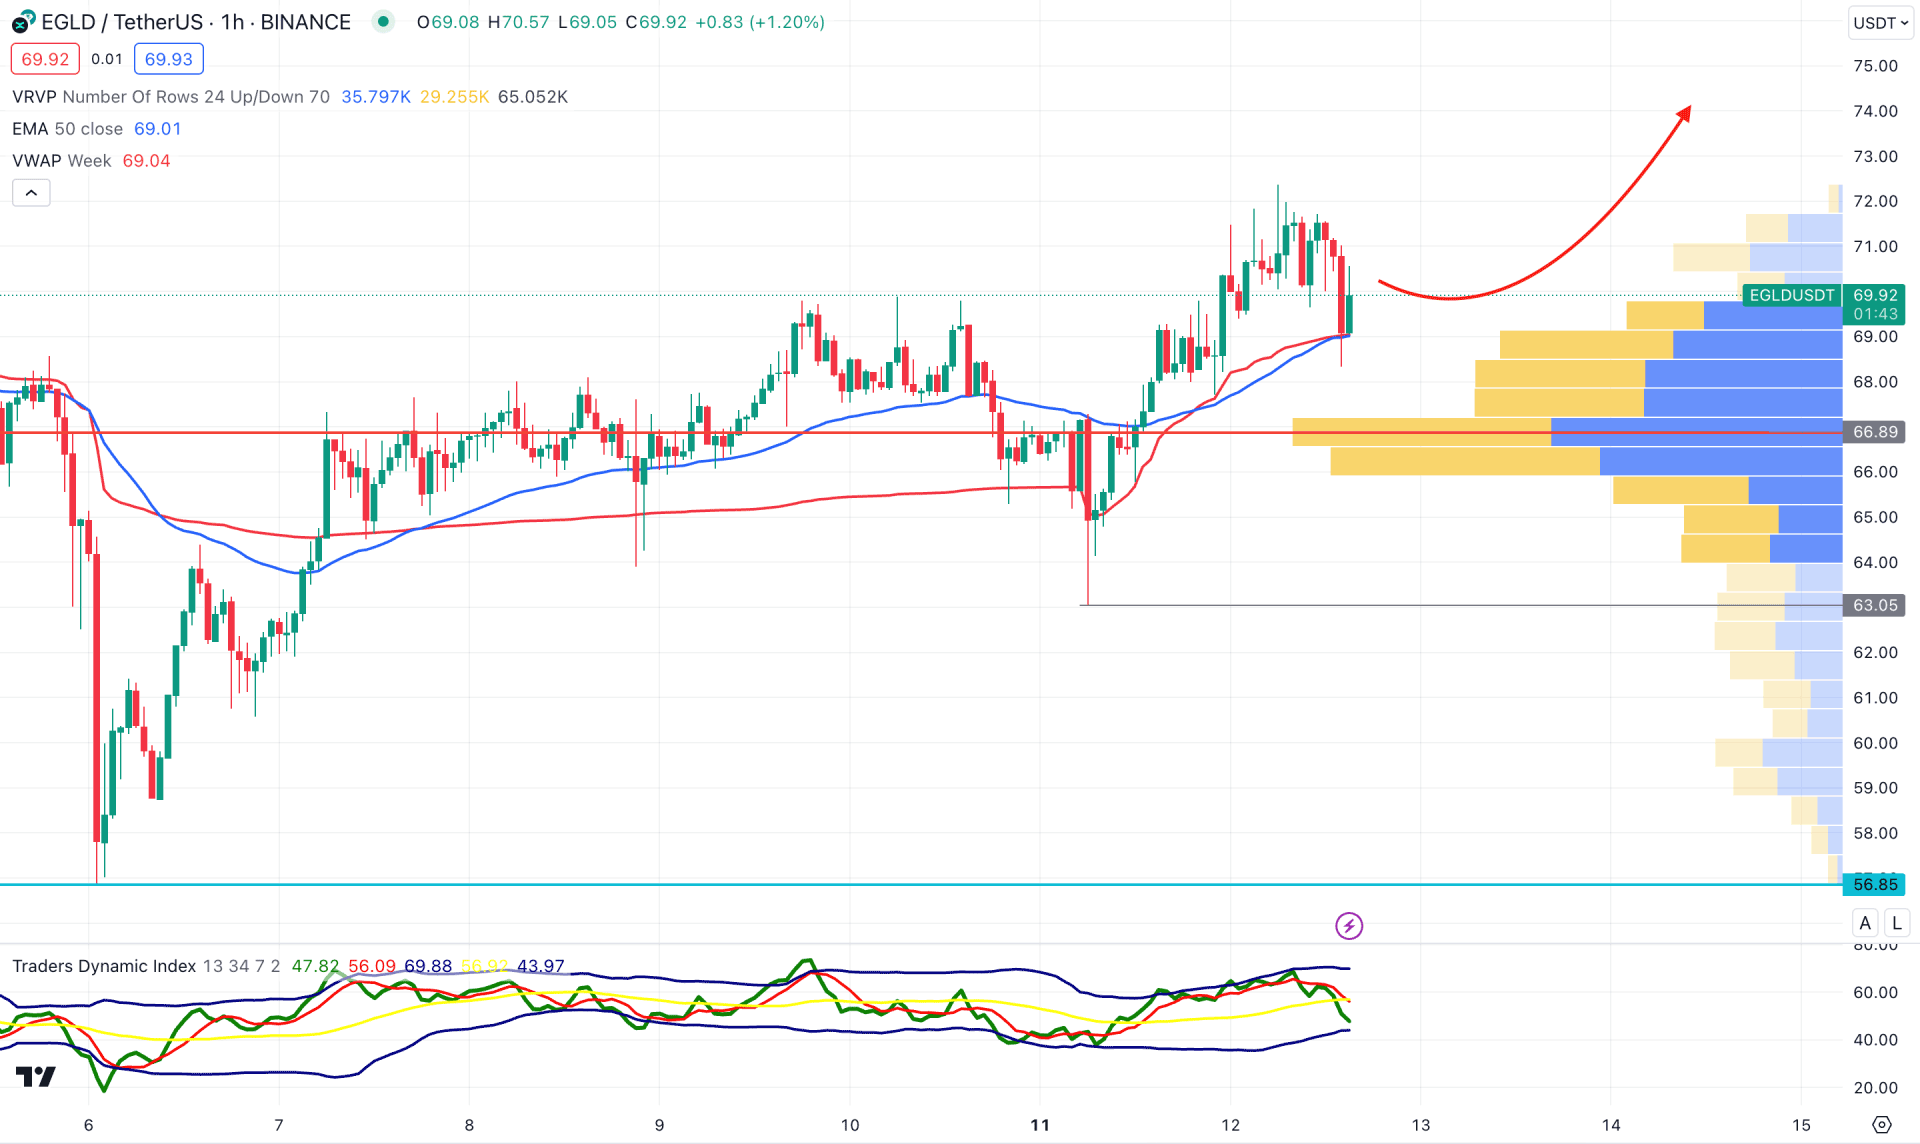
In the hourly chart, the current market pressure is bullish as the currently visible range high volume level is below the current price. Moreover, the dynamic 20 EMA works as an immediate support above the visible range level.
In the secondary window, the Traders Dynamic Index suggests a selling pressure as the current level is below the 50.00 line.
In that case, a downside continuation is possible, where a bullish reversal from the 66.00 to 62.00 zone could be a valid long opportunity, targeting the 76.00 level.
However, a deeper selling pressure with an hourly candle below the 63.00 level might alter the current structure and extend the bearish pressure.
Based on the current market outlook of EGLD/USDT, the broader market context is bullish, and investors might expect the price to continue to increase after a decent downside correction. In this context, the Golden Cross continuation strategy could create a trading opportunity in this pair.


