
Published: April 27th, 2023
MultiversX (EGLD) showed amazing upward pressure in recent days, which might offer a decent bullish opportunity. The price surged over 33% in the last three days, with an increase in trading volume. It is a clear sign that Whales are involved in the instrument, and any stable buying momentum could be an investment opportunity.
MultiversX (EGLD), a metaverse-centric project formerly known as Elrond, has confirmed the successful launch of a number of new products in the first quarter of 2023. The objective of these products is to drive more users to the protocol. On March 31, a series of tweets announced the release of xPortal, MultiversX Bridge, MultiversX Wallet, MultiversX Explorer, and MultiversX Explorer.
Elrond was renamed MultiversX in November 2022 and rebranded as a decentralized blockchain network concentrating on the metaverse. According to data from DefiLlama, MultiversX's DeFi TVL has remained at its June 2022 level despite introducing new products and rebranding. As of press time, the protocol's TVL was $78.71 million, a 6% decline from the start of the year.
Recent weeks have witnessed a significant decline in protocol user activity. According to data from Artemis, the number of daily active addresses on MultiversX has decreased by 76% in the last month, while the total number of on-chain transactions has decreased by 80%.
Let’s see the upcoming price direction of MultiversX from the EGLD/USDT technical analysis:
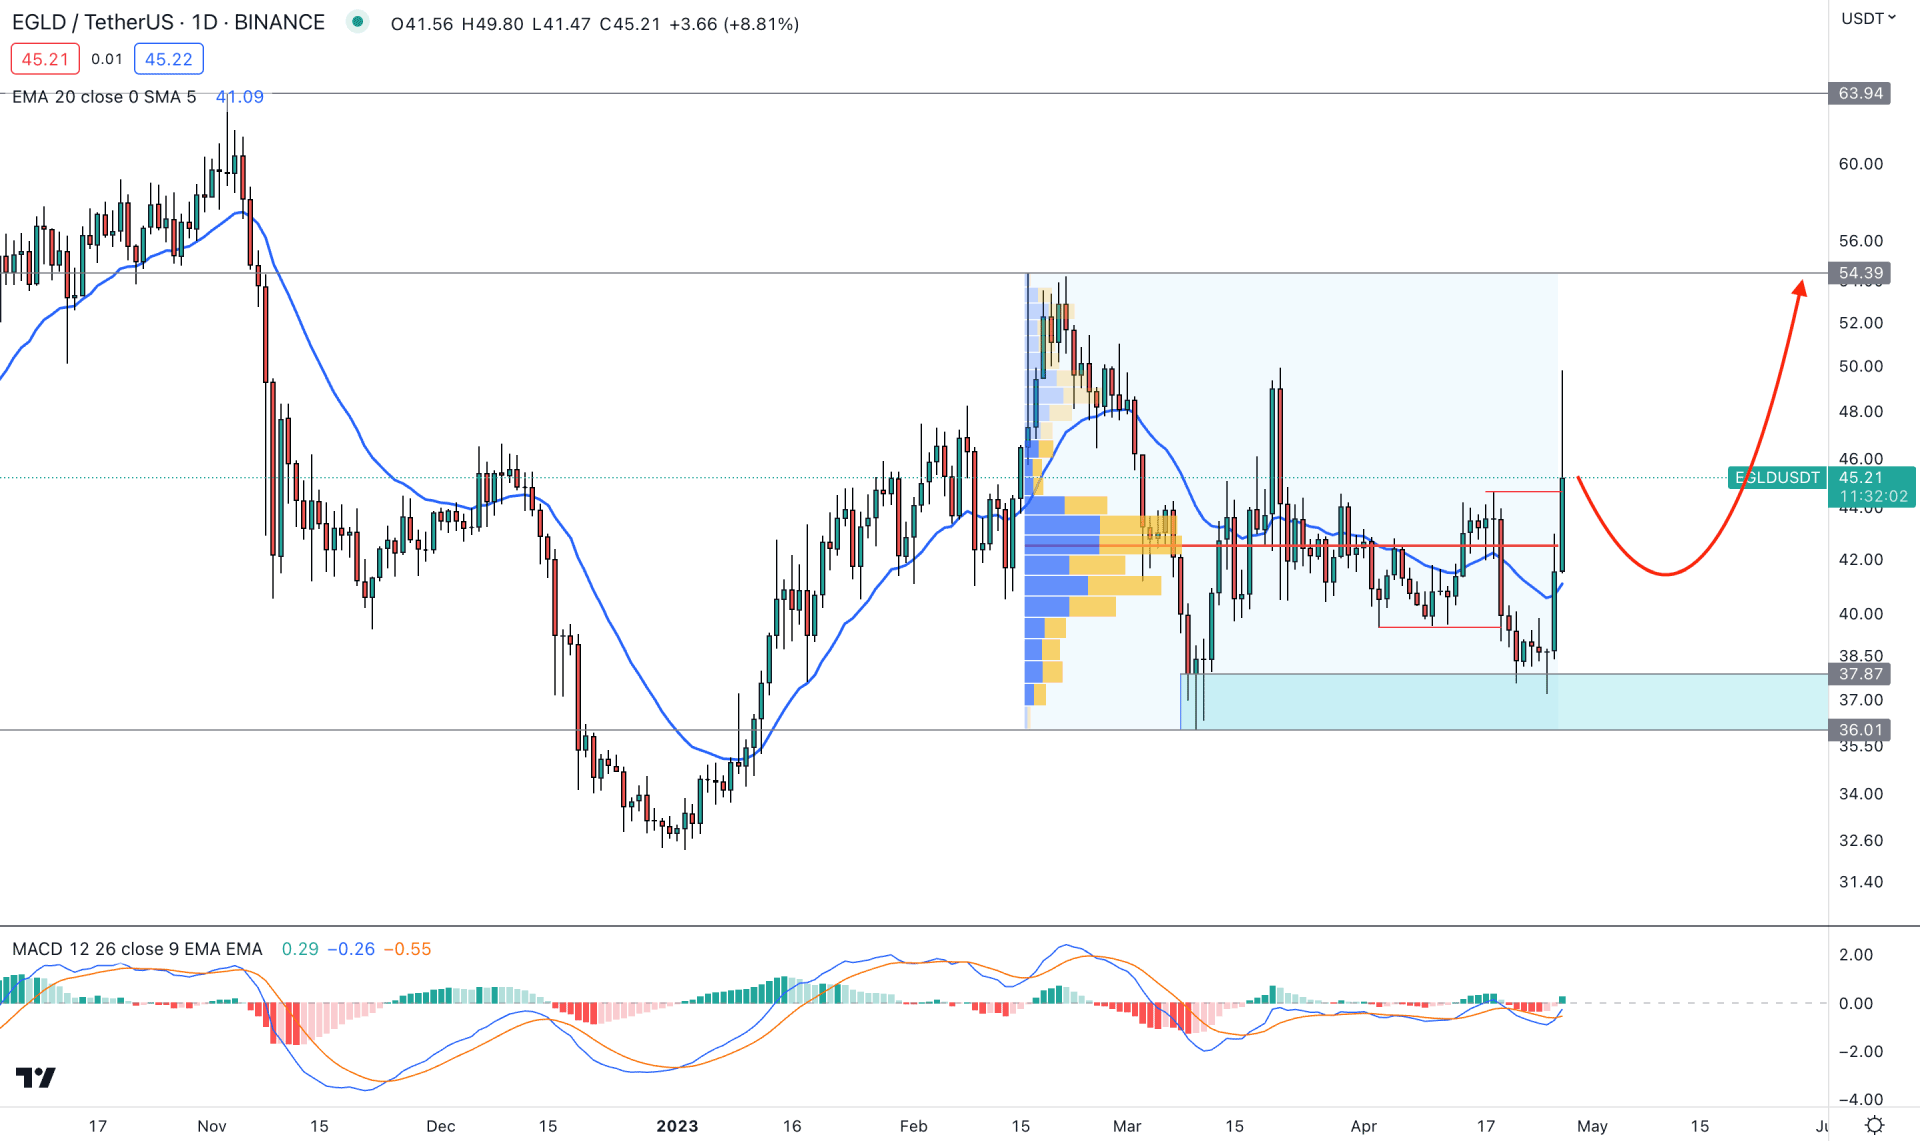
In the daily chart, the current market structure is corrective, but strong buying pressure is possible due to the recent change of character. In the current swing the lowest point of 37.20 is validated by a new swing high above the 44.64 level. Therefore, 49.78 high to 37.20 low would be a good tradable area from where any bullish opportunity from the discounted zone needs to be monitored.
If we draw a Fibonacci Retracement level from this swing, we will find the 43.03 to 37.20 area as a valid discounted zone from where a buying pressure may come. Moreover, the previous swing low on 10 March 2023 came with a valid demand zone, which was retested on 25 April. As the price already visited the demand area, we may expect a buying pressure to come without a liquidity sweep from the 37.20 low.
According to the fixed range high volume level indicator, the latest high volume level is spotted at the 42.51 level. As the current price is above this level, a bullish rebound is possible at any time.
In the main window, a strong bullish price action is visible above the dynamic 20 EMA support, while a minor downside correction is pending as a mean reversion.
Another bullish signal is present at the indicator window, where the MACD EMA formed a bullish crossover from the bearish zone. Also, the MACD Histogram turned bullish and waited for the validation with a new bullish daily close.
Based on the current daily outlook, the 42.50 to 38.64 area would be a strong buying zone for this instrument. Investors should closely monitor the intraday price action to find a decent trading opportunity.
However, a break below the 36.70 level would alter the current market structure, which may open a short opportunity after a considerable bullish correction.
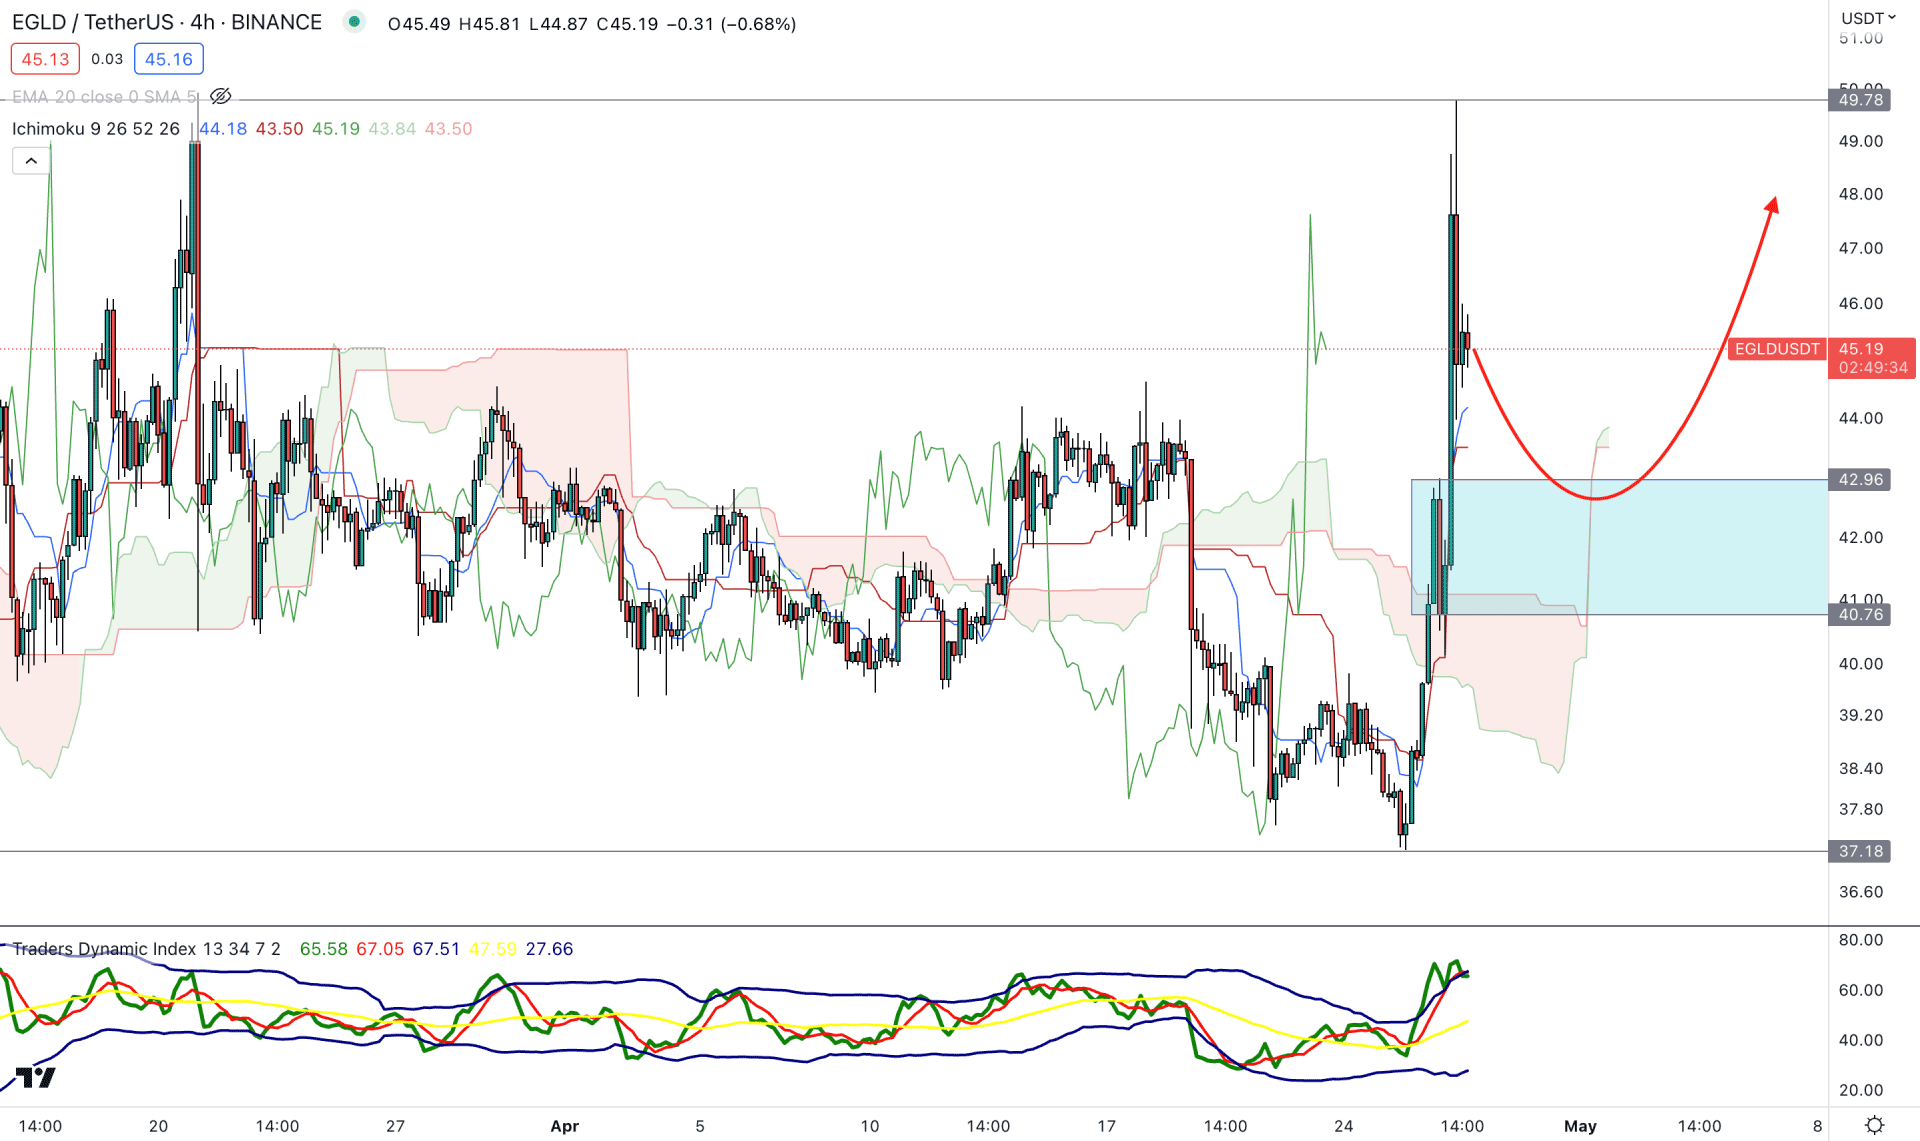
In the H4 chart, a valid bullish breakout above the Ichimoku Kumo Cloud is visible, which is a sign of a strong bullish trend. However, a sufficient bearish correction is pending before offering a long opportunity.
In the future cloud, the thickness is not solid, but the Senkou Span A is above B. Therefore, an internal liquidity build with a sell-side sweep is pending in this pair before forming a stable buying pressure.
Based on this outlook, an upside pressure may come after visiting the 47.96 to 40.76 zone with a new H4 candle above the Kijun Sen level. However, breaking below the 40.00 level could lower the price towards the 36.00 area.
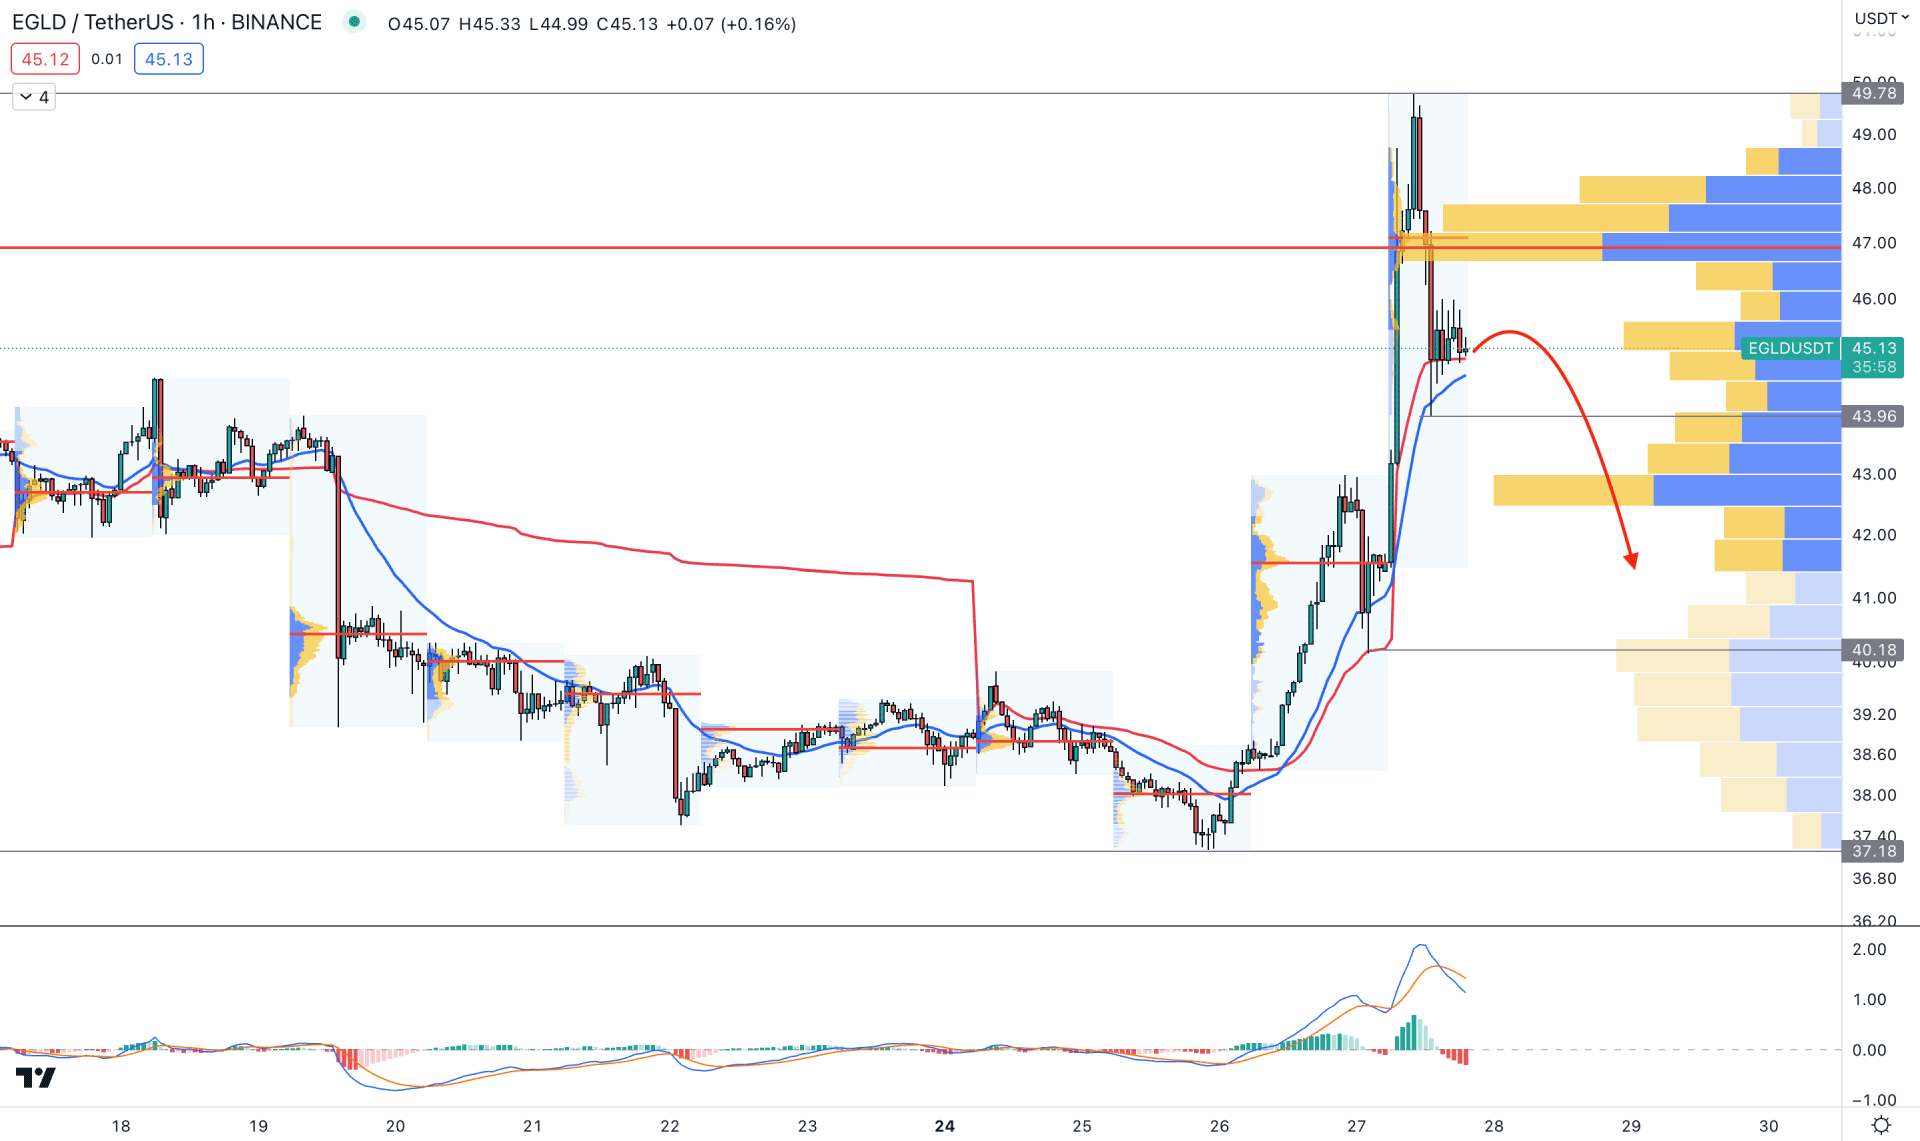
In the hourly chart, a bearish pressure is potent as the recent buying momentum was eliminated with a strong rejection at the visible range high volume area.
In the main chart, the dynamic 20 EMA and weekly VWAP are working as immediate support, where a break below this level could increase the bearishness.
In the indicator window, the bearish possibility is strong as the current MACD EMA formed a bearish crossover from the overbought area.
Based on this outlook, investors might expect bearish pressure after violating the 43.00 level. It may extend the downside momentum towards the 38.00 level. However, bullish exhaustion and new high-volume level formation could eliminate the current structure at any time.
Based on the current technical analysis, EGLD/USDT could continue pushing higher after completing the downside correction in the intraday chart. A high probable bullish opportunity needs a new internal liquidity formation in the H4 chart.


