
Published: January 29th, 2025
Amid a flurry of optimistic news, the Movement (MOVE) token saw an incredible jump on Tuesday, rising as much as 20%. High-profile investments and conversations about using blockchain technology in U.S. government operations were two primary triggers for this rise.
Important news, such as World Liberty Financial's $2 million investment in MOVE tokens supported by Donald Trump's family – fueled the upward momentum. According to the blockchain data, the acquisition was made through a series of transactions throughout the morning hours in the United States.
Moreover, Movement is one of the blockchain projects discussed with DOGE officials. The project focuses on applications that include tracking federal expenditures, protecting sensitive data, and handling payments.
According to reports, Elon Musk, who heads the Department of Government Efficiency, is looking into blockchain technology to cut costs and improve government processes. The fact that Movement is being discussed here highlights how important it is becoming in the blockchain industry.
The movement's scalability and technical architecture have drawn notice, but its participation in crucial government debates has cemented its place as a major force in the blockchain ecosystem. The potential of blockchain technology to close the gap between decentralized finance and government operations is highlighted by the combination of institutional interest and real investment.
Let's see the upcoming price direction from the MOVE/USDT technical analysis:
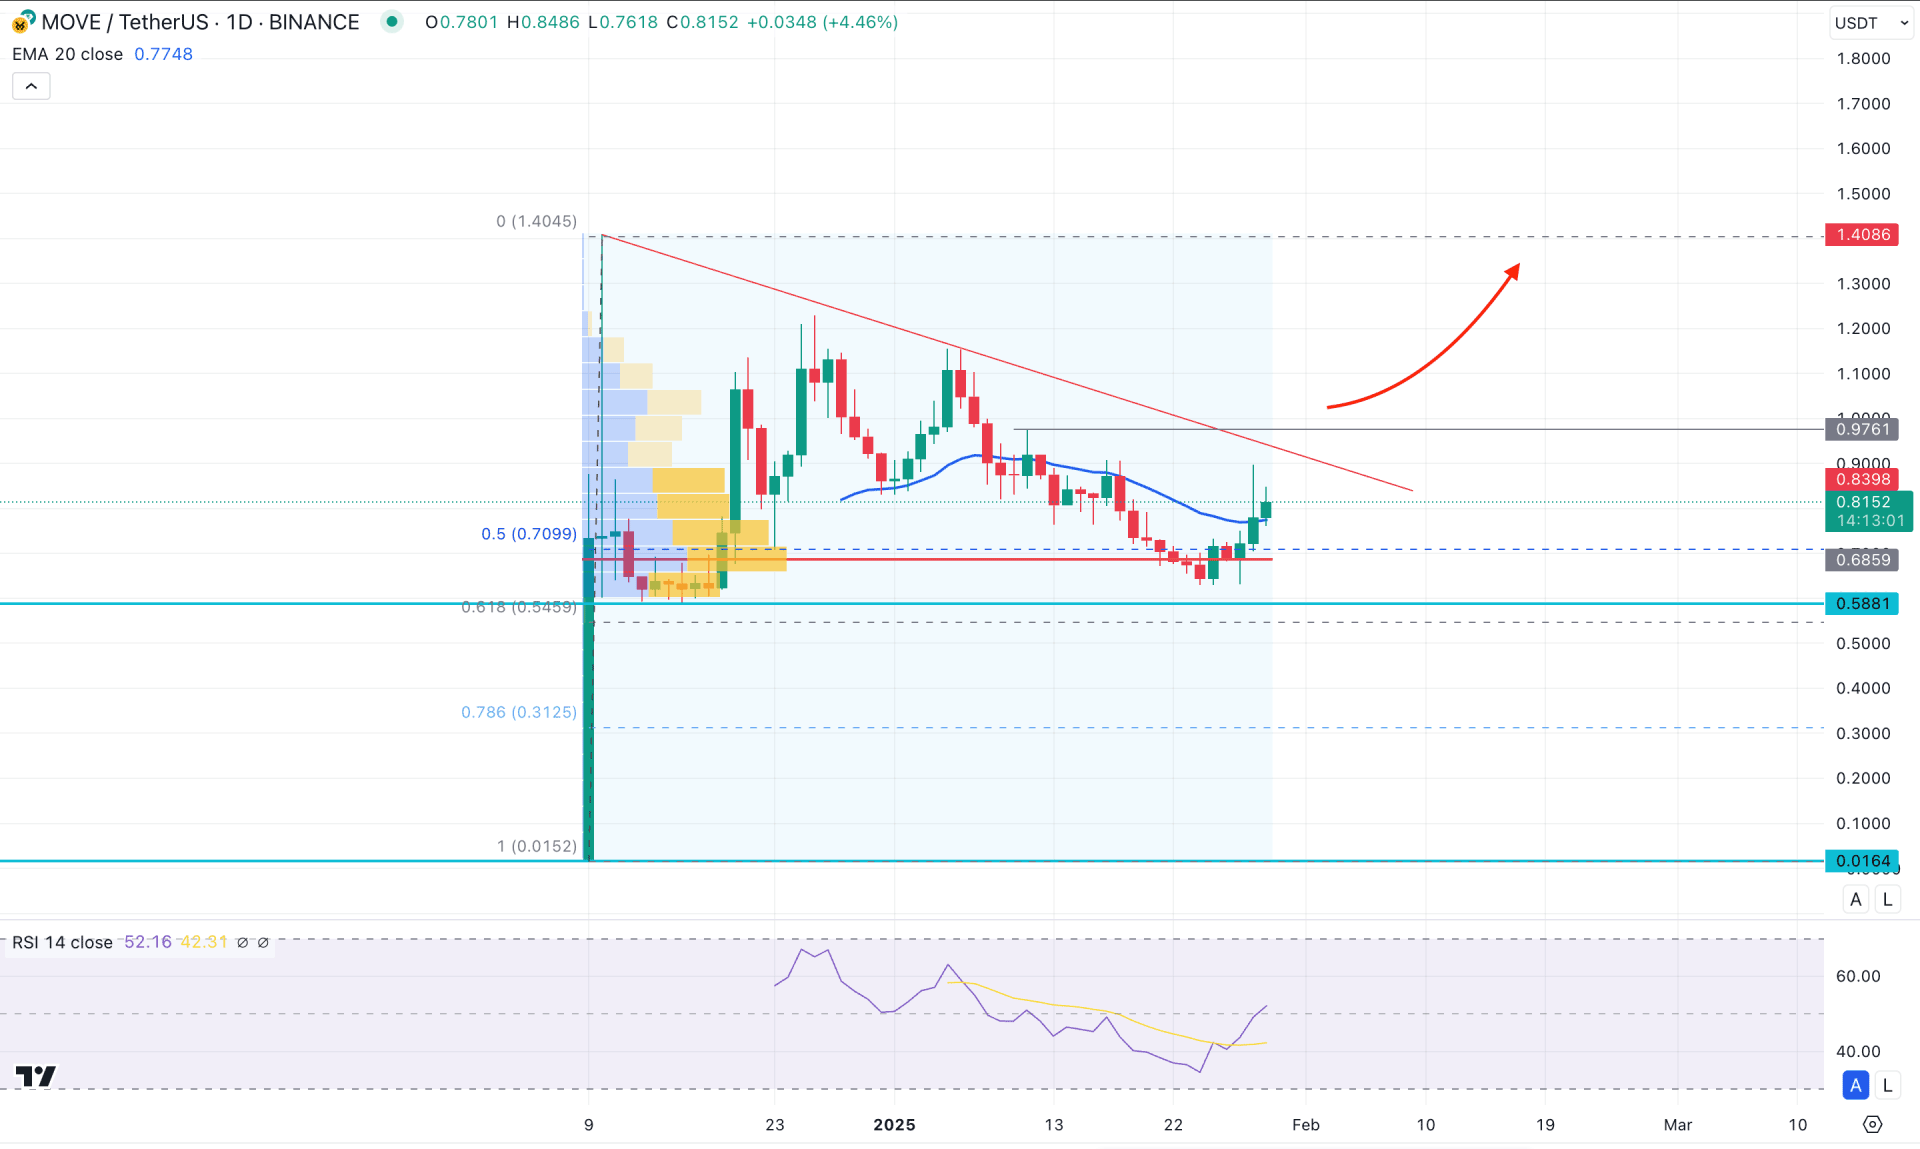
In the daily chart of MOVE/USDT, the Binance launch showed a decent price surge, forming a 9000% gain in a single day. However, the profit-taking from early investors took the price down, where a corrective downside pressure is visible. Primarily, the upward possibility for this token is already high, signalling a long approach from a reliable price area.
Looking at the broader structure, the 50% Fibonacci Retracement level from the all-time high and low is at 0.7099 level. As the latest price showed a bullish reversal from this level, we may consider it as buyers attempt to join the market. However, a proper upward signal might need more clues from the higher timeframe.
In the weekly candlestick pattern, the recent price showed selling pressure for three consecutive weeks. Finally, bulls have found relief in the possibility of an upward move, as the current price is hovering above the previous weekly high. In that case, a valid weekly candle close above the 0.7914 level could signal a bullish engulfing candlestick pattern.
The volume structure shows a positive outlook for bulls, where the current high volume line from the Binance launch is at the 0.6859 level. As the current price is aiming higher with a bullish rebound from the high volume line, the price could extend the upward pressure in the coming days.
In the main price chart, the 20-day Exponential Moving Average is below the current price, working as an immediate support. Moreover, a bullish V-shape recovery is seen from the dynamic line, where a valid breakout could be a potentially long signal.
In the indicator window, the Relative Strength Index (RSI) found a bottom and rebounded above the 50.00 neutral line. Overcoming this line signals potential buyers' attempts, which can lead the RSI level towards the 70.00 overbought area.
Based on this outlook, a valid trendline breakout with a daily close above the 0.9761 level could validate the bullish long opportunity, aiming for the 1.4086 level. However, a range extension from the current area could find a dip from the 0.3125 level (78.6% Fibonacci Retracement level), from where a secondary long approach might come.
On the other hand, a corrective price action above the 20 day EMA line with an immediate reversal could signal more discount to the price. In that case, a daily candle below the 0.5881 level might lower the price towards the 0.4000 area soon.
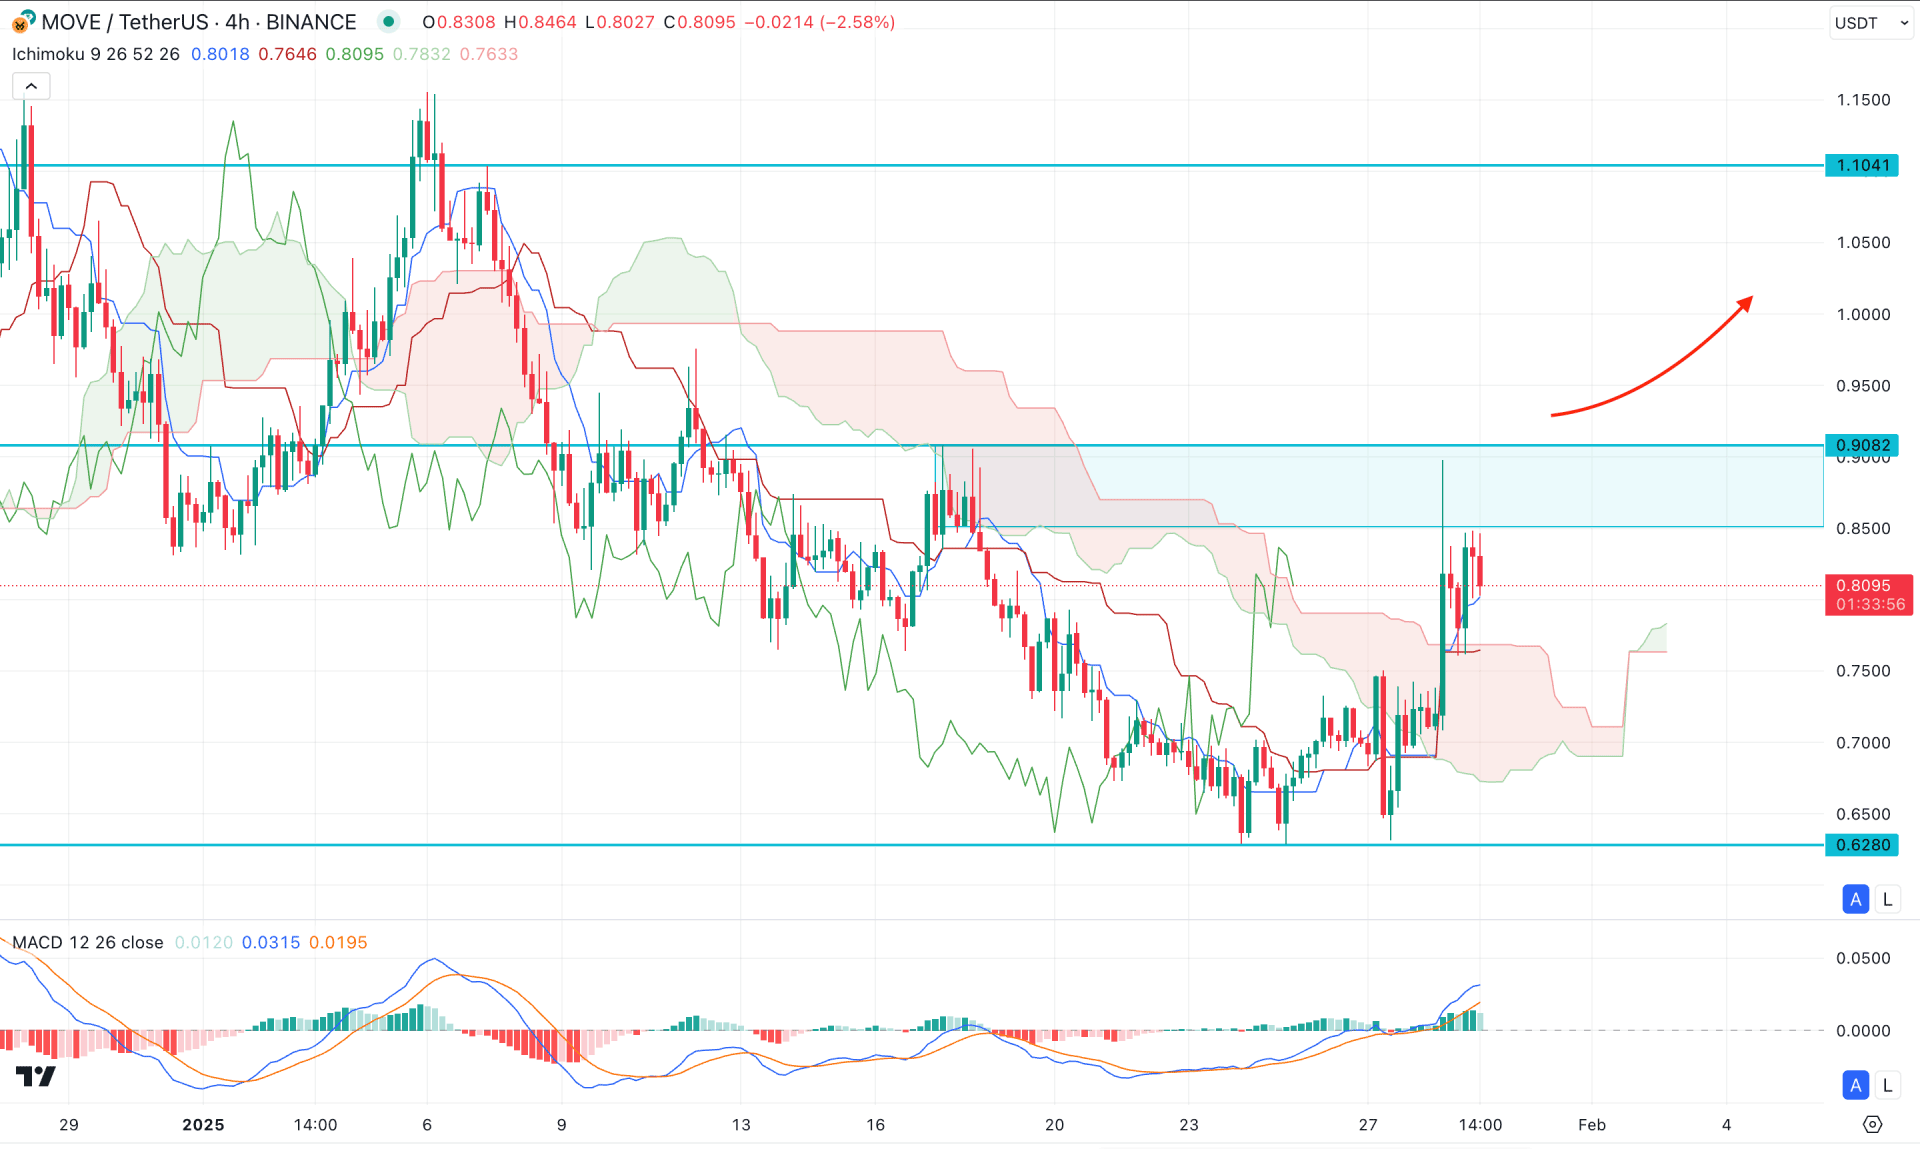
In the H4 timeframe, the ongoing bearish pressure is still present. The latest supply zone is marked at the 0.9082 - 0.8500 area. As immediate selling pressure is visible from the supply area, investors are likely to expect a bearish continuation until the 0.9082 high is breached.
In the Ichimoku Cloud zone, the Future Cloud has flipped its position, where the current Senkou Span A is aiming higher than the Senkou Span B level. Moreover, a bullish breakout is seen from the Cloud zone but the price is still indecisive above the support.
Based on the H4 structure, a valid bullish CHoCH pattern might come after overcoming the 0.9082 level, which will be the first sign of a bullish reversal. However, a trading entry might come after having a potential discounted price once a new high is formed.
Alternatively, a bearish MACD Histogram with an H4 candle below the dynamic Kijun Sen could initiate the bearish trend, aiming for the 0.6280 support level.
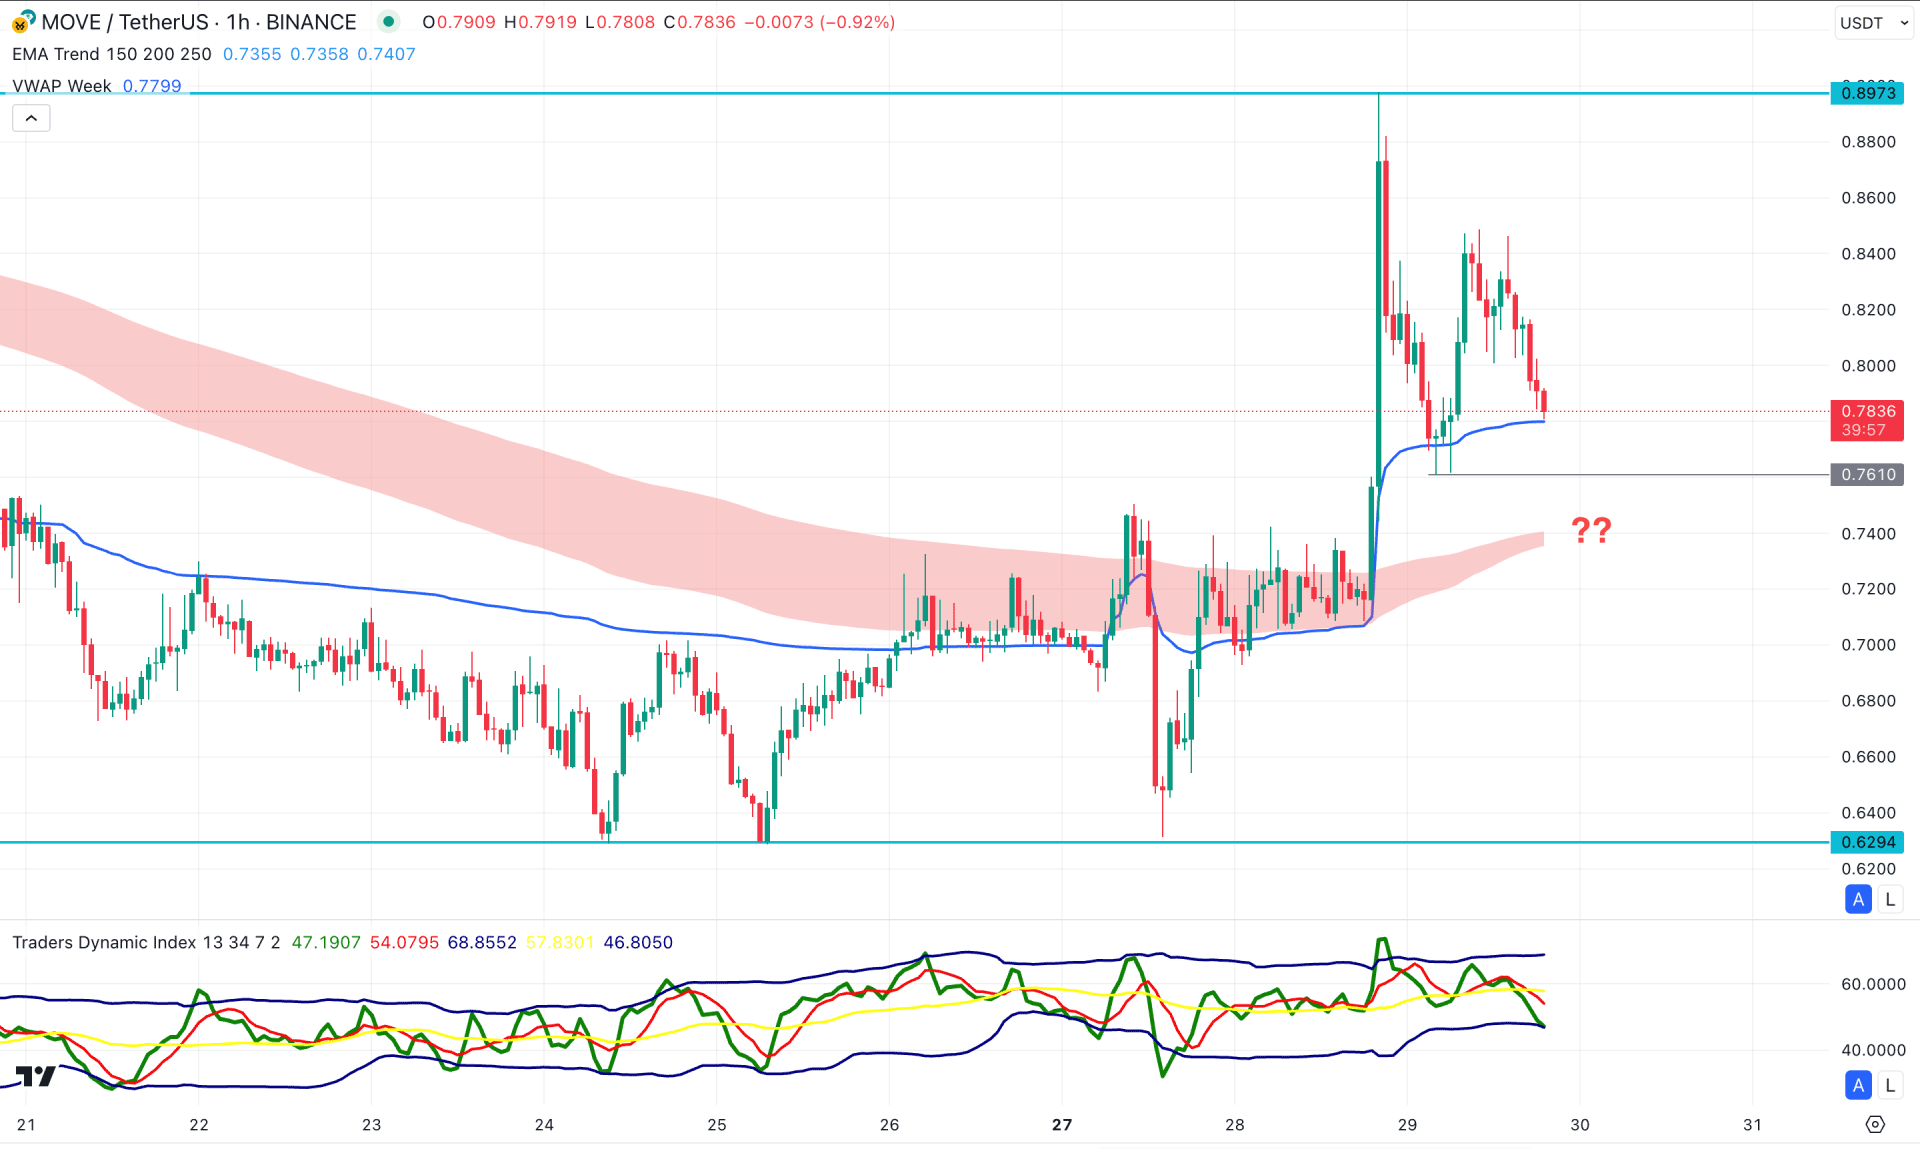
In the intraday chart, the MOVE/USDT is trading under bullish pressure, with the current price hovering above the Moving Average wave zone. However, the buying pressure left a decent triple bottom pattern, which could signal enough retainers' presence in the market.
In the Traders Dynamic Index Indicator, the current TDI line hovers at the lower band area, suggesting a bearish pressure in the market.
Based on this outlook, a failure to hold the price above the 0.7810 support level could lower the price below the 0.6294 support zone. On the other hand, a consolidation from 0.8000 to 0.7000 with a valid recovery above the VWAP line might validate the medium-term bullish trend aiming for the 1.0000 psychological level.
Based on the current market outlook, MOVE/USDT has a higher possibility of forming a bullish continuation after having a valid breakout from the trendline resistance. As of now, the intraday price is still bearish, and a valid recovery is needed before anticipating a trend change.


