
Published: March 11th, 2025
According to reports, asset management company REX-Osprey plans to introduce an exchange-traded fund (ETF) centred on MOVE, the native token of the Movement Network. The action is a major step forward for the second-layer blockchain network and follows the release of Movement's open mainnet beta. Sources claim that this submission is part of a larger trend in which fund sponsors increasingly try to list exchange-traded funds (ETFs) that contain altcoins or alternative digital currencies.
According to Movement Labs co-owner Cooper Scanlon, conventional investors are very interested in obtaining regulated exposure to new blockchain-based technologies. He underlined that many investors are keen to get involved in these developments without having to handle the tokens directly.
Meta created the Rust-based programming language Move, which was used to design the Ethereum layer-2 blockchain. About $250 million is now in the overall value locked (TVL) on the network's unencrypted mainnet. Recent CoinMarketCap data indicates that the ecosystem's powering token, MOVE, has a completely diluted cost of almost $5 billion.
Altcoin ETFs have not yet been approved by the Securities and Exchange Commission of the United States (SEC), even though Bitcoin and Ether ETFs were permitted to list in 2024. Nonetheless, Movement Labs co-founder Rushi Manche showed confidence that adopting such an ETF might defy the status quo and allow institutional money to fund future blockchain technology.
Let's see the upcoming price direction of this coin from the MOVE/USDT technical analysis:
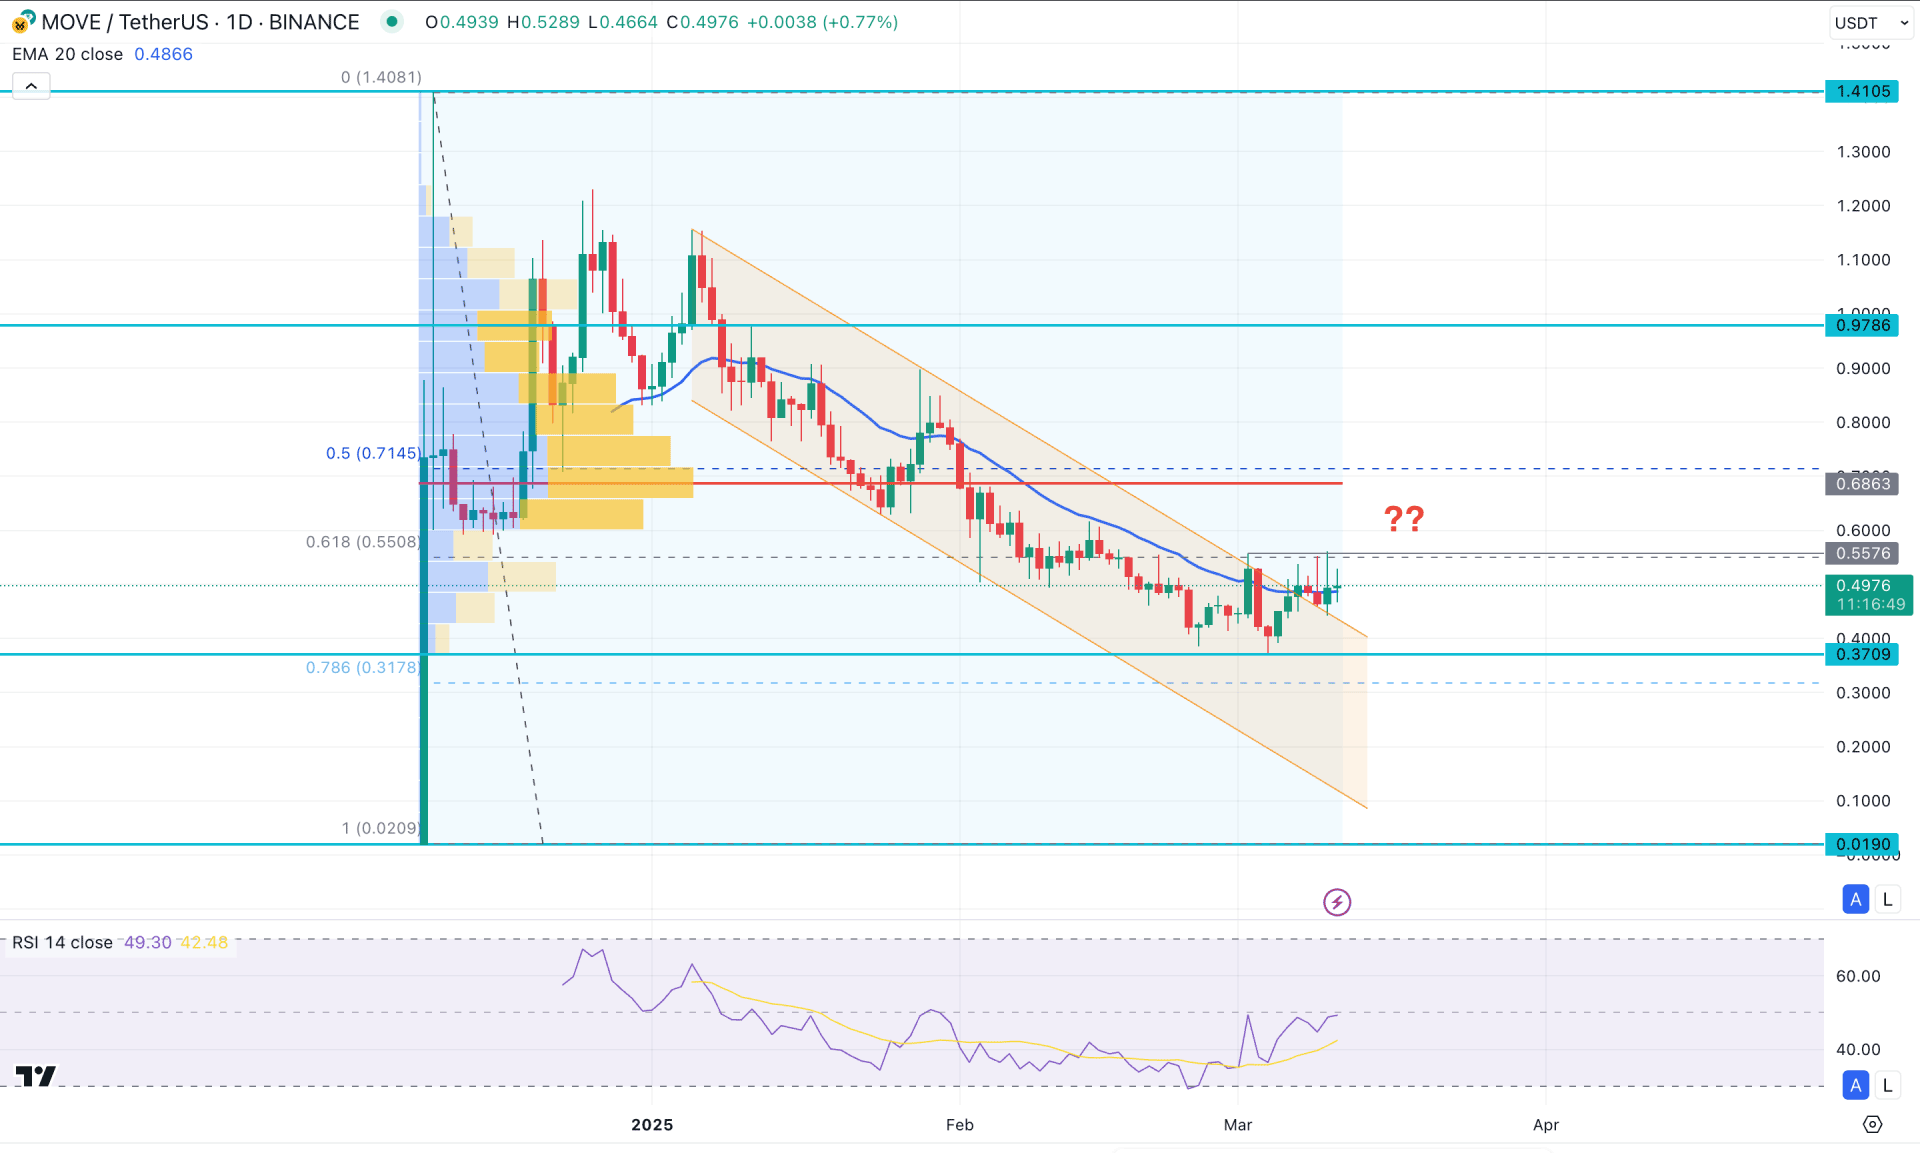
In the daily chart of Movement Coin (MOVE/USDT), the price failed to make new swing highs from the opening date. This is a sign that the PumP is still pending in this coin, which could be initiated from a reliable price zone.
Looking at the higher timeframe, the weekly price became very corrective after forming five consecutive bearish candles. This suggests a potential bottom formation, but proper validation is needed with a bullish break-of-structure.
In terms of volume structure, the largest activity is seen at the 0.6863 level, which is 40% above the current price. Moreover, the price is trading bearishly, reversing from the high volume line, which could limit buying opportunities. The price has also formed multiple supply zones below the high volume area, creating more room for sellers.
On the main price chart, the selling pressure from the 1.1592 high came within a descending channel breakout that occurred after two months. However, the dynamic 20-day Exponential Moving Average is closer to the current price, with increased volatility. Although the bullish breakout has happened, proper validation is not visible. As the price struggles to hold above the resistance, there is a higher possibility of extending lower and creating a new swing low.
In the indicator window, a bullish recovery is seen in the Relative Strength Index (RSI), where the lowest point of 30.00 reached before moving to the 49.02 level. Since the RSI never reached the overbought 70.00 level, multiple attempts to surpass the 50.00 area signal an early bullish breakout opportunity.
Based on the daily market outlook, the sideways momentum needs to be eliminated before forming a bull run. The immediate horizontal resistance is at the 0.5576 level and a breakout above this line with a bullish daily candle could open the way to test the 0.6863 high. The conservative approach is to wait for validation above this high-volume level, which would be a good sign to extend the momentum beyond the 0.9796 level soon.
On the other hand, the price is still struggling with the 20-day Exponential Moving Average. If there is a daily close below the 0.4407 level, this could extend the bearish pressure and drive the price below the 0.3000 psychological level.
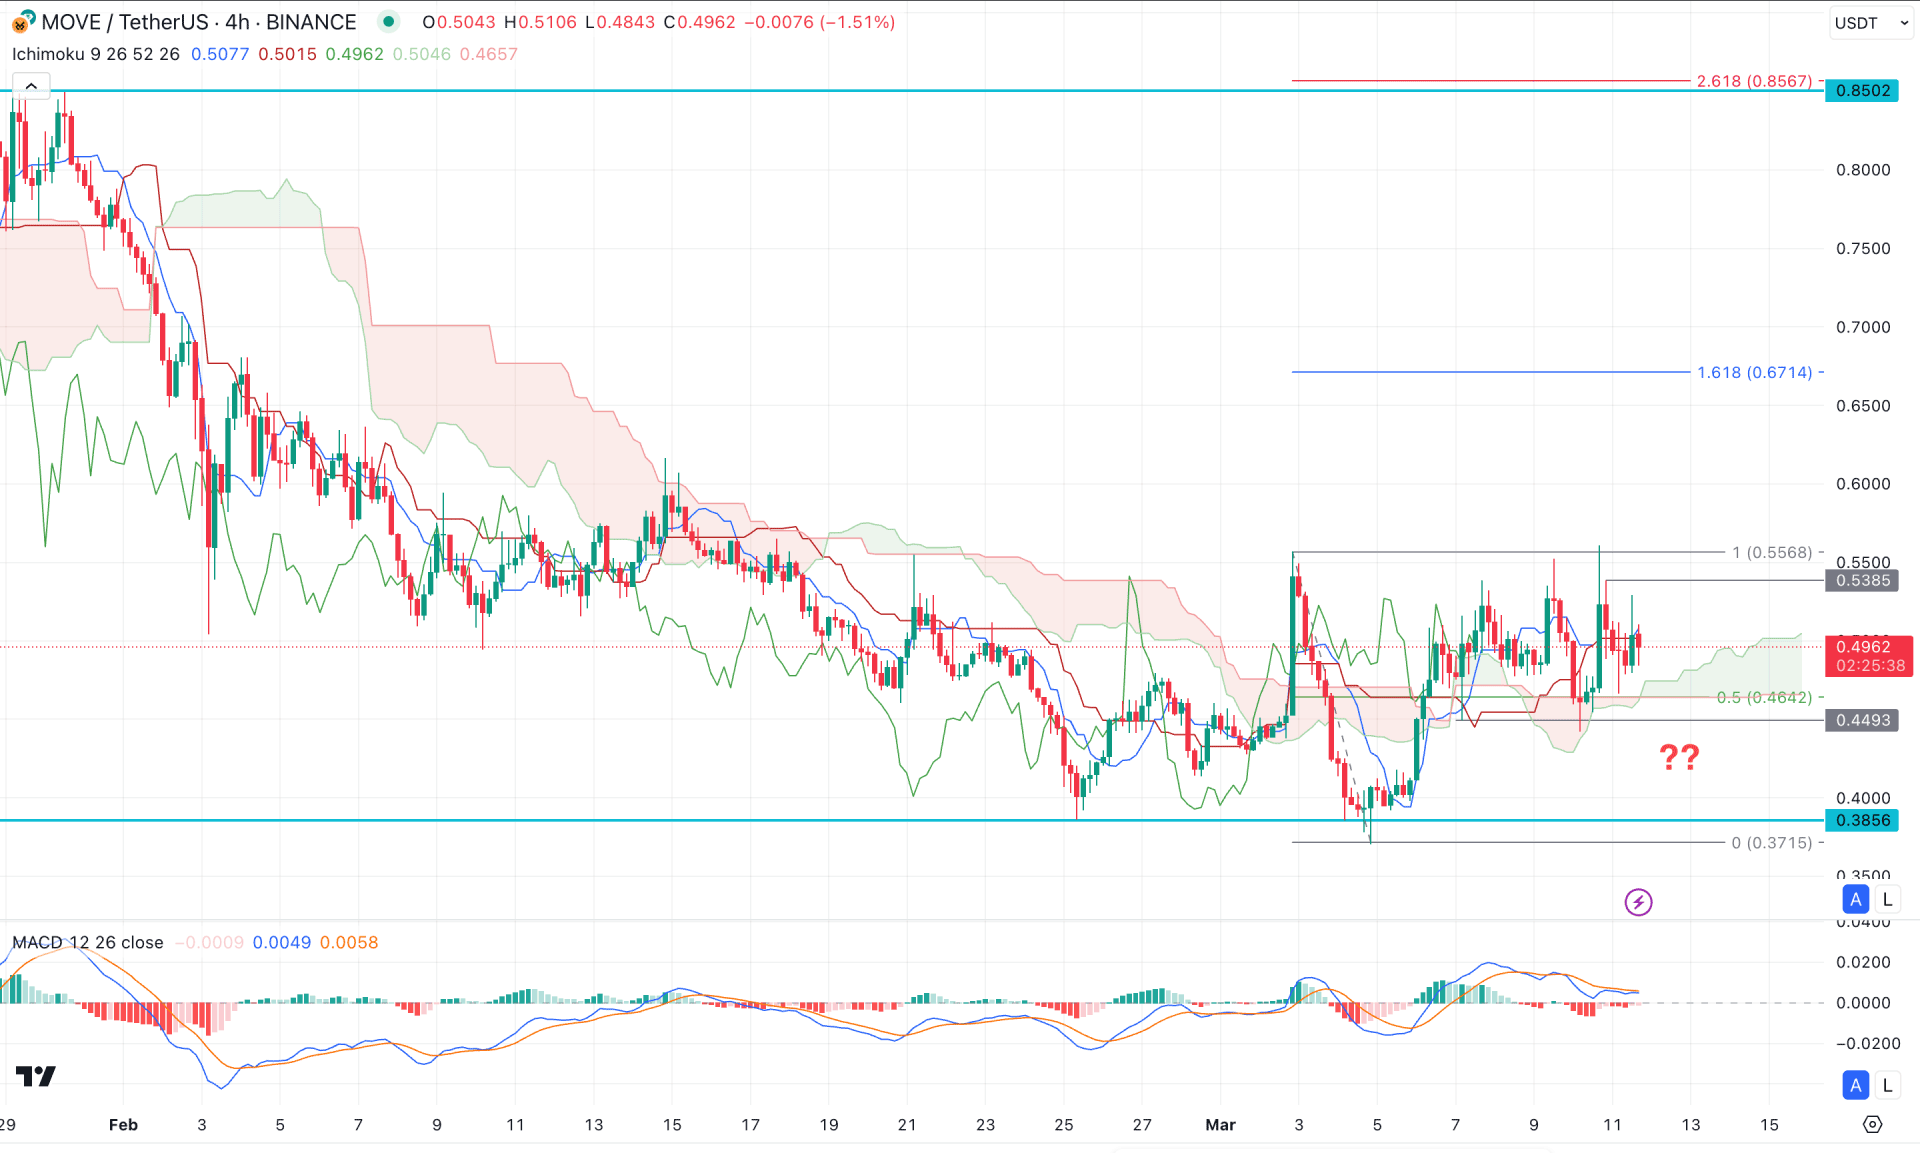
In the four-hour timeframe, the ongoing market momentum is within a bullish pre-breakout structure. The recent price action shows a potential bullish recovery, sweeping liquidity from the 0.3856 low, with an immediate rebound above the cloud support. After the first bullish four-hour candle, the price is still trading above the cloud, suggesting a potential continuation opportunity. Furthermore, both future cloud lines are heading north with a wider gap, which supports the bullish outlook.
In the indicator window, the signal lines have become sideways but remain steady above the 0.00 neutral line. The histogram has started to lose bearish pressure and is hovering at the neutral point, which is also a bullish pre-breakout signal.
Based on the current market outlook, investors should wait for another push above the 0.5385 level with a bullish H4 candle before opening a long opportunity toward the 0.6714 Fibonacci Extension level.
On the other hand, a deeper discount is possible with more liquidity grabs from the 0.4642 to 0.4000 area. However, extended selling pressure below the 0.3856 level could lower the price toward the 0.3000 level.
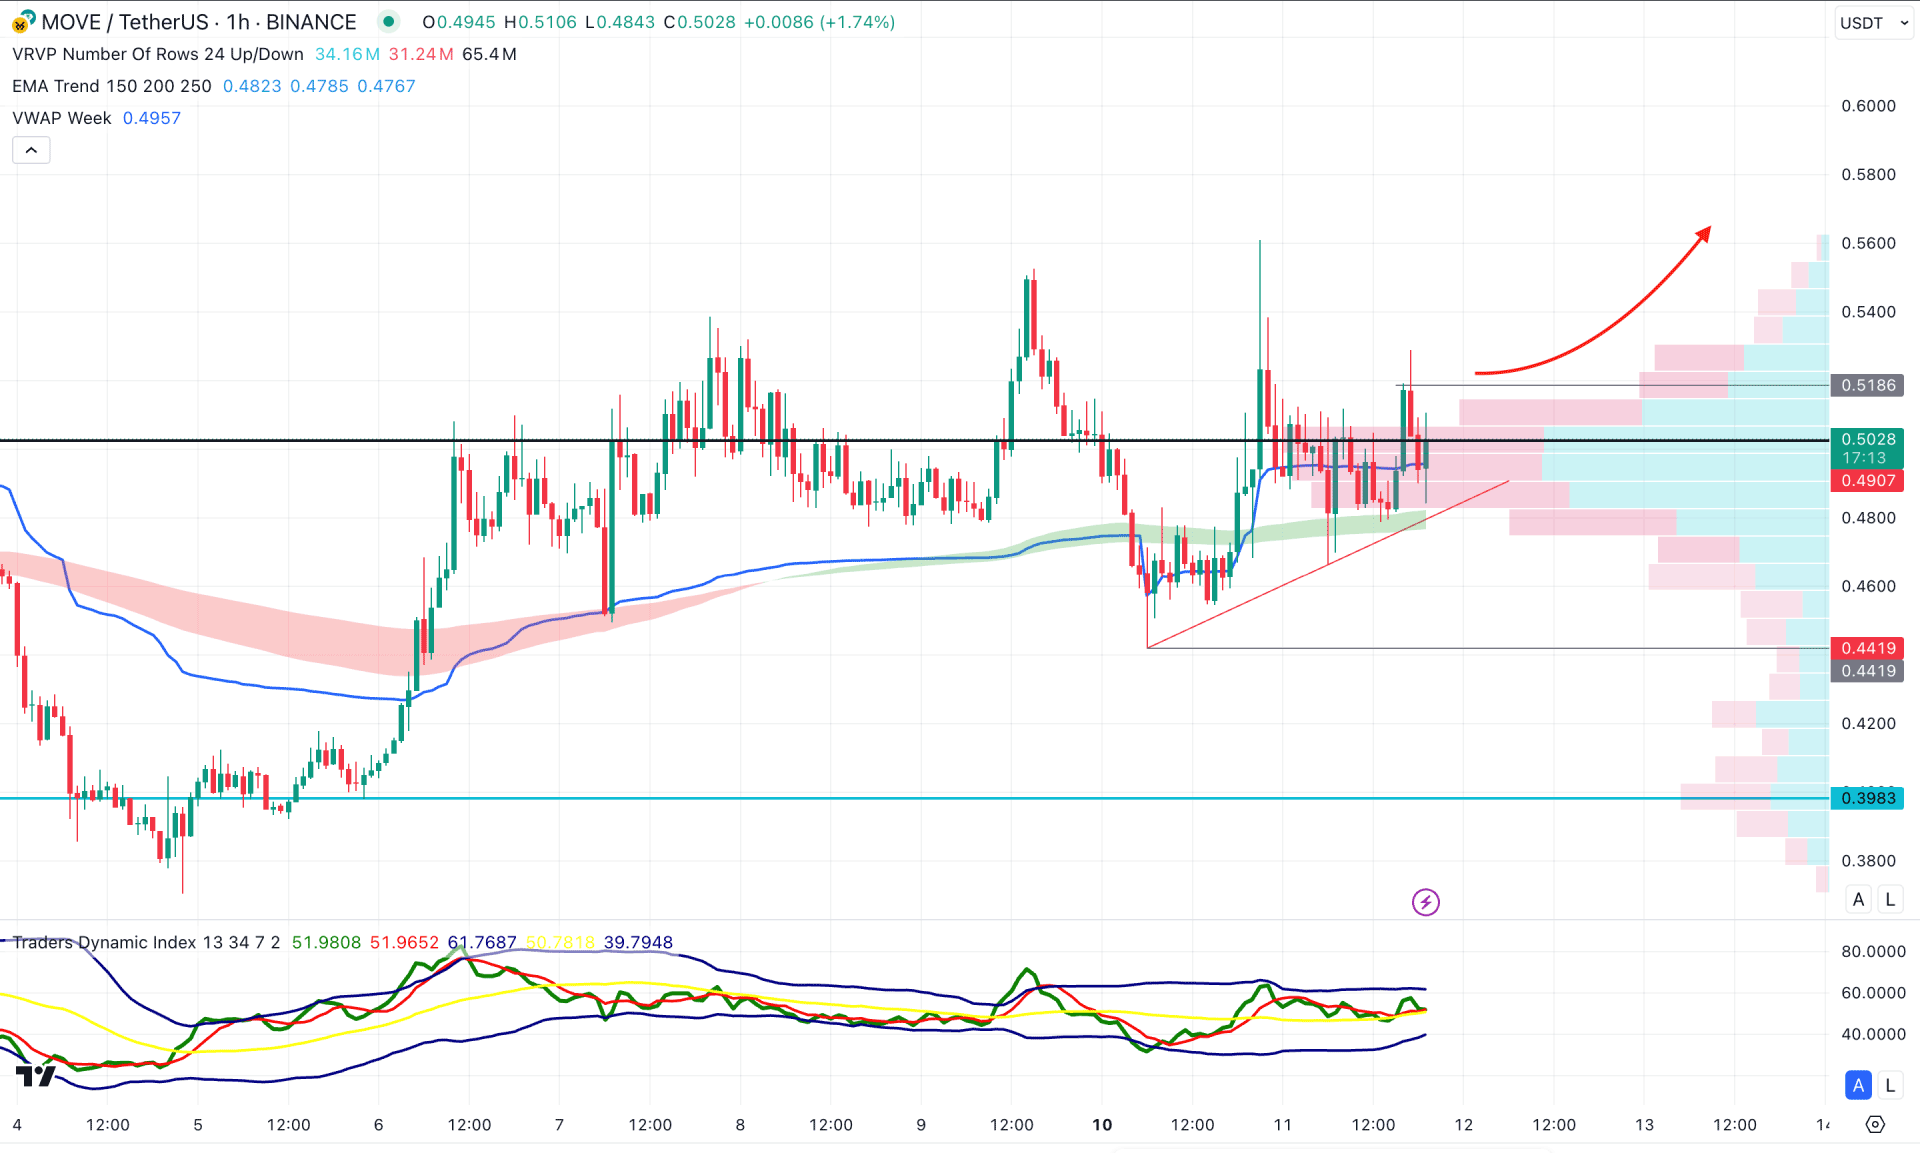
In the hourly time frame, the visible range high volume line is at the 0.5031 level, which is just above the current price. Moreover, the ongoing consolidation at the high volume line is signaling an order-building phase, from which a potential breakout could initiate a bullish impulse. Additionally, the bullish pressure is supported by a rising trendline with confluence from the VWAP level.
Based on the hourly outlook, investors should monitor how the price overcomes the dynamic line. A bullish hourly candle above the 0.5100 level could extend the buying pressure toward the 0.6000 psychological level.
On the other hand, if sufficient sell-side liquidity is present below the most recent trendline support, sweeping the liquidity with a rebound above the VWAP line could present another long opportunity. In both cases, the tolerance level for bullish pressure would be at the 0.4419 level. Any resistance below this level might extend the decline toward the 0.3000 area.
Based on the current multi-timeframe analysis, MOVE/USDT is more likely to form a solid bottom before showing a decent recovery, as the ongoing market momentum is still bearish. Therefore, the intraday price action should be monitored carefully. Any bullish signal after forming a daily range breakout could signal a trend-following trading opportunity.


